RNA gene expression dataset
In this study, we used a dataset of 504 consecutive Chinese patients diagnosed with malignant breast cancer for the TNBC cohort. The study was approved by the FUSCC Ethics Committee, and written informed consent was obtained from each patient.
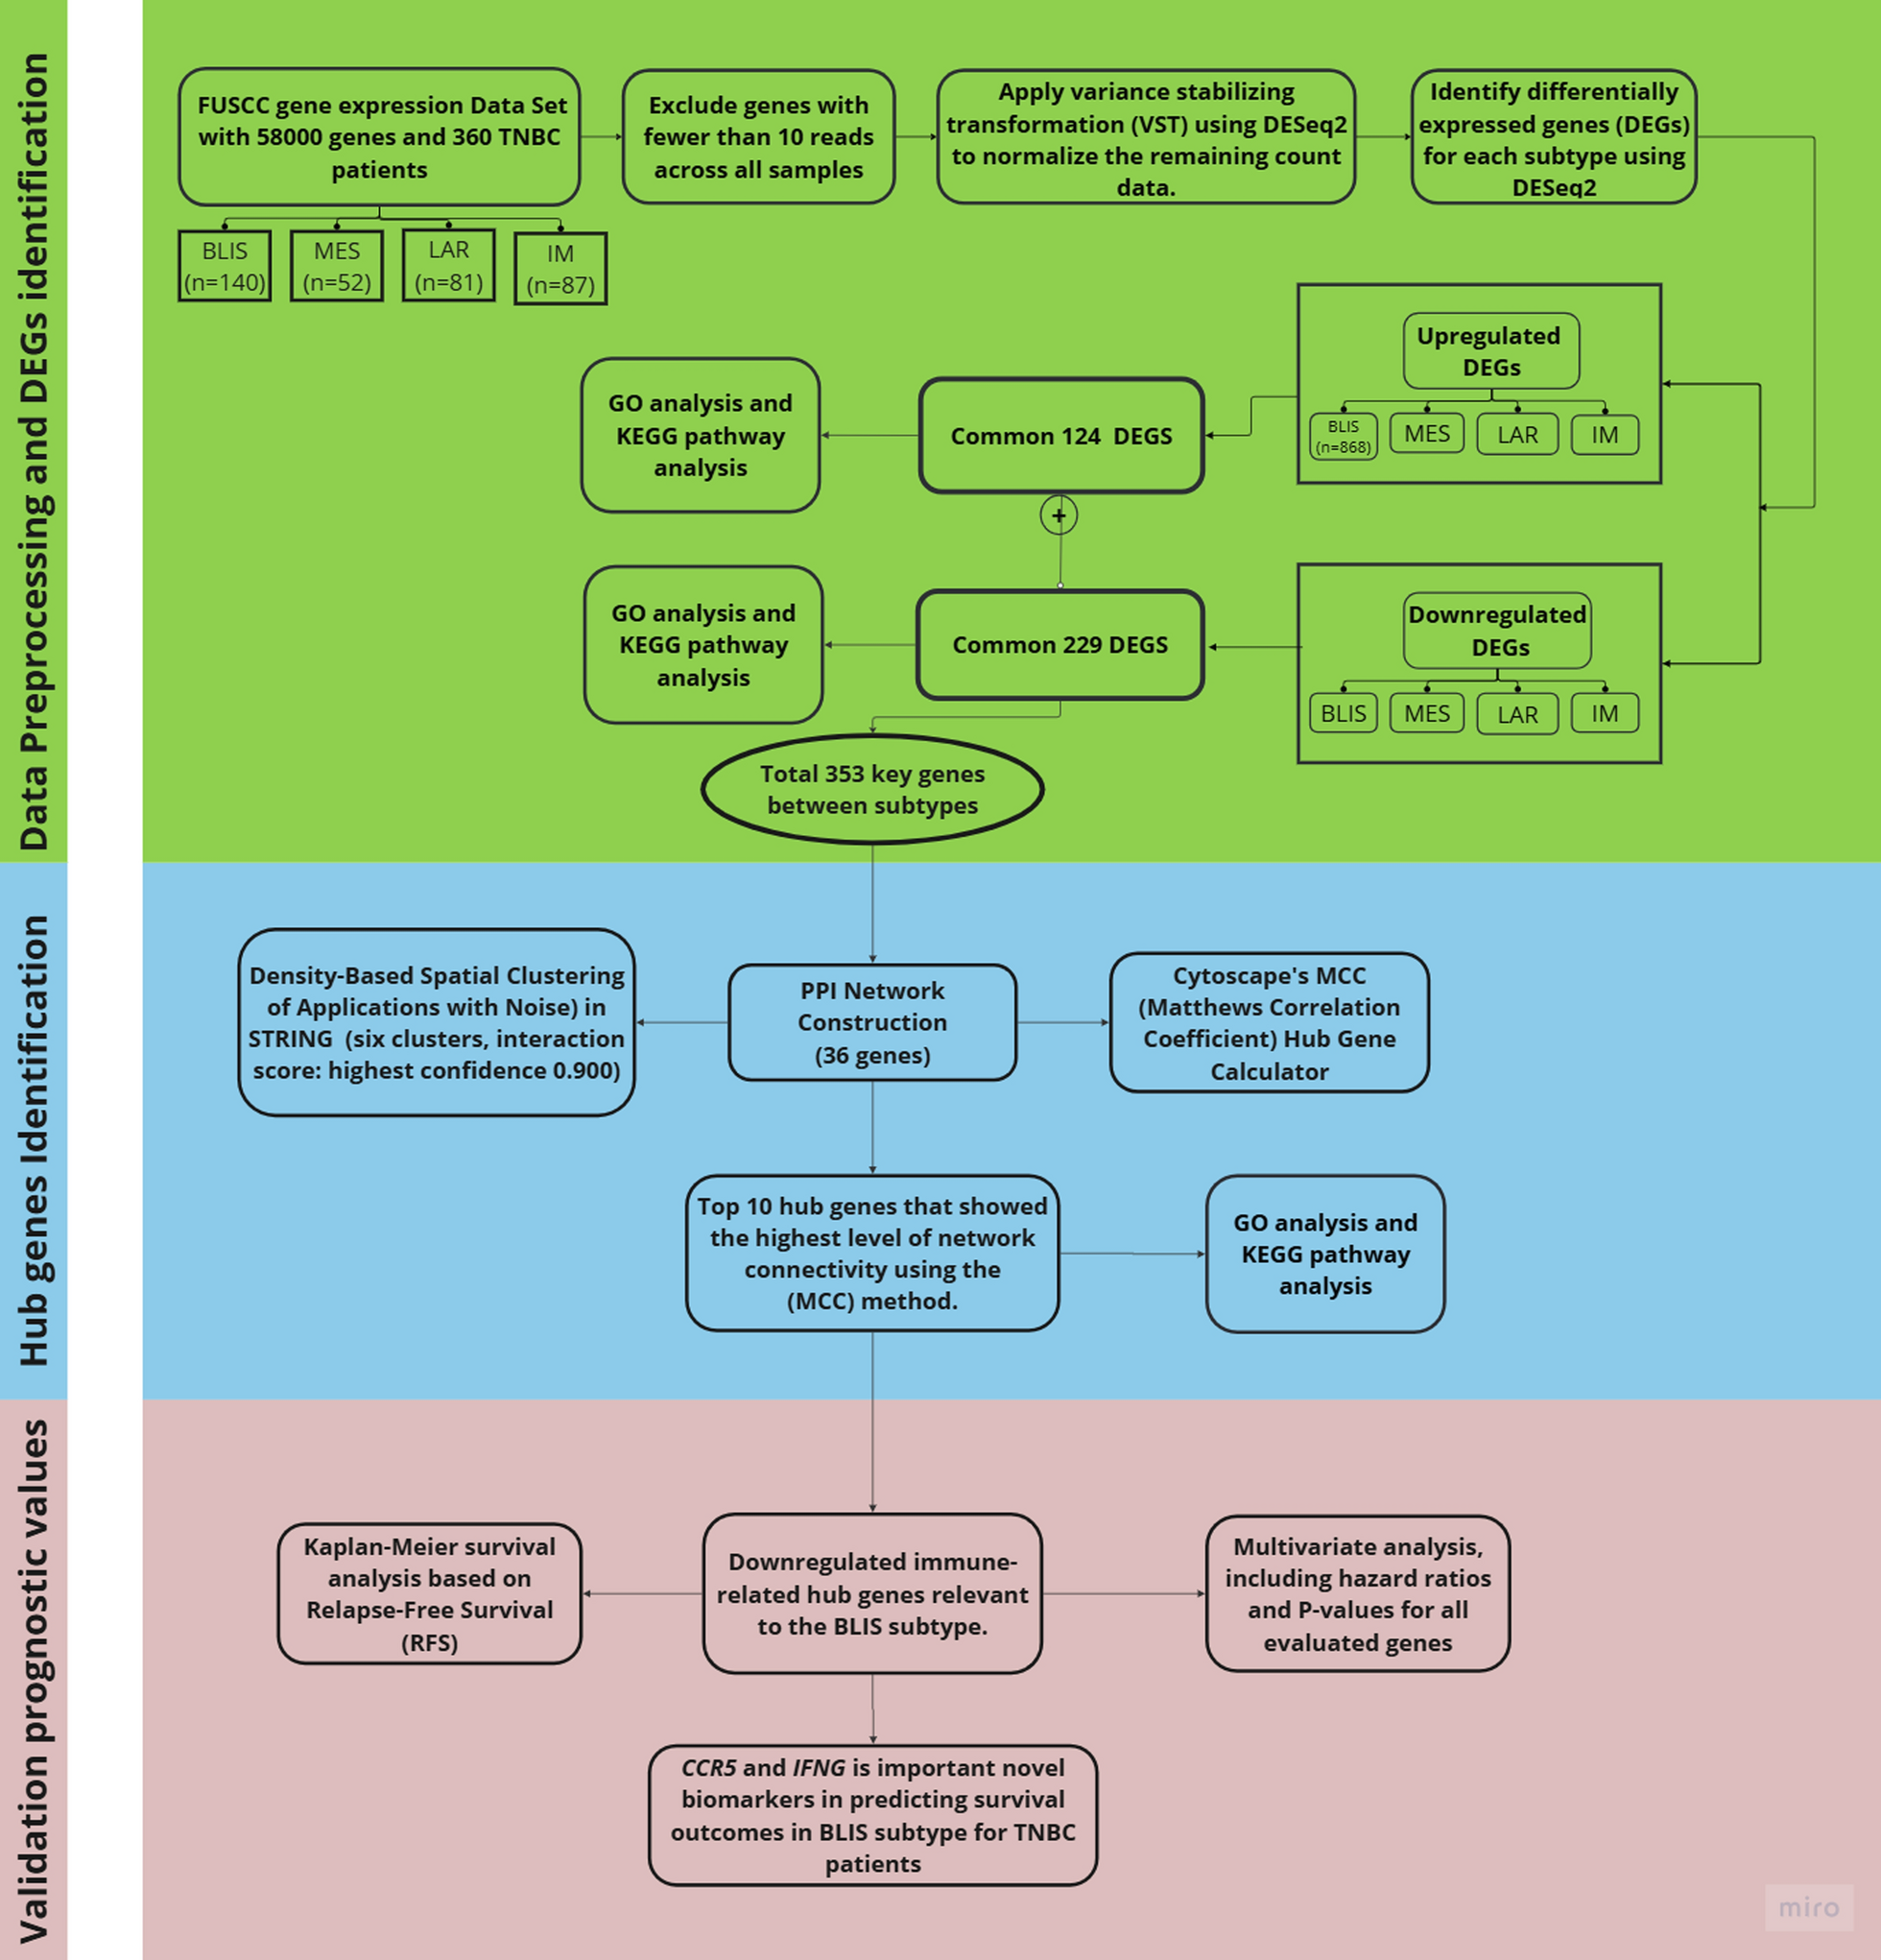
The referenced research [38] provides comprehensive details on data collection and preprocessing methods that were applied by the authors. Building on this, an updated dataset was released [39], which underwent rigorous quality control. The updated profiling files were made available at Figshare (a comprehensive genomic and transcriptomic dataset of TNBC) for data exchange, interpretation, and reuse. Using 2000 highly variable protein-coding genes from RNA-seq data, matched tumor tissues (n = 360) from the dataset were analyzed. To ensure high-quality data from whole-exome sequencing (WES), RNA-seq, and the OncoScan copy number variations (CNV) assay, strict quality control measures were applied by the original authors.
K-means clustering (k = 4) was applied previously in [38], resulting in four distinct TNBC subtypes: BLIS, MES, IM, and LAR subtypes.
TNBC subtypes identified from the FUSCC cohort were distributed as follows: IM (n = 87), BLIS (n = 140), MES (n = 52), and LAR (n = 81). This dataset is highly dimensional, containing expression profiles for approximately 58,000 genes, which emphasizes the complexity and breadth of the gene expression data used in subtype identification [38, 39]. To simplify data handling, statistical analysis, and differential expression analysis, this study utilized RNA-seq data analysis in R (version 4.3.3), employing the tidyverse [40], DESeq2 [41] packages.
Data visualization and transformation were handled using the tidyverse package, differential gene expression was analyzed with DESeq2, data reshaping was managed using reshape2 [42], and Venn diagrams were created with the VennDiagram package. Normalizing and eliminating low-expressed genes produced the count data matrix, which was then aligned with sample metadata. Top DEGs for each subtype were compared using Venn diagrams, Mean Average (MA) plots, and volcano visualizations of the differential expression results.
The raw RNA-seq matrix for four subtypes of TNBC on the data was imported into R for preprocessing. Corresponding sample metadata is also loaded and aligned with the RNA-seq count matrix, ensuring that sample identifiers match across both datasets.
Differential expression analysis was conducted using DESeq2’s negative binomial transformation. For each TNBC subtype, differential expressions were assessed relative to all RNA subtypes, which served as the reference group.
To ensure the inclusion of biologically meaningful data, lowly expressed genes were filtered out by removing those with fewer than 10 reads across all samples. The VST in DESeq2 was used to normalize the remaining count data, stabilizing variance across samples and preparing them for statistical analysis [43].
A threshold of |log₂FC|> 1.5 and adjusted p-value (padj < 0.05) was applied to identify significant DEGs. These criteria were selected to ensure a balance between biological relevance and statistical stringency, capturing genes with both substantial expression changes and strong statistical significance [44].
To visualize the overlap of DEGs across the four TNBC subtypes, a Venn diagram was generated. Additionally, to explore the biological significance of upregulated and downregulated DEGs, a threshold of false discovery rate (FDR) < 0.05 was applied to ensure statistical robustness [45].
The involvement of these DEGs in relevant biological pathways, particularly immune-related pathways, was evaluated using enrichment analyses. The key pathways identified for the upregulated DEGs were found to play crucial roles in metabolic regulation and cellular signaling. To annotate the pathways connected to the identified DEGs, we used the KEGG and GO databases [46].
Immune responses and cytokine signaling pathways were prioritized for further investigation among the downregulated DEGs. For the upregulated DEGs, key pathways included adrenergic signaling in cardiomyocytes, carbohydrate digestion and absorption, and insulin secretion. Immune-related pathways involved cytokine-cytokine receptor interactions, the chemokine signaling pathway, and cytotoxicity mediated by natural killer cells.
Hub genes identification
PPI networks are essential for understanding the functional relationships between genes and their roles in biological pathways. Clustering algorithms, such as DBSCAN, play a crucial role in identifying functionally significant groups of proteins, often reflecting cellular processes and disease mechanisms.
Unlike clustering methods that require a predefined number of clusters, DBSCAN autonomously determines cluster boundaries based on density, making it particularly well-suited for analyzing complex biological data where the number of clusters is unknown a priori [47]. This feature allows for the isolation of core functional groups while filtering out noise—interactions that may be less biologically relevant or arise from experimental inconsistencies.
In this study, we employed a hybrid methodology integrating pathway enrichment analysis with PPI clustering to investigate the biological significance of DEGs. Using the STRING database (version 12.0), we constructed a PPI network based on interaction data from over 24 million proteins across 5,090 organisms. STRING 12.0 offers significant improvements, including enhanced data integration and expanded species coverage, incorporating associations from experimental data, computational predictions, and known interactions.
To ensure high-confidence interactions, we applied a confidence score threshold of 0.70, filtering out low-confidence interactions. The resulting network was built with edges representing functional relationships between genes and nodes corresponding to individual genes. To refine the network further, only high-confidence interactions (≥ 0.900 in STRING) were retained, emphasizing strong and biologically meaningful associations [48]. Unconnected nodes were hidden to enhance network clarity and statistical significance. The final PPI network was visualized using Cytoscape (version 3.10).
DBSCAN was applied to cluster both upregulated and downregulated DEGs, revealing key biological pathways and functional relationships. Since DBSCAN identifies dense regions of highly interconnected proteins, it effectively highlights functionally relevant modules within the network, offering deeper insights into potential molecular mechanisms underlying TNBC subtypes [49].
To further explore the biological significance of the PPI network, hub genes—key regulators with significant functional roles—were identified based on centrality and interaction strength. Using Cytoscape’s CytoHubba plugin, genes were ranked according to their MCC scores, a widely used metric for evaluating classification performance in network analysis [50, 51]. These hub genes may serve as potential biomarkers or therapeutic targets, offering crucial insights into TNBC pathophysiology.
In a PPI network, hub genes are those with the highest number of interactions, indicating their importance in maintaining the network's integrity. To quantify centrality, we calculated the MCC score for each gene using the MCC formula explained in [52]. MCC is a robust measure that considers all four confusion matrix elements, making it more reliable than other centrality measures, especially in unbalanced datasets [53]. The top 11 genes with the highest MCC values were classified as hub genes.
To further characterize network properties, degree distribution, centrality, and other network topology metrics were computed using the Network-Analyzer plugin in Cytoscape [54]. This comprehensive analysis enhances our understanding of TNBC-specific molecular interactions and potential therapeutic targets.
The g-SCS method [55] was employed to evaluate the significance of gene sets associated with various biological processes and pathways for the identified hub genes, with a focus on addressing multiple testing correlations. An adjusted p-value threshold of 0.05 was used to determine significance [56,57,58].
The GO, Reactome, and KEGG were among the databases and ontologies used in the analysis for genes that included both chemokines and their receptors. CXCR3 and CCR5 were among the receptors examined, and the chemokines CXCL10, CXCL9, CXCL11, CCL11, CCL5, CCL4, IFNG, and CX3CL1 were examined.
Hub gene validation and prognostic value
As described by Olivares et al. [59] immune suppression characterizes the BLIS subtype, justifying our focus on immune-related genes. To explore the biological relevance of the downregulated hub genes in TNBC subtypes, we investigated their association with key biological pathways using GO, KEGG, and Reactome databases. The selected pathways, including chemokine-mediated signaling (GO:0070098), leukocyte migration (GO:0050900), and cytokine-cytokine receptor interaction (KEGG:04060), are known to play crucial roles in immune regulation and tumor microenvironment modulation. These pathways are particularly relevant to the BLIS subtype, characterized by immune suppression.
Given the distinct immune dysregulation observed in the BLIS subtype compared to the MES subtype, which emphasizes cell migration and invasion, and the LAR subtype, driven by hormonal signaling, this study focuses on survival analysis for the BLIS subtype. To investigate the relationship between the downregulation of immune-related genes and patient survival in BLIS, we performed a survival analysis to identify potential therapeutic targets within the immune microenvironment.
Overall survival (OS) was selected as the primary endpoint [60]. Kaplan–Meier survival curves were used to compare groups with high and low gene expression levels, with groups defined by median expression across the entire dataset. The best auto-select cutoff function was applied, and all cases were censored at this threshold.
Only patients with estrogen receptor-negative (ER −), progesterone receptor-negative (PGR −), human epidermal growth factor receptor 2-negative (HER2 −), and PAM50 basal-like tumors were included to ensure relevance to TNBC and consistency with the BLIS subtype characteristics.
We selected a set of nine downregulated immune-related hub genes relevant to the BLIS subtype, prioritizing those linked to immune response pathways. The target genes included CXCR3, CXCL10, CXCL9, CCR5, CX3CL1, IFNG, CCL11, CCL4, and CXCL11, as these genes have been associated with immune suppression in BLIS. RFS was also considered to examine the time to relapse in early-stage disease, although OS remained the primary metric.


Comments (0)