Study design and participants
The NHANES has been conducted on an ongoing basis, with public-use data being released in two-year cycles since 1999, and it is sometimes referred to as continuous NHANES [15]. The sample for each two-year cycle is representative of the noninstitutionalized US population. The NHANES is administered by the National Center for Health Statistics (NCHS) at the Centers for Disease Control and Prevention (CDC). The NHANES usually collects questionnaire data through in-person interviews and performs health examinations in the Mobile Examination Center and collects specimens for laboratory tests. More details of the NHANES have been described elsewhere [15]. We used data from the NHANES linked mortality file, which links participants of the NHANES with death records in the National Death Index dataset through December 31, 2019. The research protocol received approval from the Ethics Review Board of the NCHS. Written informed consent from all participants was obtained by NHANES.
The baseline for this current analysis was set in 2001–2004, when all the beverage items to create an HBS were included as part of the 24-h recall dietary interview. Of the 21,161 participants from NHANES at the baseline, we excluded individuals who were aged < 18 years (n = 9,548), who did not have beverage data at baseline (n = 1,362), who were pregnant or breastfeeding (n = 639), who reported implausible daily energy intake (< 500 or > 3,500 kcal/d for women, and < 800 or > 4,200 kcal/d for men) (n = 706), or who did not have follow-up data (n = 12). Finally, we included 8,894 participants in the final analyses (Supplementary Fig. 1).
Dietary measurements
Dietary data were collected through 24-h dietary recall interviews. After initial 24-h dietary recall, a second-recall via telephone was conducted between 3 and 10 days later [15]. In-person interview took place in a private room at NHANES mobile examination center, using computer-assisted dietary interview system administered by NHANES interviewer [15].
To classify the specific types of coffee, tea, low-fat milk, whole-fat milk, fruit juice, ASB, and SSB, we linked NHANES dietary data to the United States Department of Agriculture (USDA) Food and Nutrient Database for Dietary Studies (FNDDS) and the Food Patterns Equivalents Database (FPED), and we only used the beverage data collected by the initial 24-h dietary recall, in line with the availability of FNDDS and FPED [16, 17]. For alcohol consumption, the intake data were available from NHANES and calculated as the average of the two dietary recalls. According to the approach by Rodríguez-Ayala et al. [12], we created an HBS, including coffee and tea, low-fat milk, whole-fat milk, fruit juice, ASB, SSB, and alcohol. Specifically, for healthier beverage items, including coffee and tea, low-fat milk, we gave a score of 1 to no consumption, and gave a score of 2, 3, and 4 to the lowest, second, and highest tertile of consumption, respectively. In contrast, for less healthier beverages, including whole-fat milk, fruit juice, ASB, SSB, and alcohol, we gave a score of 4 to no consumption, and a score of 3, 2, and 1 to the lowest, second, and highest tertile of consumption, respectively. We summed the individual score from each beverage to create an HBS, which theoretically ranged from 7 (lowest adherence) to 28 (highest adherence) (Supplementary Table 1). A higher HBS reflected a greater adherence to a healthy beverage pattern. Supplementary Table 2 presents the amount of individual beverage consumption across the quartiles of HBS.
Ascertainment of outcomes
The NHANES participant data were linked to the NCHS National Death Index (NDI), and mortality information was updated through December 31, 2019 [18]. All-cause mortality and cause-specific mortality, including CVD mortality, cancer mortality and other mortality, were our primary outcomes. The 10th revision of the International Classification of Diseases (ICD-10) was used to identify the underlying cause of death. For example, CVD deaths were determined by ICD-10 codes: I00-I09, I11, I13, I20-I51, and I60-I69. Cancer deaths were determined by ICD-10 codes: C00-C97 [19].
Assessment of covariates
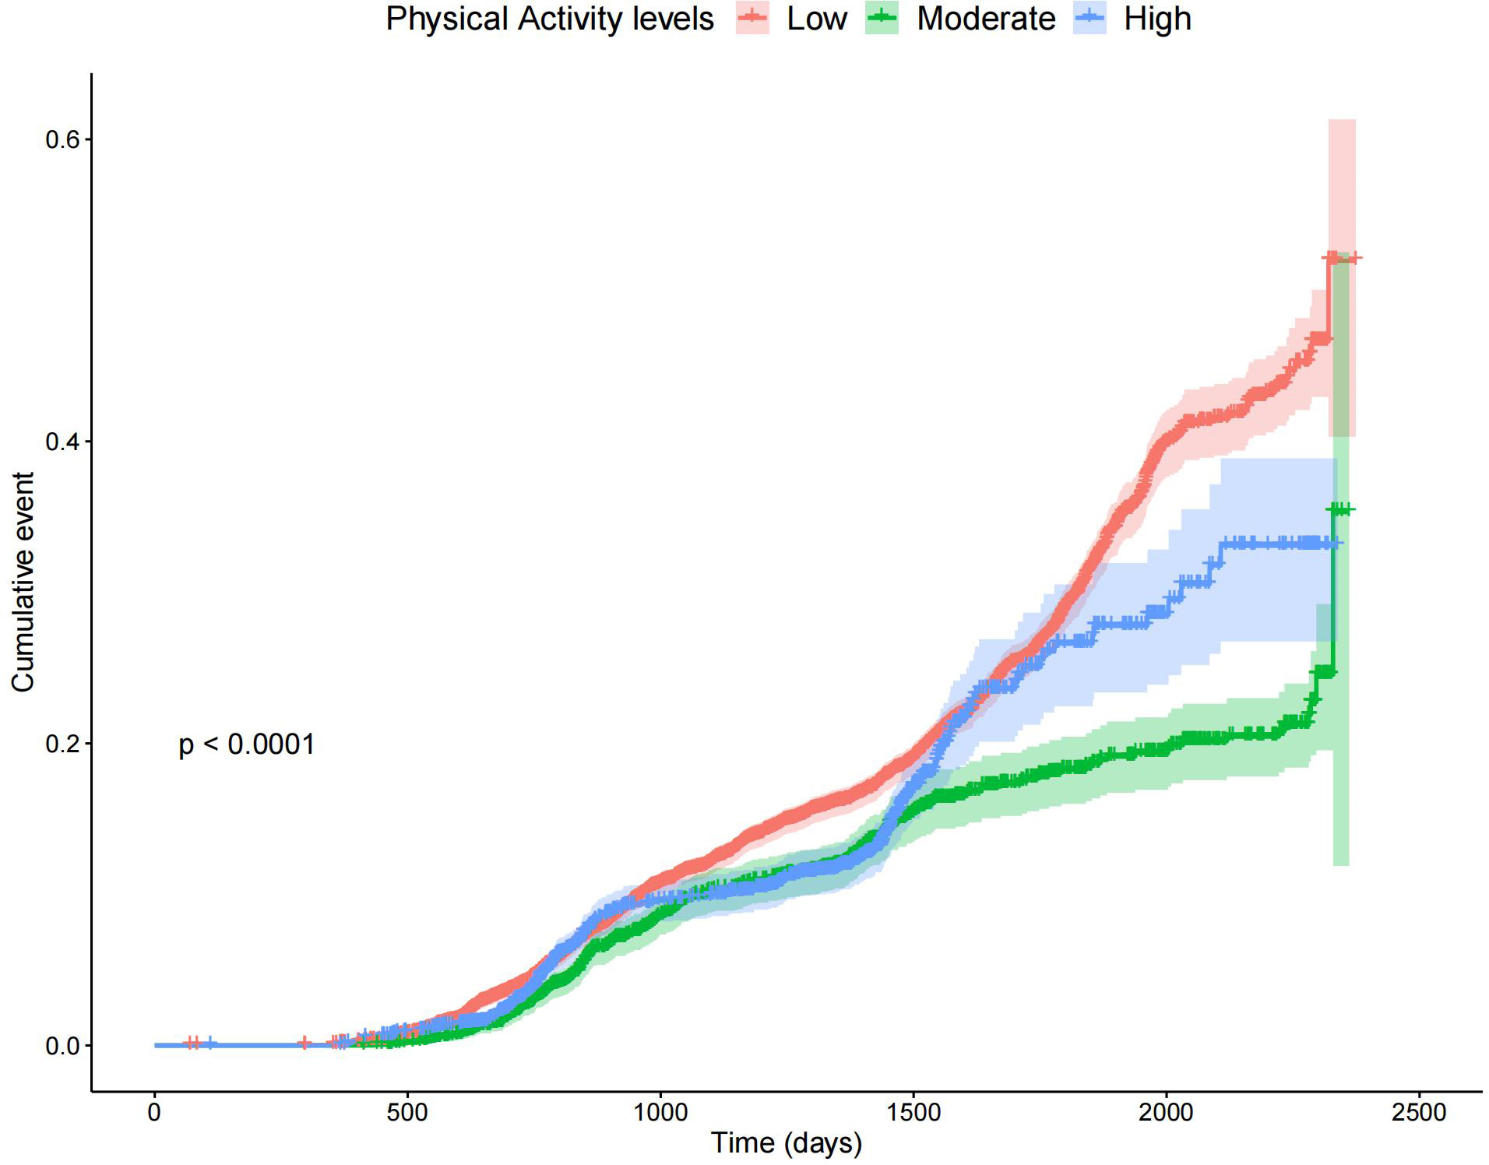
Information on the demographical, lifestyle, social economical, and medical covariates, such as age, sex, education, race, income-poverty-ratio (PIR), body mass index (BMI), physical activity, medication use, smoking status, hypertension status, and hyperlipidemia status were obtained through home interviews and clinical examinations [15]. We also recorded prescribed medications to consider prevalent morbidity. Dietary covariates, including daily energy intake, dietary fiber consumption, fruit consumption, vegetable consumption, and meat consumption, were collected through 24-h dietary recall interviews [15]. Data on physical activity were extracted from the NHANES self-reported physical activity questionnaire. We assessed physical activity by calculating the total metabolic equivalent minutes per week (MET-minutes/week), which took into account the type, frequency, and duration of exercise performed each week, using the recommended MET values provided by NHANES for each exercise type. Physical activity (MET-minutes/week) = MET*weekly frequency*duration of each physical activity [20]. Healthy Eating Index-2015 (HEI-2015) was computed by summing scores for 13 vital dietary components, including nine adequacy components (total fruits, whole fruits, total vegetables, green and beans, whole grains, dairy, total protein foods, seafood and plant proteins, and fatty acids) and four moderation components (refined grains, sodium, added sugars, and saturated fats) [21].
Statistical analysis
In the statistical analysis, we accounted for the multistage sampling design of NHANES using the primary sampling unit and stratum variables and applied complex survey weights.
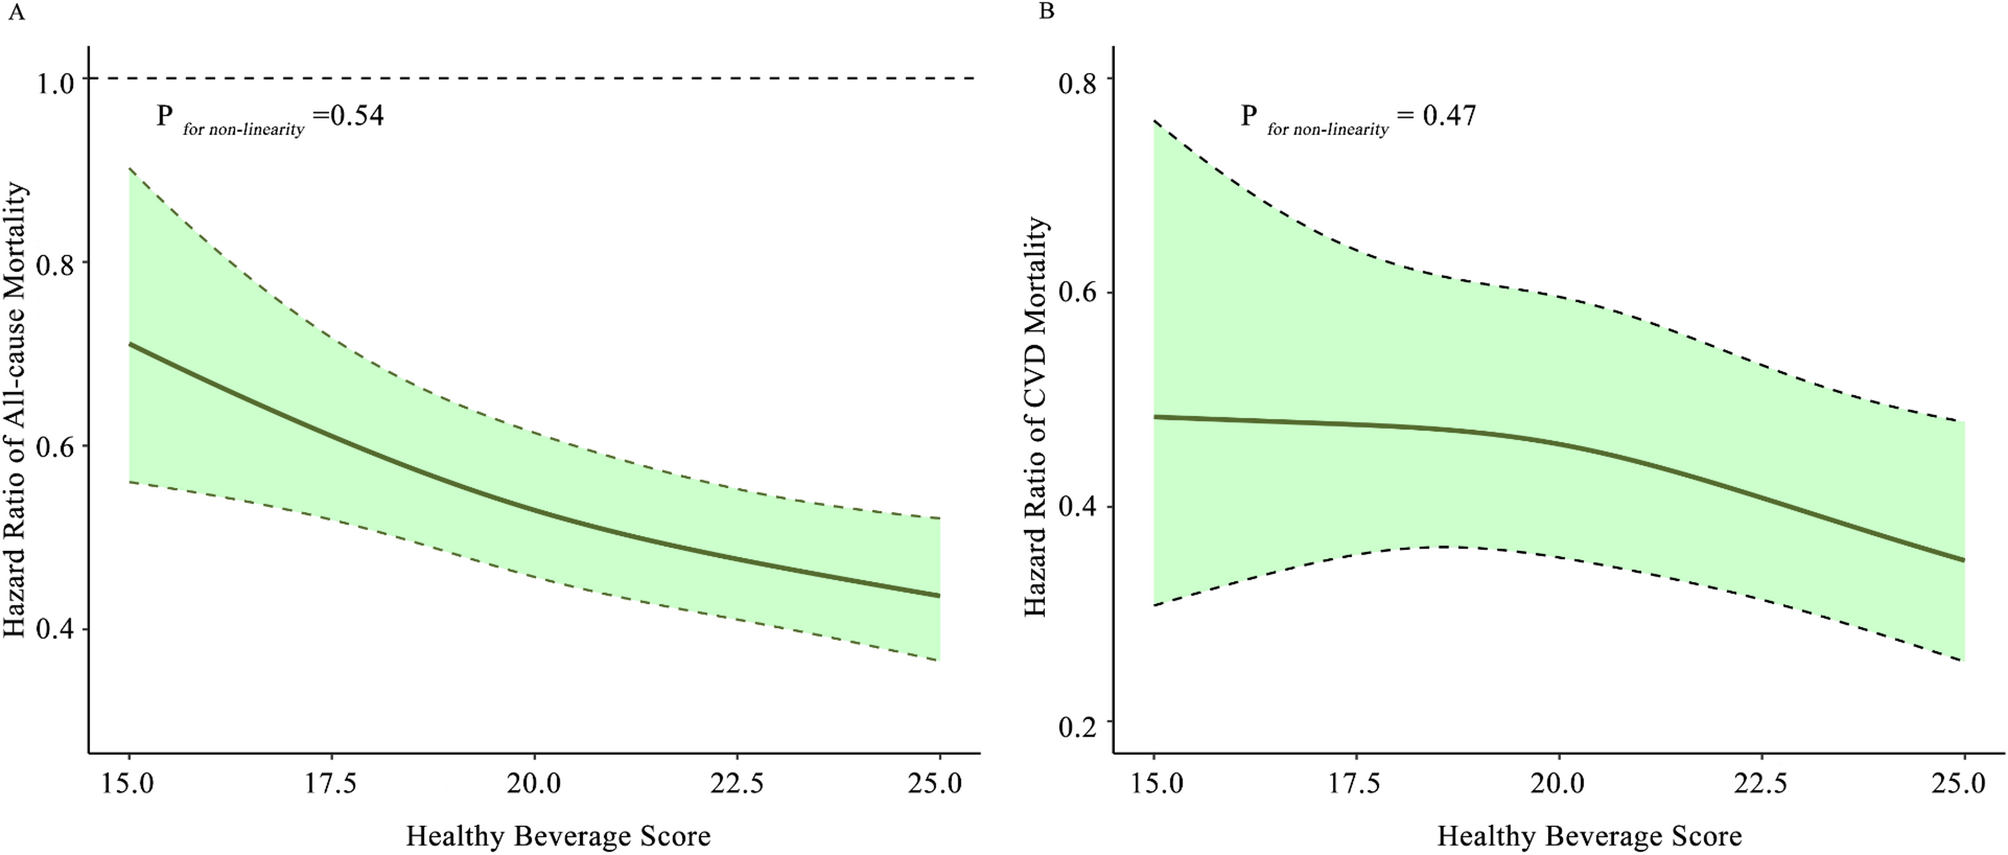
We calculated the follow-up time from baseline to the date of death, or the end of the follow-up. We used Cox proportional hazards models to examine the associations of adherence to the HBS and all-cause and cause-specific mortality. We adjusted for age and sex in model (1) We further adjusted for race, smoking, PIR, education level, BMI, hypertension, hyperlipidemia, number of medicines, daily energy intake, dietary fiber consumption, fruit consumption, vegetable consumption, meat consumption, and physical activity in model (2) We further tested the significance of linear trends by modelling the median value within each category of the HBS as a continuous variable and then examining the significance of this variable. To explore the dose-response relationship of the HBS with mortality, we fitted cubic spline regressions, where the same covariates in the primary analyses were adjusted.
We conducted stratified analyses predefined by several key risk factors, including age (< 50, ≥ 50 years), sex (male, female), smoking status (current, former and never), dietary fiber intake (≤ median, >median), daily energy intake (quartiles), hypertension (yes, no), hyperlipidemia (yes, no), and HEI-2015 (≤ median, >median). We examined the interaction impacts of HBS with risk factors by adding an interaction term of HBS and risk factor in the fully adjusted model. Given the potential for multiple testing, we set the statistical level for significance for these interactions at 0.006 (0.05/8 comparisons).
We also performed several sensitivity analyses to test the robustness of our study results based on fully adjusted models (model 2). First, we repeated the associations by excluding one component from the HBS at one time, to explore whether any beverage items mainly explained the associations. Second, we repeated the analyses by excluding individuals who died within the first 2 years of follow-up. Third, we repeated the analyses by excluding participants with prevalent CVD at baseline. Fourth, we examined the Pearson correction of HBS with an overall diet quality, assessed by HEI-2015, as well as additionally adjusted for HEI-2015 in replace of individual dietary factors, such as fruit intake, vegetable intake, and meat intake. Finally, we analyzed the associations of HBS with specific other mortality, such as mortality due to neurodegenerative disease, and kidney disease.
The missingness of covariates ranged from 0.1 to 28%, such as 0.1% for education, 3% for BMI, and 6% for PIR. Of which, only data on physical activity had a 28% missingness, and others had missingness less than 10%. We used the multiple imputation to impute the missing data of covariates [22]. We conducted statistical analyses using R version 4.4.2. P < 0.05 was considered to indicate statistical significance, unless otherwise.


Comments (0)