
Remember me


From November 1, 2021, to December 20, 2022, a cluster randomized controlled trial was conducted in the rural Kersa district, Jimma zone, Southwest Ethiopia. Kersa district is located 330 km from Ethiopia’s capital city. The district’s altitude ranges from 1,740 to 2,660 m above sea level, with consistent rainfall between 1,200 and 2,800 mm. Of the 26 kebeles (the district’s smallest administrative units), four are semi-urban, while twenty-two are rural. According to the district’s 2018 report, the population includes 83,579 men and 81,812 women. Additionally, 3,651 children aged six to twenty-three months reside in the district. The area is distinguished by a midland agro-ecological context, focusing on cereal and legume cultivation, with some areas also producing Khat.
Trial designA cluster randomized controlled trial was conducted within a community to assess the effect of BCC on two arms. The trial involved two measurements taken at baseline and endline to evaluate changes over time. Study participants were randomly assigned to either the intervention or control group in an allocation of 1:1 ratio through a cluster randomized controlled group trial. In the intervention group, participants received BCC regarding child feeding practices and preparation of complementary foods using locally available cereal-based ingredients. WDAs delivered BCC to the intervention group; on the other hand, the control group received routine health education from HEWs. The research team followed the participants for a year after the recruitment period. The intervention began in December 2021 and continued with follow-up until December. 2022. After twelve months, the same data collectors administered the same questionnaires to both the intervention and control groups as part of the endline survey. At the end of the data collection process, the intervention’s key message on BCC was provided to the control group within one day for ethical reasons.
Participant recruitmentThe study included children 6–23 months old and their respective mothers from randomly selected kebeles. All mother-child pairs who lived in the study area for six months and were available during the study period were eligible to participate. Children who had received supplementation for the treatment of malnutrition didn’t participate in the research. Because supplementation can cause a change in feeding habits; it may obscure the observable effects of the intervention. The research team excluded child mothers and caregivers who did not volunteer to give consent.
Sample size determination and proceduresThe sample size was estimated using G-POWER software version 3.1.5. Based on the previous study in SSNP considering the expected change of intervention is 0.4 [34], 5% level of significance (\(\:\alpha\:\) 0.05; \(\:_\)=1.96; two-tailed tests), and a power of 80% (\(\:_\) = 0.84). The estimated sample size for each group was 100 mother-child pairs. Including design effects of 2 and 10% non-response rates, the total sample size was 440: 220 for intervention and 220 for control with an allocation ratio of 1:1.
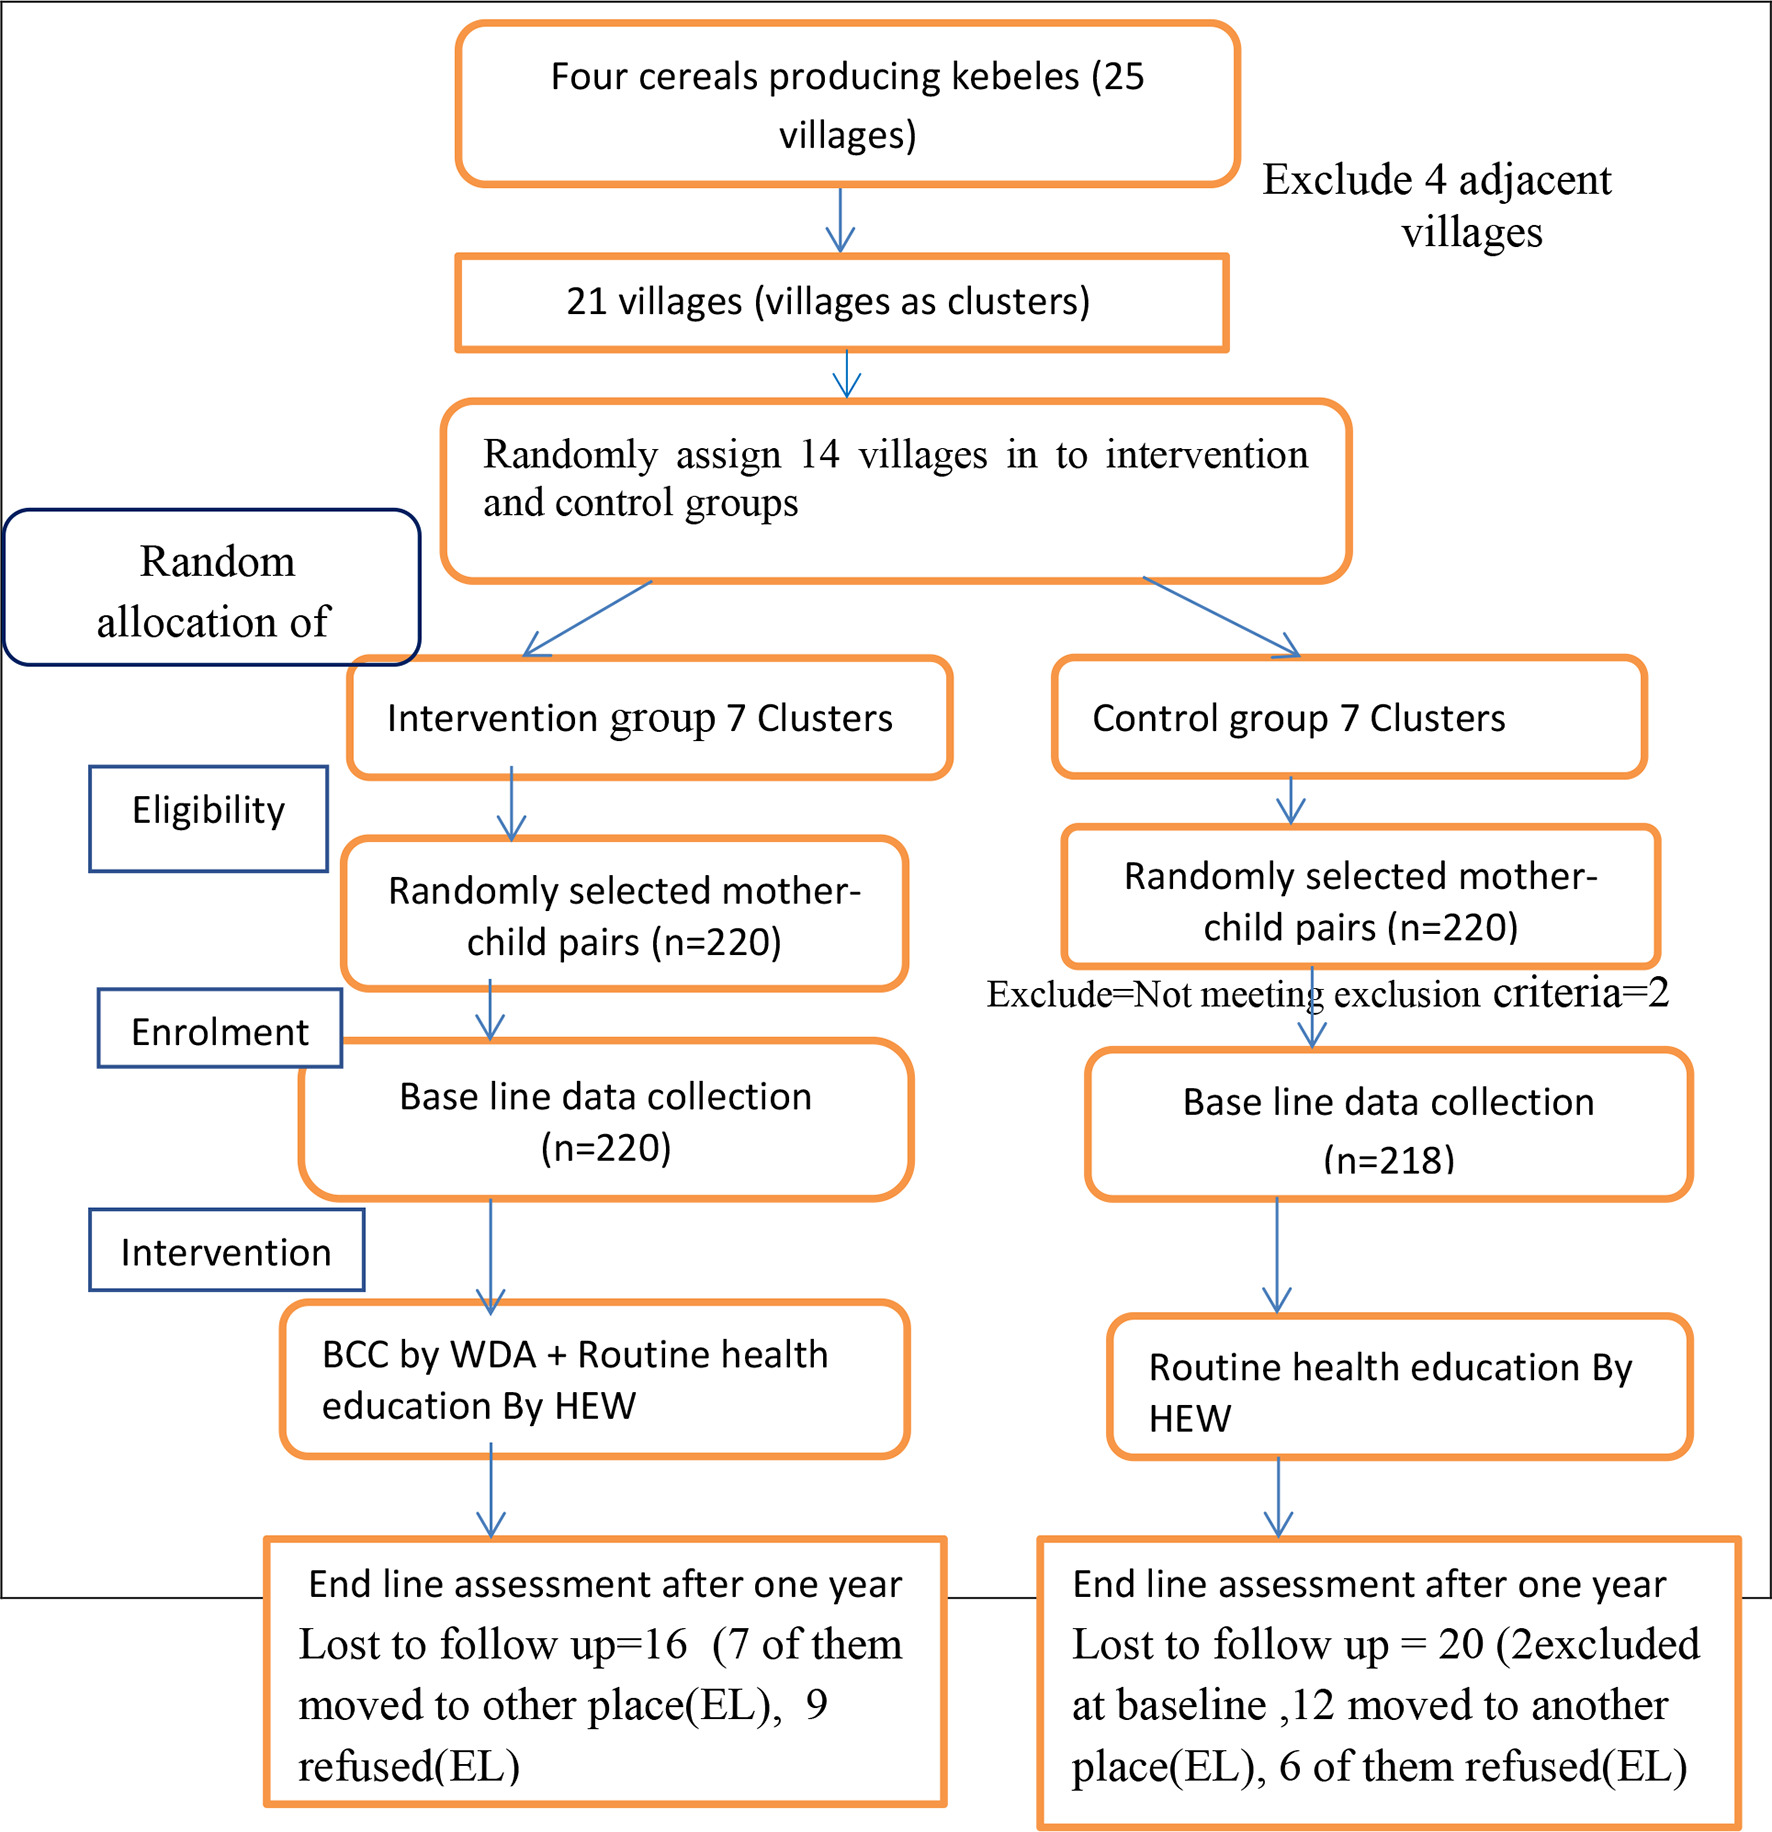
Cluster randomization and intervention allocationThe study followed cluster randomization to allocate the participants for control and intervention groups. A two-stage cluster sampling method was employed to choose the study subjects. Four kebeles were selected at random from a total of 22 of the district’s rural kebeles, which were selected by their primary agricultural products, such as grains and legumes. Those selected kebeles consist of 25 villages (the smallest administration unit of kebeles) with a total population of 1194 children aged 6–23 months. Villages were considered as a cluster to choose the research participants. From the total villages, four adjacent villages between the intervention and control groups were identified and excluded to prevent information contamination, and then from the remaining 21 villages, 14 (67%) were randomly selected. A statistician who was not part of the study generated a randomized allocation sequence using computer-generated random numbers from 1 to 10 villages for control and 1 to 11 for intervention. Both the intervention and control arms have seven clusters for each. The sample size was then distributed proportionally according to the total number of children aged 6–23 months for each of the selected fourteen villages in both groups using the health extension worker’s family folder. In households having more than one child, the youngest was eligible. This procedure is performed before the baseline assessment. Initially, a total of 440 mothers and children aged 6–23 months were recruited for the baseline survey. However, after excluding 2 children who did not meet the inclusion criteria, the final number of mother-child pairs included was 438 at baseline. However, the endline data were 200 mother-child pairs in the control group and 204 in the intervention group due to loss to follow-up, making a total of 404 pairs. The study participants, data collectors, and supervisor were not blinded about the intervention as there was a buffer zone separating the control and intervention kebeles, and they did not share or utilize the common health facilities or other community services. The trial was conducted based on the CONSORT Guidelines (Fig. 1) [35].
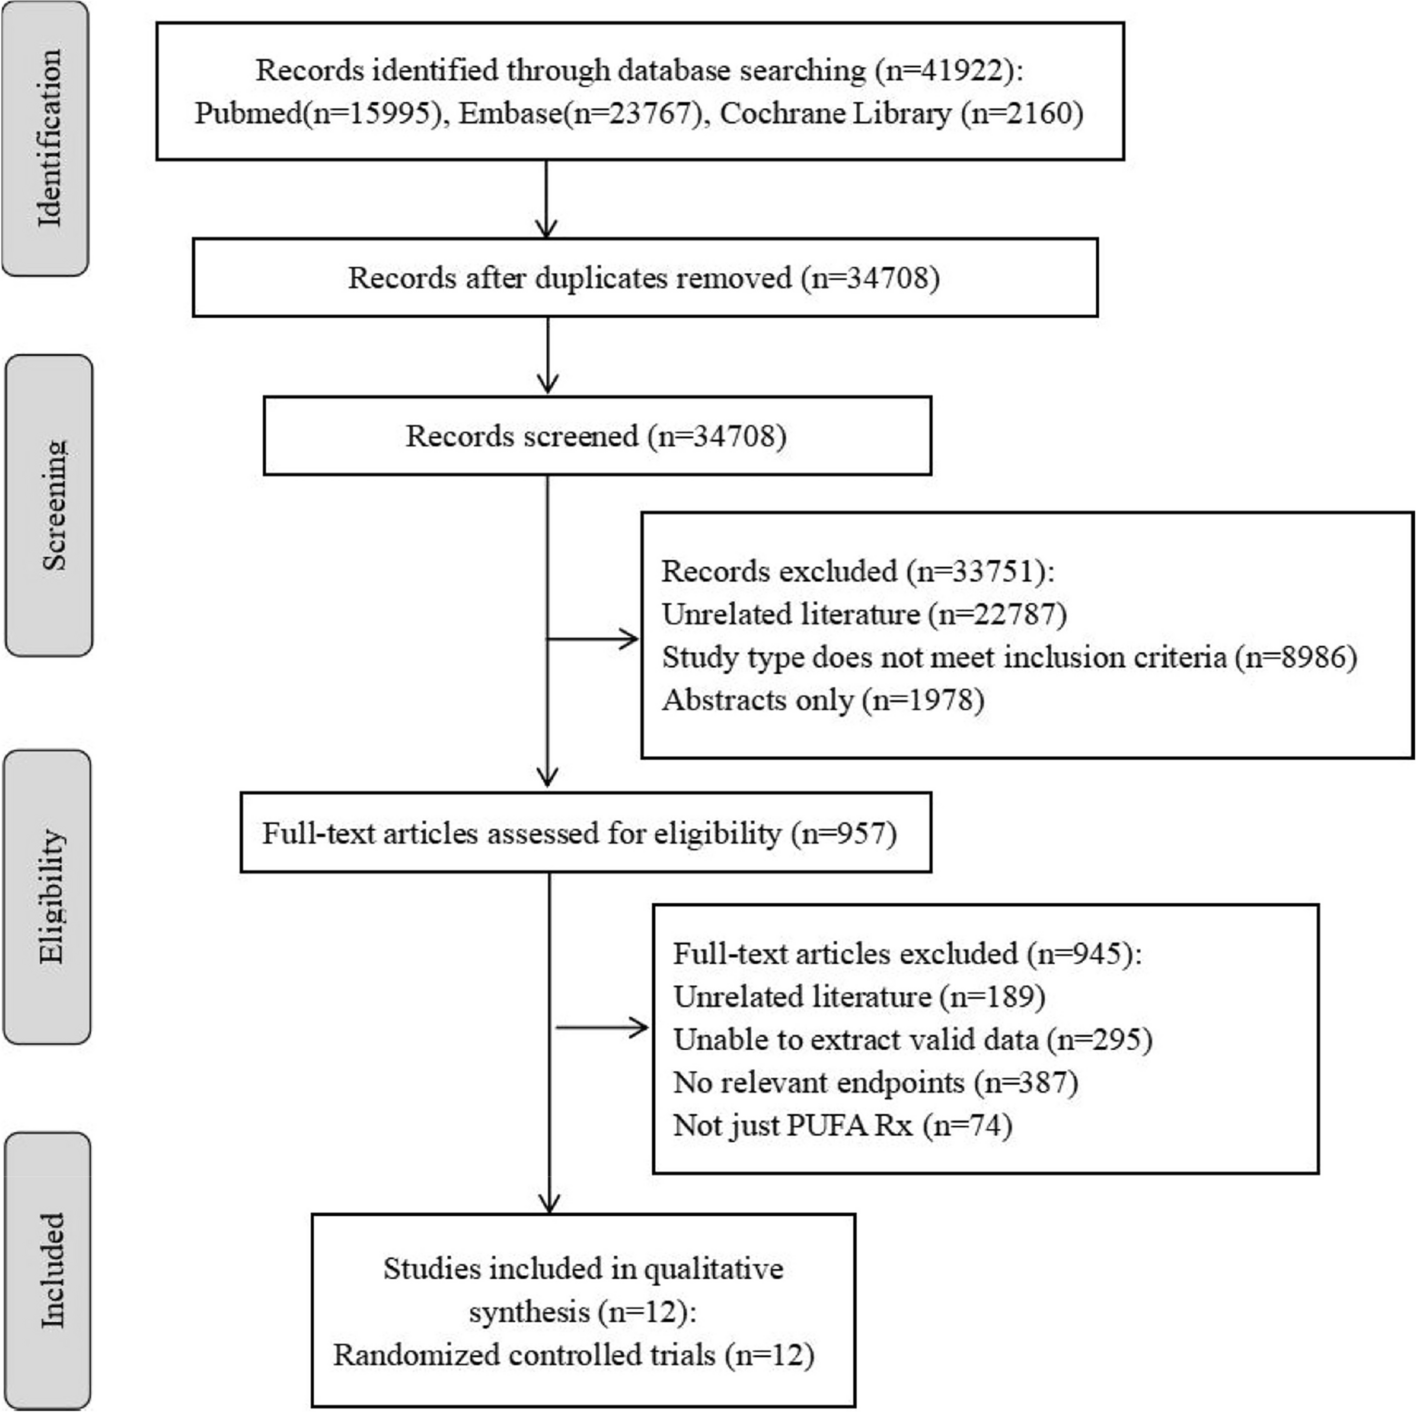
Fig. 1
Consort flow diagram. (BCC = Behavioural change communication; BL = Baseline; EL Endline; HEW = health extension workers; WDA = Women Development Army)
Background of the women’s developmental armyThe Ethiopian government launched the Health Extension Program to reduce maternal and child mortality through community-based primary care led by health extension workers (HEWs). This program includes 16 service packages across hygiene, family health, health education, and disease control. However, rural healthcare coverage remains limited due to challenges like dispersed populations [36]. To improve coverage, Ethiopia introduced the Women Development Army (WDA) in 2011, volunteers from “model households” who assist HEWs by mobilizing communities and promoting health practices [28, 30, 37]. In our study, WDAs delivered BCC to mothers and caregivers in the intervention group, monitoring progress over 12 months.
Interventions descriptionThe modules for the BCC intervention were adapted from the WHO-UNICEF publications “Key Messages Booklet on the Community Infant and Young Child Feeding Counseling Package’’ and “Complementary Feeding Training Handbook by Alive and Thrive in Ethiopia ” [38, 39]. The components of the BCC packages are organized into five sessions. The training material was tested on mothers of children aged 6–23 months who resided in kebeles distant from the intervention areas prior to implementation. The research team and HEWs trained 23 selected WDAs over seven days using posters and demonstrations. Three trained WDAs per cluster delivered BCC messages to the intervention group from January 2021 to December 2022. Methods included face-to-face discussions, flip charts, posters, feeding guidelines, and practical demonstrations. Home visits occurred biweekly for three months, monthly for the next three, and every two months in the final six months. WDAs reinforced key messages and demonstrated food preparation. The control group received routine health education and a one-day BCC session after endline data collection. The trial concluded as scheduled in December 2022.
Key message of behavioural change communicationThe BCC key message was delivered in five sessions, each lasting three days. The first session focused on the overview of malnutrition, the causes and consequences of malnutrition, the advantages of exclusive and continuation breastfeeding, and complementary foods.
The second session focuses on complementary feeding, emphasizing starting at six months. Caregivers should introduce soft foods while continuing breastfeeding. Discussions cover meal frequency, serving sizes (starting with 2–3 tablespoons and increasing to half a 250 ml cup by 9–12 months), and food consistency. Enriching porridge with animal-source foods, vegetables, and fruits is encouraged. Responsive feeding is essential, and sick children need regular meals with extra food if necessary.
The third session discussed about feeding their children during illness. It was emphasized that mothers should continue breastfeeding and increases their child’s feeding during and after the child’s illness. Additionally, mothers were advised to be aware of hygienic practices when handling food and to practice the five critical points of hand-washing techniques.
The fourth session focused on preparing nutritious foods using local cereals and traditional methods like germination, roasting, and soaking. Mothers learned to make cereal-based flour and enrich complementary foods by combining cereals, legumes, and roots. The recommended porridge ratio was three parts roasted cereal (e.g., wheat, barley, oats) to one part legumes (e.g., peas, chickpeas). We encouraged using milk instead of water, adding butter or oil, and including meat, fish, eggs, vegetables, and iodized salt for better nutrition.
The fifth session focuses on practical demonstrations and re-demonstrations of traditional food processing methods for preparing legumes and cereal flour. These methods include germination, roasting, and pounding. Additionally, there will be demonstrations and re-demonstrations on preparing complementary food recipes by mixing variety fruits, vegetables, and animal source foods.
Process evaluationThe process evaluation was carried out to assess whether the intervention was progressing according to schedule. Furthermore, a process evaluation was conducted to ensure the planned delivery of BCC by Women Development Agents during home visits. It was performed to assess the effort of the intervention providers (women developmental army) during discussion and home visits, the rate of engagement of participants with the intervention, and the overall target participants during the BCC session.
Data collection tools and proceduresA baseline and endline assessment were conducted using the same validated and structured questionnaires to assess various characteristics such as socio-demographics, dietary practices, knowledge, food security status, and illness in the intervention and control groups. Questionnaires were adapted from different literature and EDHS [6, 40, 41],
Outcome measuresThe data collectors, ten graduate and trained nurses and two MSc nutritionist supervisors, were recruited and given a three-day intensive training about interviews. The questionnaires were translated into the local language, Oromiffa, and then back to English for better understanding. The socio-demographic status of the participants was assessed from validated different literatures and modified [12, 42].
OCFP was the primary outcome of interest. The primary outcome was generated from a 24 hour’s dietary recall of DDS, MMF, and MAD and the initiation of complementary food. Mothers or caregivers were asked to recall all food items given to their child in the previous 24 hours before the survey day. According to the WHO 2021 guidelines, the score for dietary diversity was calculated by the sum of the responses to the eight food groups: grains, roots, or tubers; legumes and nuts; vitamin A-rich fruit and vegetables; other fruits or vegetables; flesh foods; eggs; dairy products; and breast milk. Each food group was scored as 0 if not consumed during the past 24 h and 1 if consumed in the same period. The possible range of the dietary diversity index was from 0 to 8. A child was to have met the recommended MDD if the child ate five and above out of eight food groups and was categorized as “good diversity” and a score below five as “poor diversity.” MMF was determined based on the frequency of feeding per 24 hours, and it was calculated based on the number of times the children had meals in the previous 24 hours. Breastfed infants aged 6–8 months were fed 2–3 times per day, whereas those aged 9–23 months were fed 3–4 meals per day, with additional nutritious snacks available 1–2 times per day, and 4–5 meals per day for non-breastfed children. A MAD is a combination of minimum dietary diversity and minimum frequency. MAD scores were then grouped into two, with a score of 0–1 categorized as “not met MAD” and a score of 2 considered “met MAD.” OCFP was defined as the mothers who responded correctly to four indicators: timely initiation of complementary food at 6 months, MDD, MMF, and MAD. Mothers who followed these practices were considered as the mother who fed their children with OCFP [6, 9, 43].The secondary outcome was the mother’s knowledge of complementary feeding. The knowledge index was created from twelve questions; each was coded as 1 if a mother’s response was correct or “0’ if the response was incorrect. Then, the correct response was summed up, and the cut-off was decided based on a median score of 4 (± 1.56). Mothers who responded correctly to four or more questions were considered to have good knowledge [11, 41, 44].
The practice of THFP techniques for preparing complementary foods using cereal-based ingredients was assessed, with mothers who used THFP being coded as “1” and those who did not as “0” [26].
The Household Food Insecurity and Access Scale (HFIAS) assessed household food insecurity based on the Food and Nutrition Technical Assistance (FANTA) standards. It comprised nine items, grouped into three Likert scale options, to indicate the seriousness of food insecurity in the past four weeks. Mothers or caregivers answered these questions on behalf of the household, and the total score determined the level of food insecurity: food secure, mild, moderate, or severe [40].
A comorbidity report was included if the child had been exposed to diarrhea, cough, and fever in the past two weeks preceding the survey. If the mother said “yes” at least to one or more of these common morbidities, the child was considered to have the illness.
Data quality controlBefore the actual date of data collection, a pre-test was done on 5% of questionnaires outside the study area. Cronbach’s alpha was used to evaluate the data’s reliability, and the result was a value of 0.74. The data collectors and supervisors met at the end of each day to discuss their performance and modify any issues accordingly. The endline assessment was collected using the same questionnaires and data collectors as the baseline to maintain accuracy. The trial was stopped based on a pre-specified time. Separate data entry clerks matched and validated the records to ensure data quality.
Data management and analysisThe data was entered into Epi Data Manager Version 4.0 and exported to Stata MP Version 17.0 for analyses. Descriptive statistics was performed, and the results were presented using proportions, figures, and tables. A chi-square (X2) test was employed for categorical variables to determine the association between socio-demographic variables and the outcome variables in both intervention and control groups at baseline and endline measurements in separate. The difference-in-differences (DID) model was used to determine the effect of the intervention on child feeding practice, knowledge, and food processing method over time, comparing the intervention and control groups. In the Generalized Estimating Equation (GEE), a binomial family with a logit link function and an independent working correlation structure were considered to examine the BCC effect on OCFP between intervention and control groups over time and to identify predictors of OCFP. Those variables with a p-value < 0.25 in the GEE univariable model were selected for multivariable GEE. The intervention’s effect was assessed through the interaction term “intervention*time.” The GEE model also explores the relationship between OCFP and explanatory variables.
Comments (0)