
Remember me


NAPACA patients were significantly older than the other two groups (NAPACA: 40.6 ± 1.1, PCOS: 31.3 ± 1.4, NAPACA+PCOS: 33.8 ± 1.4 years old, P < 0.001). PCOS patients displayed the lowest and NAPACA+PCOS the highest BMI (PCOS: 27.1 ± 1.7, NAPACA: 28.2 ± 1.1, NAPACA+PCOS: 31.8 ± 1.9 kg/m2), but without a statistically significant difference (P = 0.06) and patients of the three groups did not significantly differ in their WHR (NAPACA: 0.533 ± 0.02, PCOS: 0.513 ± 0.02, NAPACA+PCOS: 0.583 ± 0.03, P = 0.15). 39% of NAPACA patients had a positive family history of diabetes mellitus type 2, while the percentage increased to 75% for PCOS and to 63% for NAPACA+PCOS patients (P = 0.07). Their SBP (NAPACA: 127.9 ± 3.1, PCOS: 128.8 ± 3.0, NAPACA+PCOS: 130 ± 2.6 mmHg, P = 0.53) and DBP levels (NAPACA: 81.8 ± 1.8, PCOS: 87.1 ± 3.4, NAPACA+PCOS: 86.5 ± 2.5 mmHg, P = 0.19) were comparable in all three groups. Furthermore, all patients had similar HbA1c (NAPACA: 5.335 ± 0.08, PCOS: 5.270 ± 0.05, NAPACA+PCOS: 5.314 ± 0.05%, P = 0.64) and fasting glucose levels (NAPACA: 90.3 ± 1.9, PCOS: 95.1 ± 3.8, NAPACA+PCOS: 89.35 ± 1.8 mg/dl, P = 0.41). However, NAPACA+PCOS patients displayed significantly higher fasting insulin levels (NAPACA: 9.3 ± 1.0, PCOS: 12.9 ± 2.8, NAPACA+PCOS: 25.5 ± 9.1 μU/ml, P = 0.02). NAPACA+PCOS patients also exhibited lower HDL levels (NAPACA: 58.6 ± 2.6, PCOS: 57.3 ± 2.9, NAPACA+PCOS: 48.1 ± 2.5 mg/dl, P = 0.02), while their TC (NAPACA: 187.1 ± 4.4, PCOS: 187.7 ± 7.4, NAPACA+PCOS: 191.0 ± 5 mg/dl, P = 0.87), LDL (NAPACA: 110.9 ± 4.7, PCOS: 112.7 ± 6.8, NAPACA+PCOS: 119.3 ± 4.3, P = 0.54) and TG levels (NAPACA: 101.0 ± 8.7, PCOS: 102.9 ± 15.3, NAPACA+PCOS: 124.7 ± 13.4 mg/dl, P = 0.26) did not differ from the other two groups. NAPACA and NAPACA+PCOS patients did not differ in the size of their adrenal incidentaloma (NAPACA: 22.9 ± 2.2, NAPACA+PCOS: 20.0 ± 2.5, P = 0.39), (Table 1).
Table 1 Baseline parameters of patients with NAPACA, PCOS and NAPACA+PCOSHormonal profileWhen comparing the hormonal profile among the groups, no significant differences were identified in their cortisol levels based on the 1mg-DST (NAPACA: 1.574 ± 0.18, PCOS: 0.829 ± 0.12, NAPACA+PCOS: 1.109 ± 0.19 μg/dl, P = 0.06). The DHEA-S (NAPACA: 136.3 ± 26, PCOS: 251.3 ± 42, NAPACA+PCOS: 244 ± 37 μg/dl, P = 0.007), Δ4-androstenedione (NAPACA: 1.423 ± 0.23, PCOS: 2.684 ± 0.23, NAPACA+PCOS: 2.366 ± 0.35 ng/ml, P < 0.001) and testosterone levels (NAPACA: 28.63 ± 2.6, PCOS: 42.81 ± 4.3, NAPACA+PCOS: 44.93 ± 5.2 ng/dl, P = 0.001) were significantly higher in the two groups with PCOS patients. Interestingly, the FAI levels were significantly higher in the NAPACA+PCOS group in comparison to NAPACA (NAPACA: 2.93 ± 0.6, PCOS: 4.18 ± 1.0, NAPACA+PCOS: 5.90 ± 1.2, P = 0.015), (Table 1).
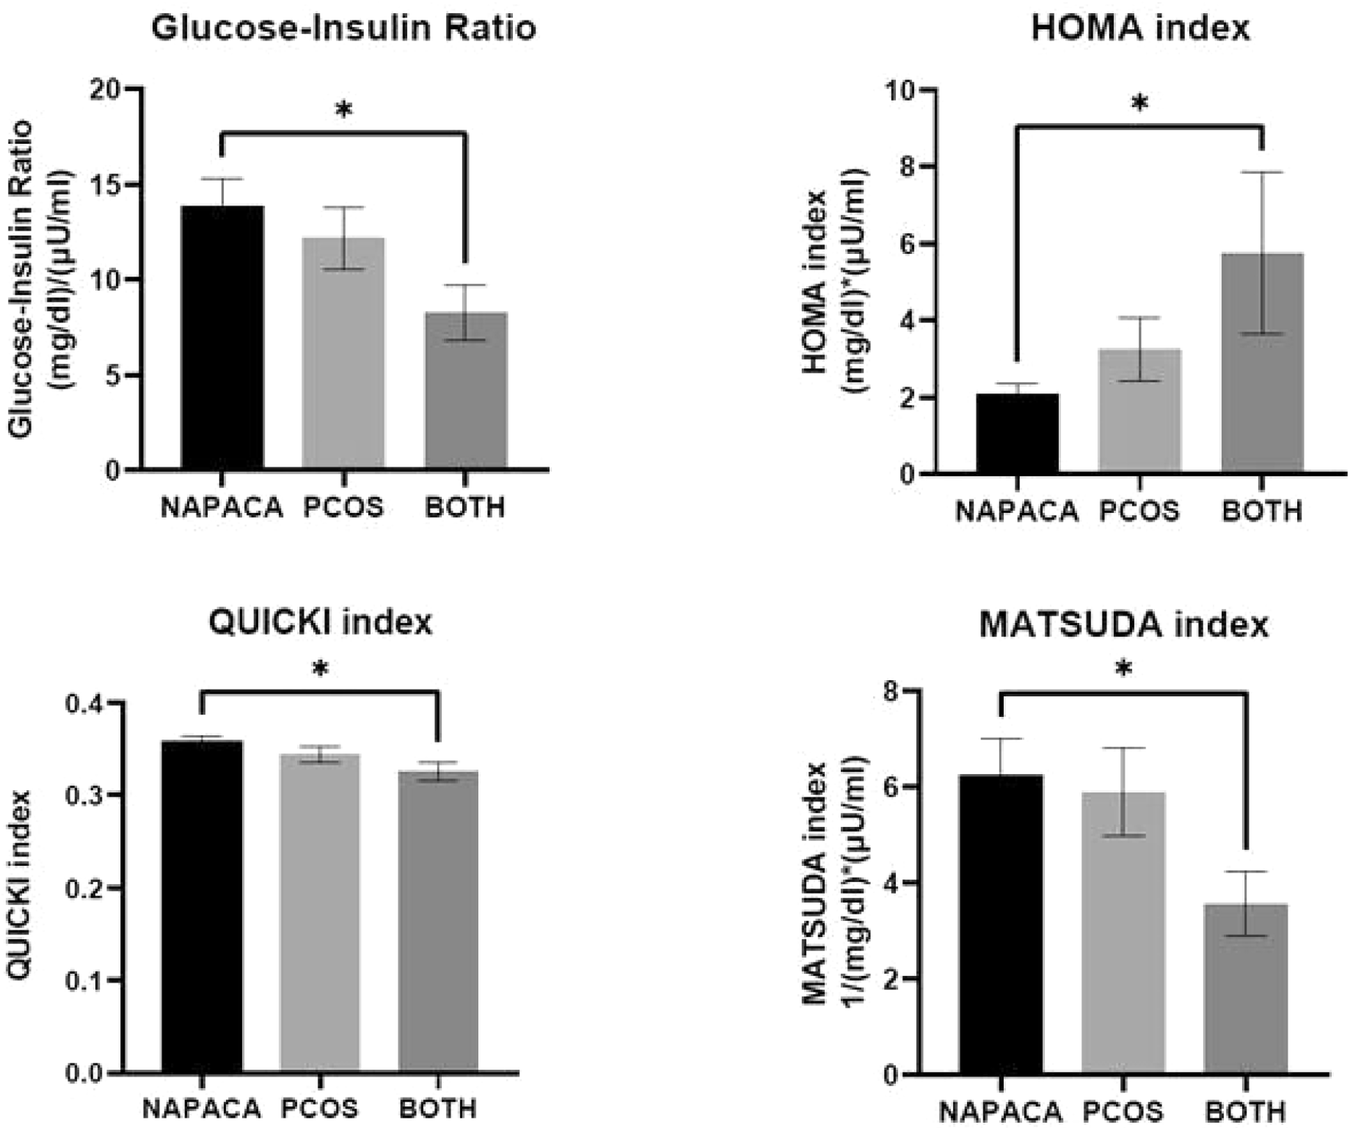
Insulin resistance indicesWe additionally compared both static and dynamic IRI in the three groups. NAPACA+PCOS patients displayed significantly increased IR as calculated by the GIR (NAPACA: 13.9 ± 1.4, PCOS: 12.2 ± 1.6, NAPACA+PCOS: 8.3 ± 1.5, P = 0.017), the HOMA index (NAPACA: 2.08 ± 0.26, PCOS: 3.23 ± 0.81, NAPACA+PCOS: 5.75 ± 2.09, P = 0 = 035), the QUICKI index (NAPACA: 0.358 ± 0.006, PCOS: 0.344 ± 0.009, NAPACA+PCOS: 0.326 ± 0.009, P = 0.018) and the MATSUDA index (NAPACA: 6.41 ± 0.8, PCOS: 5.75 ± 0.9, NAPACA+PCOS: 3.57 ± 0.7, P = 0.031) (Fig. 1).
Fig. 1
Insulin resistance indices in NAPACA, PCOS and NAPACA+PCOS patients. Upper left panel: Glucose to Insulin Ratio (GIR). Upper right panel: Homeostatic model assessment for insulin resistance (HOMA) index. Lower left panel: Quantitative insulin sensitivity check (QUICKI) index. Lower right panel: MATSUDA index. * denotes statistical significance
Correlation of androgens and cortisol to clinical, cardiometabolic parameters and insulin resistance indicesFAI levels positively correlated with insulin levels and the degree of IR in NAPACA (Insulin R 0.54, 95% CI 0.16–0.78, P = 0.007, GIR R −0.56, 95% CI −0.79 – −0.19, P = 0.005, HOMA R 0.53, 95% CI 0.14–0.77, P = 0.008, QUICKI R −0.53, 95% CI −0.77 – −0.14, P < 0.05, MATSUDA R −0.49, 95% CI −0.83 – 0.10, P = 0.091) and PCOS patients (Insulin R 0.71, 95%CI 0.34 – 0.89, P = 0.002, GIR R −0.69, 95%CI −0.88 – −0.30, P = 0.003, HOMA R 0.70, 95%CI 0.31–0.89, P = 0.002, QUICKI R −0.7, 95% CI −0.89 – −0.31, P = 0.002, MATSUDA R −0.82, 95%CI −0.94 – −0.55, P = 0.001), (Table 2). Unlike that, cortisol levels after 1mg-DST positively correlated with the degree of IR in the NAPACA+PCOS group (Insulin R 0.51, 95%CI 0.03 – 0.80, P = 0.03, GIR R −0.48, 95%CI −0.79 – 0.02, P = 0.05, HOMA R 0.58, 95%CI 0.12 – 0.83, P = 0.017, QUICKI R −0.58, 95%CI −0.83 – −0.12, P = 0.017, MATSUDA R −0.67, 95%CI −0.90 – −0.14, P = 0.02) (Table 3). Interestingly, in NAPACA+PCOS patients DHEA-S levels negatively correlated with the BMI (R −0.65, 95%CI −0.85 – −0.28, P = 0.002), WHR (R −0.72, 95%CI −0.91 – −0.29, P = 0.005), HbA1c levels (R −0.56, 95%CI −0.82 – −0.09, P = 0.022) and positively with the HDL levels (R 0.65, 95%CI 0.23 – 0.87, P = 0.006), (Table 4). Δ4-androstenedione levels did not present any particular correlation with the cardiometabolic parameters investigated (data not shown).
Table 2 Correlation of free androgen index (FAI) to the investigated parametersTable 3 Correlation of cortisol after 1 mg dexamethasone suppression test to the investigated parametersTable 4 Correlation of DHEA-S to the investigated parametersA logistic regression analysis was performed to provide the clinical and/or cardiometabolic predictors in the NAPACA and NAPACA+PCOS groups. In the univariate analysis, age (OR: 0.887; 95%CI: 0.823–0.995, P = 0.002), the MATSUDA index (OR: 0.728; 95%CI: 0.555–0.954, P = 0.02) and HDL levels (OR: 0.944; 95%CI: 0.900–0.991, P = 0.02) predicted the presence of PCOS in NAPACA patients, while, in the multivariate analysis, only the younger age and the lower HDL levels predicted the PCOS presence (age: OR: 0.767; 95%CI: 0.620–0.949, P = 0.014; HDL: OR: 0.911, 95%CI: 0.833–0.997, P = 0.04) (Table 5).
Table 5 OR and 95% CI for each metabolic parameter to distinguish NAPACA from NAPACA+PCOSAs our cohort included patients with MACS, 12 in the NAPACA group (27%), and one in the NAPACA+PCOS group (5%), we further performed a nested analysis, excluding all MACS patients and reassessing the IRI in all groups. NAPACA+PCOS patients still displayed significantly increased IR as calculated by the GIR (NAPACA: 13.5 ± 1.4, PCOS: 12.6 ± 1.7, NAPACA+PCOS: 8.5 ± 1.5, P = 0.025), the HOMA index (NAPACA: 1.9 ± 0.25, PCOS: 3.17 ± 0.85, NAPACA+PCOS: 5.70 ± 2.2, P = 0.05), the QUICKI index (NAPACA: 0.358 ± 0.006, PCOS: 0.346 ± 0.009, NAPACA+PCOS: 0.327 ± 0.01, P = 0.03) and the MATSUDA index (NAPACA: 6.67 ± 0.8, PCOS: 5.9 ± 0.9, NAPACA+PCOS: 3.7 ± 0.7, P = 0.03). HDL levels remained lowest in the NAPACA+PCOS group (NAPACA: 61.1 ± 3.1, PCOS: 57.3 ± 2.9, NAPACA+PCOS: 48.5 ± 2.6, P = 0.02). Similarly, uni- and multivariate analysis of these nested groups also denoted age and HDL as the major predictors of the presence of PCOS in NAPACA patients [univariate analysis: age (OR: 0.916; 95%CI: 0.848–0.991, P = 0.028), the MATSUDA index (OR: 0.702; 95%CI: 0.495–0.995, P = 0.047) and HDL levels (OR: 0.943; 95% CI 0.892–0.996, P = 0.037); multivariate analysis: age (OR: 0.721; 95%CI 0.535–0.972, P = 0.032) and HDL (OR: 0.887; 95%CI 0.776–1.014, P = 0.079)].
Comments (0)