Study design
This single-centre retrospective study was conducted as part of the university hospital’s quality improvement project SmartDiabetesCare (QiP SDC) at the University Hospital Essen on five non-ICU wards (department of dermatology, neurology, trauma surgery and infectiology). In brief, a structured digital electronic patient file with a focus on dysglycemia specific information was implemented at these five stations. Diagnosis of dysglycemia was visualized to the in-hospital physician by algorithm-based flagging of the patients on the electronic ward overview. Besides, application of continuous glucose monitoring and cloud-based dysglycemia management, the diabetes-team provided dysglycemia specific information to the in-hospital physician in a glance summary (SDC sheet), which could be copied and pasted in total or partially into the discharge letter. A” Push notification” was set into the patient’s electronic health record (EHR) whenever the diabetes-team updated treatment recommendations and the QiP SDC sheet could be checked within the EHR.
Documentation of glycemic status and regarding treatment recommendations in discharge summaries of the patients were retrospectively correlated between patients supplied with QiP SDC and a usual diabetes care (UDC). Information in UDC were obtained from discharge letters of patient hospitalized in the departments of dermatology, neurology and trauma surgery from 01/SEP/2019 until 31/AUG/2020 and the department of infectiology from 01/NOV/2020 until 08/MAR/2021. Patients who passed away during the hospitalization were excluded from the analysis.
To quantify quality of dysglycemia specific information in the discharge letter, a performance score was introduced to evaluate presence as well as correctness of transferred dysglycemia specific content (Table 1). The following situations were distinguished: i) Mentioning of any dysglycemia related diagnosis (for example diabetes mellitus) resp. any dysglycemia related treatment (for example metformin) received 1 point each. ii) Correct and complete mentioning of diagnosis (for example type 2 diabetes mellitus, actual HbA1c 6.6%) resp. treatment recommendation (for example metformin 1000 mg 1-0-1) received an additional point each resulting in a minimum of 0 and a maximum of 4 points. A score of 0 points was interpreted as “very poor”, 1 as “poor”, 2 as “moderate”, 3 as “good” and 4 as “very good” quality of documentation.
Table 1 Transition performance scoreScore values were compared between discharge letters of patients during QiP SDC and those of patients receiving UDC.
Description of patientsPatient cohort
All patients admitted to wards participating in QiP SDC for dermatological, neurological, trauma surgery or infectious diseases within the observation period were included into the study. Indication for in-hospital care was made by the respective departments of dermatology, neurology, trauma surgery, infectious diseases and emergency medicine.
Statistical analysis
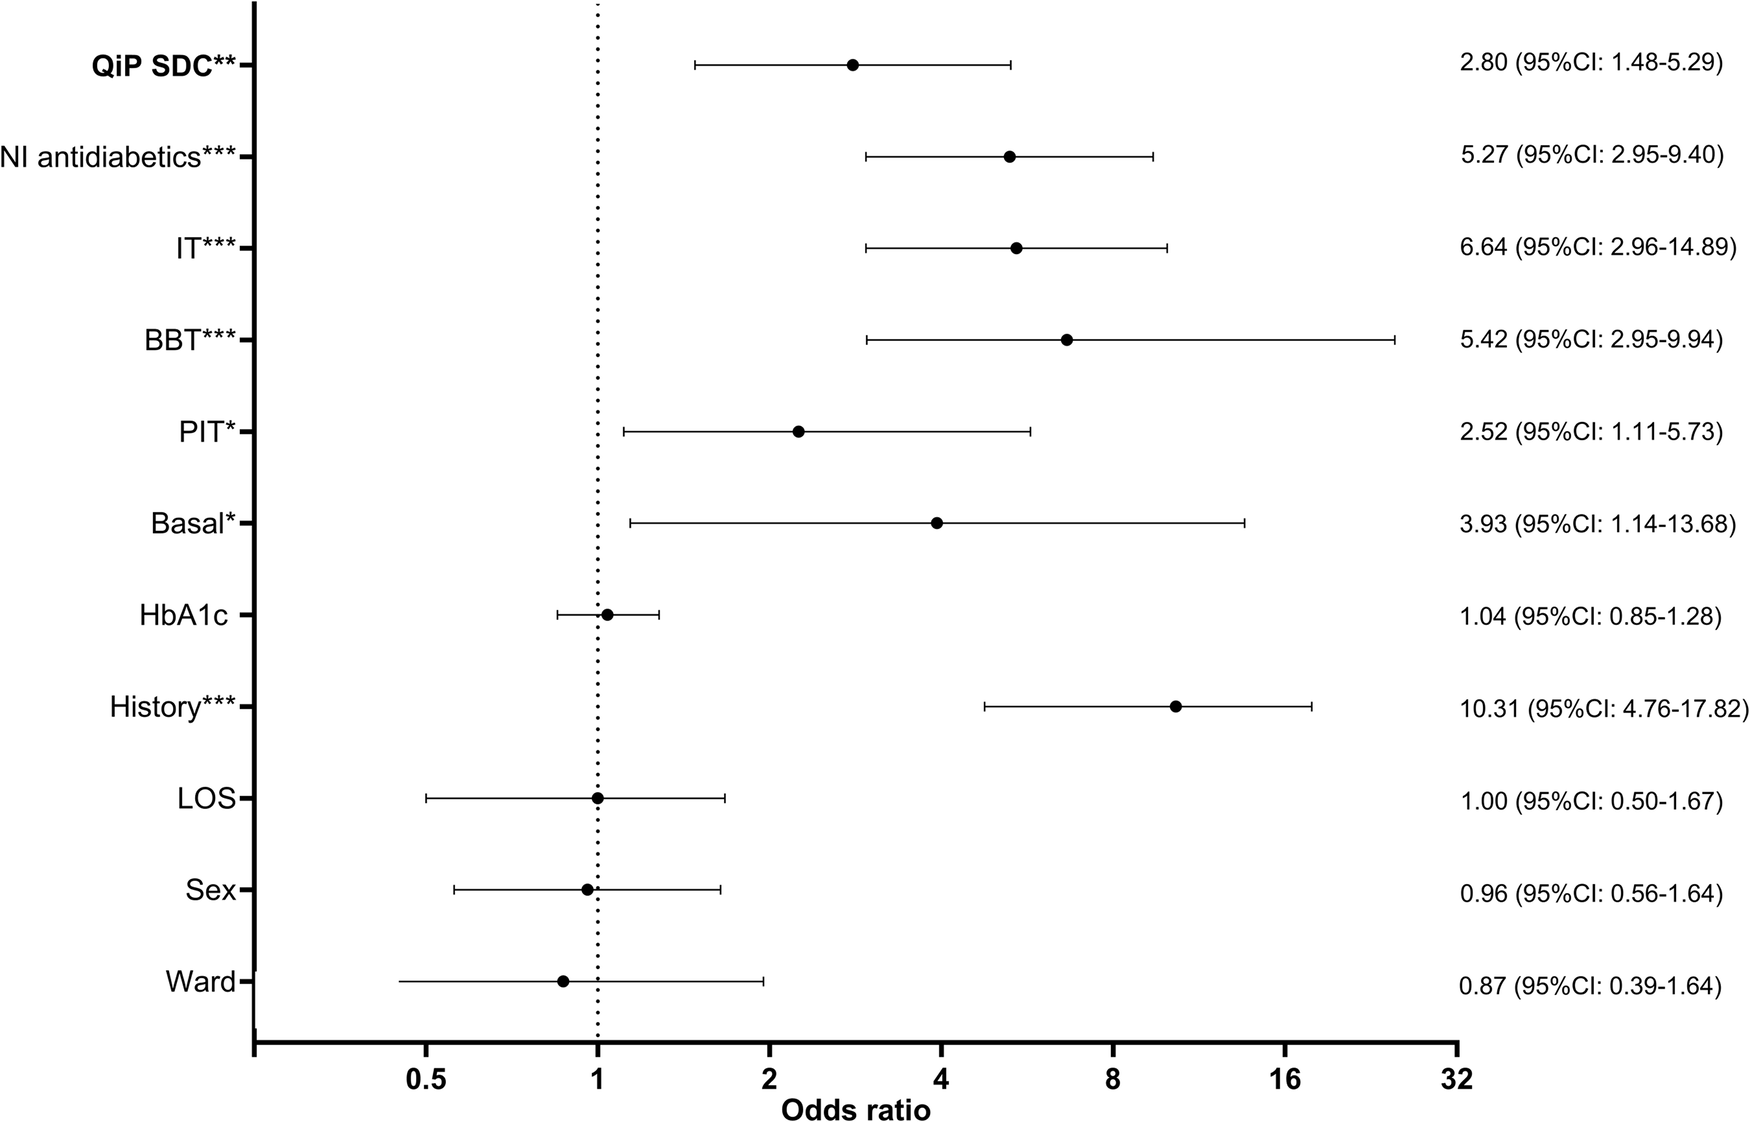
Data were analyzed using GraphPad Prism (GraphPad Software Inc., San Diego, CA, USA) and SPSS 27.0 (IBM Corporation, Armonk, NY, USA) software. Results are shown as mean ± standard deviation and range or absolute number and percentage affected. A value of p < 0.05 was considered statistically significant. Documentation of diagnosis of D and PreD and treatment recommendations in discharge summaries were compared using multinominal logistic regression analysis to calculate OR and 95%CI using documented diagnosis respectively diabetes- and prediabetes-specific treatment recommendation vs. no documentation in discharge summaries as dependent variables and QiP SDC vs. UDC as independent variables. The analysis was performed un-adjusted and adjusted for sex, history of dysglycemia, non-insulin antidiabetic treatment, insulin use, intensity of insulin therapy, ward, Hba1c, type of dysglycemia (D vs PreD) and length of stay (LoS). Linearity was tested assessed using the Box-Tidwell procedure [12]. Bonferroni-correction was applied to all ten terms in the model [13]. All variables were found to follow a linear relationship. Correlations between predictor variables were low (r < 0.70), indicating that multicolinearity was not a confounding factor in the analysis. Analysis was performed 1) in the total cohort and 2) in the subcohort of patients with newly detected dysglycemia.
To analyze group differences in performance, univariate ANOVA was computed followed by Bonferroni-corrected posthoc tests. Analyses were performed without adjustment as well as adjusted for sex, history of dysglycemia, non-insulin antidiabetic treatment, insulin use, intensity of insulin therapy, ward, Hba1c, type of dysglycemia (D vs PreD) and LoS (as analysis of covariance, ANCOVA, with Hba1c and LoS as covariate and sex, history of dysglycemia, non-insulin antidiabetic treatment, insulin use, intensity of insulin therapy, ward and type of dysglycemia (D vs PreD) as between-subject factors). Proportions of performance score categories were compared in QiP SDC and UDC using the “N-1” Chi-squared test as recommended by Campbell [14] and Richardson [15].


Comments (0)