
Remember me
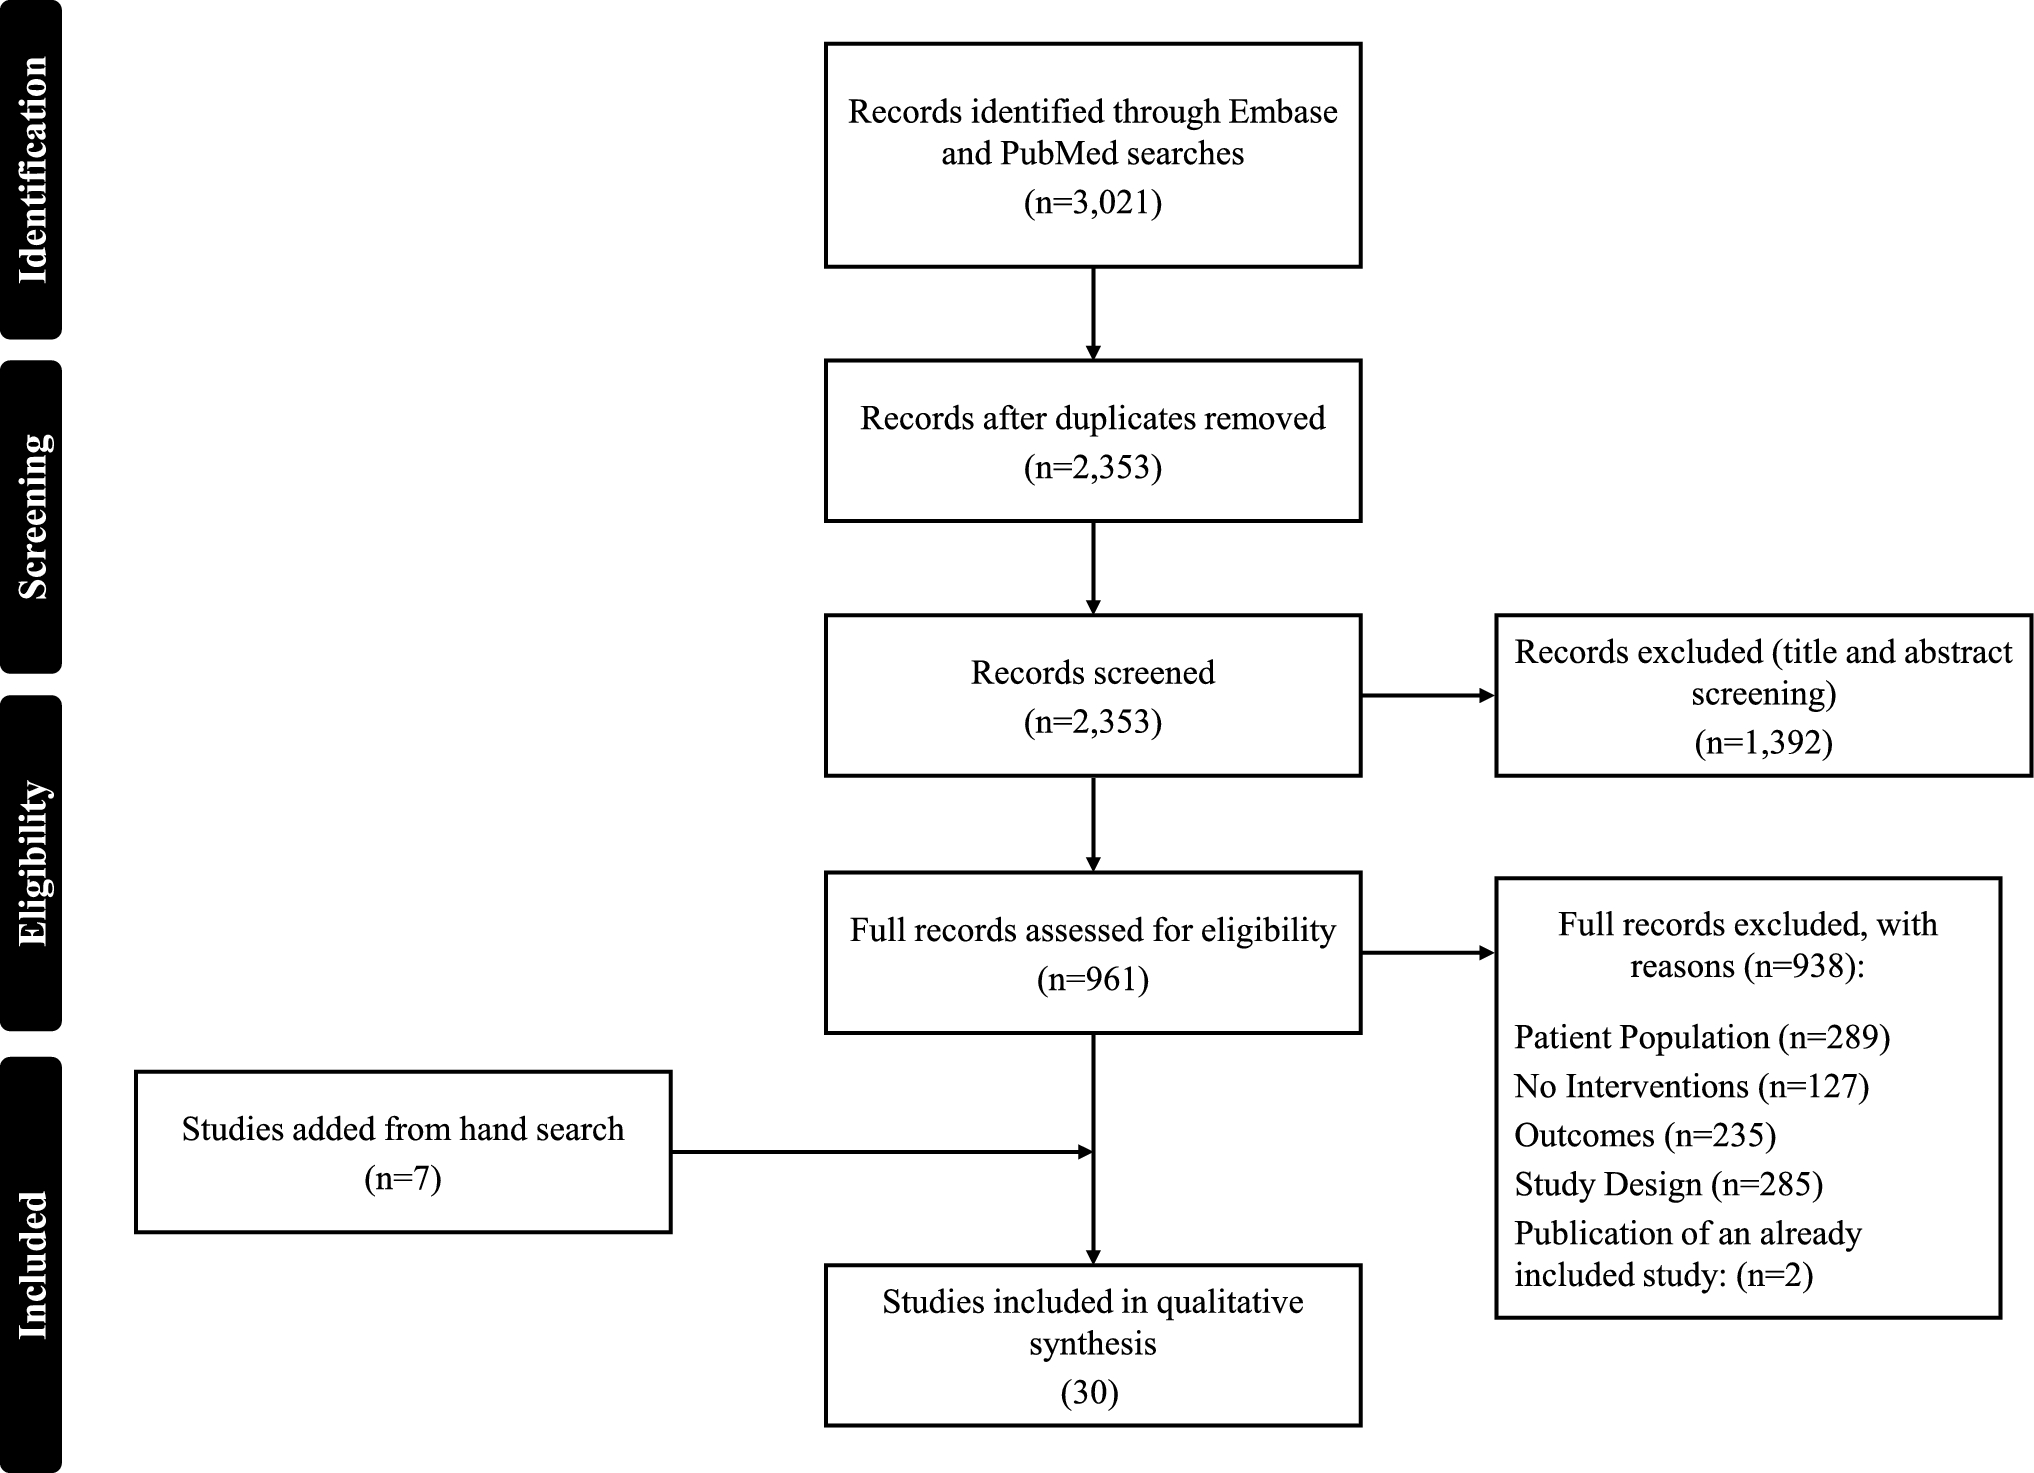
A total of 30 records were included in this review after screening (Fig. 1) [22,23,24,25,26,27,28,29,30,31,32,33,34,35,36,37,38,39,40,41,42,43,44,45,46,47,48,49,50,51]. The records detailed 11 retrospective or prospective studies (Table 1), 11 cost-effectiveness evaluations (Table 2), and eight other models including budget impact and other cost-modeling studies (Table 3).
Fig. 1 Table 1 Summary of retrospective and prospective studies evaluating costs and/or healthcare resource utilizationTable 2 Summary of R/R FL cost-effectiveness modelsTable 3 Summary of budget impact and other R/R FL models and analyses3.1 Cost and HCRU Burden of R/R FL
There were eight studies identified that reported the cost and/or HCRU of R/R FL agnostic of specific treatment regimens (Table 1) [23, 29, 30, 35, 36, 41, 46, 49]. Six of the studies were conducted in the USA [23, 30, 36, 41, 46, 49], one in Italy [29], and one in Canada [35].
The study in Canada retrospectively evaluated the annual cost of 285 patients with FL relapsing after R-based chemotherapy [35]. In the first year after relapse, costs (2019 CAD) were 52,474 CAD, followed by 17,039 CAD in year 2, and 13,637 CAD in year 3. The retrospective analysis of patients with R/R FL initiating 3L treatment in Italy reported a similar trend for years 1 and 2 post-therapy initiation, with a decrease in mean total healthcare costs of €21,081 to €10,249 [29]. However, costs increased to €22,230 in the third year after initiation of 3L therapy. The study reported similar reductions between year 1 and year 2 mean healthcare costs, and then an increase in year 3 costs for patients ultimately receiving three, four, or five or more lines of therapy.
There were six studies using data from the USA to estimate the costs and/or HCRU associated with different lines of therapy for R/R FL patients [23, 24, 30, 36, 46, 49].
All-cause healthcare costs (USD) per-patient-per-month (PPPM) for patients receiving second-line regimens were reported in three studies and ranged from US$10,466 (adjusted from an annual cost of US$125,586) to US$17,767 [23, 30, 46]. The high estimate of US$17,767 was among a cohort of patients with FL aged 66 years or older at diagnosis and went on to initiate a 3L therapy [23]. Among the four studies evaluating total all-cause healthcare costs in 3L, the range was US$12,872 to US$19,935 PPPM (adjusted from an annual cost of US$239,216) [24, 30, 46]. There were two studies evaluating costs in fourth-line (4L) [30] and later [24, 36]. Fourth-line all-cause costs PPPM were US$30,883 (adjusted from an annual cost (2019 USD) of US$370,597) and US$28,420 for 4L and later. The 4L and later costs were captured for patients with early treatment failure of first-line chemoimmunotherapy [36]. Total costs (2019 USD) for the fifth line (5L) were reported in one study and were US$35,397 PPPM (adjusted from an annual cost of US$424,758) [30].
Among the three studies evaluating more than one line of therapy, the increase from line to line was modest in two studies and impactful in one study [23, 30, 46]. Bains Chawla et al. and Saunders et al. both reported total all-cause healthcare costs PPPM for 2L and 3L patients with FL using claims-based databases. In the Bains Chawla et al. study, the increase in all-cause healthcare costs PPPM from 2L to 3L was 2.8% (US$499) compared with 7.5% (US$900 [2022 USD]) in the Saunders et al. study. The Bains Chawla et al. study evaluated patients aged 66 years and older who initiated a 3L treatment regimen while the Saunders et al. study included patients with progression of disease ≤ 24 months (POD24). The Fowler et al. study reported much larger relative differences in all-cause healthcare costs (2018) between lines with increases of 90.5% (US$9469) from 2L to 3L, 54.9% (US$10,948) from 3L to 4L, and 14.6% (US$4513) from 4L to 5L [30].
Patients with R/R FL incurred frequent hospitalizations and emergency department visits across all treatment lines in the included studies [23, 30, 36, 41, 49]. In the study by Bains Chawla et al. of patients with R/R FL 66 years and older at diagnosis, 19% and 31% of patients had a hospitalization in the 2L and 3L settings, respectively [23]. Emergency department visits were 28% in 2L and 41% in 3L. Similar rates were reported by Fowler et al. as the percentage of patients with a hospitalization annually was 31.1% in the 2L, 37.3% in the 3L, 52.4% in the 4L, and 50.0% in the 5L. The mean length of stay ranged from 2.1 days in the 2L to 3.7 days in the 4L [30]. The mean annual number of hospitalizations was similar in 2L and 3L (0.5 hospitalizations), higher in 4L (0.7 hospitalizations), and lowest in 5L (0.2 hospitalizations). In the study of 3L patients with R/R FL by Matasar et al. the mean annual number of hospitalizations was 0.8 with a mean annual number of days in the hospital of 5.2 [41]. Lastly, the claims analysis by Shah et al. reported an increase in mean all-cause and FL-related hospitalizations PPPM from 2L to 3L, and a relative leveling off between 3L and 4L [49].
3.2 Cost and Healthcare Resource Utilization Associated with R/R FL TreatmentsThere were four studies evaluating the economic and/or HCRU outcomes of specific treatment regimens in real-world databases or clinical trials [24, 26, 31, 41]. Matasar et al. reported costs (2020 USD) associated with oral phosphoinositide 3-kinase inhibitors (PI3Kis), anti-CD20 monoclonal antibodies (MoAbs) monotherapy, and chemoimmunotherapy in a US claims database among patients with R/R FL with two or more prior treatment lines [41]. In the 3L and later setting, mean total all-cause/FL-related costs per year were highest for chemoimmunotherapy (US$252,654/US$214,631) and lowest for anti-CD20 MoAb monotherapy (US$121,561/US$105,061).
The remaining three studies evaluating economic and/or HCRU included CAR-T [24, 26, 31]. Chan et al. and Di et al. both conducted retrospective analyses of non-product-specific CAR-T in claims databases in the USA [24, 26]. The Chan et al. study included 305 R/R FL patients in Medicare and commercial claims receiving a CAR-T and 4367 patients receiving the standard of care in the 3L setting [24]. Medicare and commercial costs (USD) PPPM after (not including) CAR-T in the 3L and later setting were US$7513 and US$5169, respectively. In the 3L setting, Medicare and commercial costs (USD) PPPM for patients receiving standard of care were US$8860 and US$6297. Di et al. reported total costs (2018 USD) of US$743,100 during the period of time 41 days before and 154 days after CAR-T administration, among six patients receiving CAR-T for R/R FL in the BCBS axis database [26].
Lastly, the ELARA trial of tisa-cel in patients with R/R FL after two or more lines of treatment was analyzed to determine differences in per-patient hospitalization costs (2020 USD) according to the administration site of tisa-cel [31]. There were 17 patients receiving tisa-cel in the outpatient setting with a hospitalization rate of 59% and a per-patient hospitalization cost of US$7477. The overall hospitalization cost among the 80 patients receiving inpatient administration of tisa-cel was US$40,054.
A cost-minimization model was developed to evaluate the total cost (2022 USD) per patient for axi-cel and tisa-cel in R/R FL after two or more lines of treatment in the USA [33]. The total cost per patient was US$61,136 lower for tisa-cel (US$450,885) compared with axi-cel (US$512,021). This difference was primarily driven by a 6% (US$24,890) increase in drug acquisition cost for axi-cel (US$424,000) compared with tisa-cel (US$399,110) and a 55% (US$13,831) higher cost associated with the management of adverse events (AEs) for axi-cel (US$25,109) compared with tisa-cel (US$11,278).
3.2.1 Burden of Adverse EventsThree studies modeled the costs related to AEs events in the USA using clinical trial data [32, 34, 47]. In two studies, a matching-adjusted indirect comparison (MAIC) was performed using clinical trial data to estimate AE rates between comparators [32, 34]. The MAIC conducted by Gaballa et al. evaluated AE-related costs per episode and per month for tazemetostat, and were compared to idelalisib, duvelisib, and copanlisib [32]. In all cases, AE-related costs (USD) per episode and month were lower for tazemetostat, with differences greatest in comparison with copanlisib (US$18,737 difference per episode and US$3820 per month). In the MAIC conducted by Jeyakumar et al., the annual per-patient cost of AEs among PI3Kis was lowest for umbralisib (US$2123) followed by idelalisib (US$4880), copanlisib (US$5139), and duvelisib (US$5818).
A decision-analytic model was developed to estimate the cost (2023 USD) of cytokine release syndrome (CRS), neurological events (NE), and AEs using data from the TRANSCEND-FL (liso-cel) study in R/R FL [
Comments (0)