
Remember me


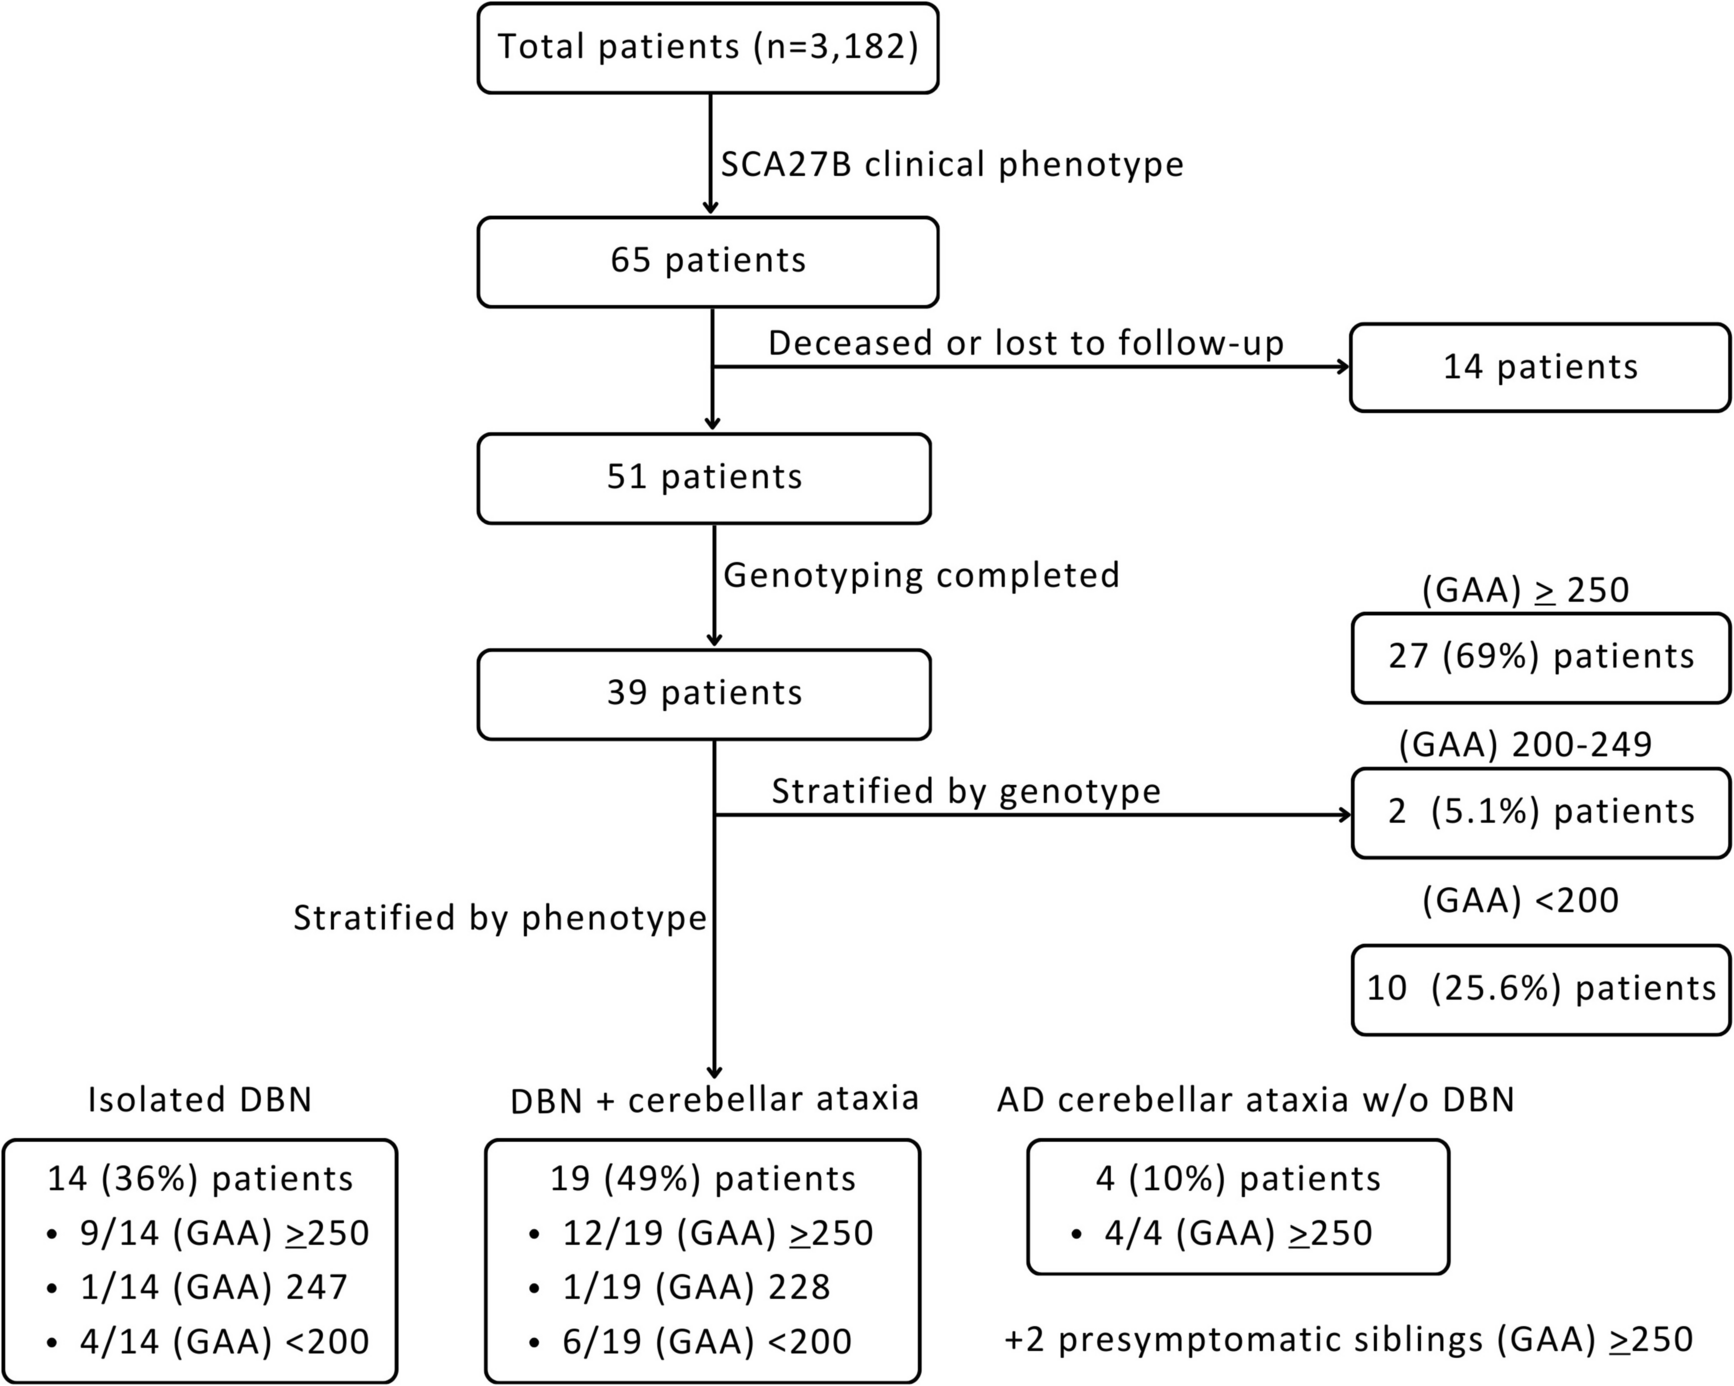
The trial flowchart in Fig. 1 summarises the conversion and attrition data for the study. Thirty four people with probable MSA-C were approached over a 10 month period from April 2023 to February 2024 through three NHS sites and the MSA charity. Twenty five of these consented to participate and were randomised to the two intervention arms − 12 to ClearSpeechTogether and 13 to ST. This translates to a conversion rate of 74%, thus narrowly missing the target of 75%. Those who declined to participate and provided a reason generally indicated that were worried about not being able to participate in the intensive ClearSpeechTogether arm of the study. The recruitment period exceeded the planned 6 months due to staffing issues and the need to add additional patient identification sites to the project. Post-treatment data are available for 20 participants and 2 months follow up data for 19. Attrition occurred at various stages, due to death, illness, loss of interest and change in diagnosis from MSA-C to other conditions subsequent to recruitment. One participant in the latter category completed all stages of the trial and will be discussed separately below. The total attrition at follow up was 24%, which is within the target of less than 25%.
Fig. 1
Trial flowchart. Abbreviations: CST: ClearSpeechTogether, ST: standard SLT
Table 1 provides demographics for the participants that were included in the study. The two groups were well matched in terms of baseline ataxia severity (SARA score, p = .806) as well as severity of their speech difficulties (SARA speech score, p = .233). Tables S1a&b in the supplemental materials provide further information on individual participants’ speech features, symptom onset and previous speech therapy input. All participants presented with dysarthria features in line with previous reports on MSA-C and most reported onset of speech difficulties early on in their disease process [5, 6]. Ataxic dysarthria symptoms such as irregular speech rhythm and articulatory breakdown prevailed, but some signs of hypokinetic dysarthria (fast rate, short rushes of speech, hypophonia (e.g. P1 & 3)) and spasticity (strained voice quality, stridor (e.g. P2)) were also evident across the samples.
Table 1 Participant demographicsFeasibilityAs stated above, conversion and attrition were at or close to target. However, we had only recruited 16/24 participants at the end of the 6-month recruitment period. At the time, we had exhausted the existing caseload of MSA-C patients registered with the Sheffield Ataxia Centre and depended on incoming newly diagnosed patients as well as adding other sites to the recruitment pool, extending the recruitment period to 10 months in total.
In relation to data quality, we experienced no data loss or quality issues. However, collecting speech recordings online was difficult for some participants and added additional stress. In future trials it would be preferable to have in person assessments for speech recordings.
Digital exclusion was not a concern in the current cohort, all participants were able to join the online sessions, less than 10% required provision of the necessary hardware and all were able to operate the tools with guidance. There was no evidence that the online treatment provision had adverse effects on participation.
The maximum wait time for ClearSpeechTogether participants was around 4 months and no participants dropped out of the study for this reason.
AcceptabilityParticipantsThe target was to achieve a minimum 80% attendance rate for treatment sessions. In the ST group, attendance was 100% as sessions were rescheduled in case of issues. ClearSpeechTogether participants attended all individual sessions and at least 4 of the 5 group sessions per week. Two participants missed an entire week of group sessions due to illness or other commitments, lowering the overall attendance to 84% in this arm.
Only a small subset of homework diaries were returned, but those who did showed the expected level of homework practice. Those who did not complete the diary were asked verbally during the post-treatment interview and again indicated that they had been able to do at least some self-practice in between sessions. Daily observations of the participant led group sessions by the researcher indicated that all participants contributed equally to the group across the four weeks and performed the exercises as intended.
Fatigue levels were collected pre- and post-treatment largely to monitor for any adverse effects of the intensive group phase of ClearSpeechTogether. Whilst some participants reported increased fatigue levels post-treatment, this was not attributed to the effects of the therapy, but the overall worsening of their condition. Overall, Fatigue Impact Scale scores were relatively stable across both arms, with most participants reporting no change (ST: 78%, CST: 50%). A small number in each group reported feeling more tired afterwards (ST: 11%, CST: 20%), but there were also some who reported an improvement in fatigue levels (ST: 11%, CST: 30%). There is therefore no evidence that the intensity of the ClearSpeechTogether treatment had an adverse effect on participant wellbeing.
Qualitative feedback on the structure and scheduling of the treatment was largely positive for both arms. All participants felt that the treatment was appropriate to address their concerns about their speech and met their needs. Duration of the treatment was appropriate. Two of the eleven ClearSpeechTogether participants indicated that two sessions per week would have been sufficient during the group phase. Despite these reservations, their attendance was high and no adverse effects were noted. Many ClearSpeechTogether participants felt that the intensity had been important to the effectiveness of the treatment. Nobody reported any issues with working with the other members of the group and the observer indicated good dynamics and a supportive atmosphere throughout the sessions. Some participants felt that face to face treatment would have been preferable, but that this was outweighed by the fact that they did not have to travel to clinic for their session.
Finally, an important aspect of ClearSpeechTogether is that it is intended to provide longer term support by individuals continuing to meet after the intervention concludes. Of the two groups, the first met a further three times but participants then did not attend further, mostly for health reasons. The second group continues to meet on a monthly basis 12 months on from completing the intervention.
CliniciansTwo SLTs were involved in the treatment, but one only saw two ClearSpeechTogether participants for their four individual sessions. The interview was therefore only conducted with one SLT who reported that both treatment arms worked equally well in relation to being able to address patient need. As indicated, the strategies advised to participants across the two arms was relatively similar, however, ST allowed the inclusion of more tailored tasks to address participant’s areas of difficulty. The number of sessions provided were sufficient in both arms to reach the set goals, and no additional sessions had to be organised for ClearSpeechTogether participants during the group phase. ClearSpeechTogether was seen as valuable in providing group support and there were no concerns over adverse effects introduced by the participant led sessions. ClearSpeechTogether was considered superior in terms of clinician workload in relation to patient input and intensity, however, administration time to organise and support the group sessions would need to be considered in the health economic evaluation were the programme to be offered through the health service in future.
Signal for EfficacyPrimary OutcomesCommunication confidence and participation were the primary outcome measures. There were no significant differences at baseline for either measure (confidence: p = .080, CPIB: p = .870).
Both measures showed significant differences over time for both study arms (Table 2). Post-hoc analyses demonstrate that these changes mostly occurred between A1 and A3. Differences between A3 and A4 were not significant, indicating maintenance over time.
Table 2 Means and standard deviations and statistical results for pre- and post-therapy assessments for confidence and participation scoresGroup comparisons of the degree of change between pre- and post-intervention showed that the ClearSpeechTogether arm made significantly greater improvements than the ST participants for confidence between A1 and A3, and the effect size calculations (d) suggests a further potential difference between A1-A4 with a medium effect size. The remaining comparisons were not significant (confidence: A1-A3 p = .034, d = 1.016; A1-A4 p = .119, d = 0.682; CPIB: A1-A3 p = .414, d = 0.144; A1-A4 p = .563, d = 0.384, Fig. 2).
Fig. 2
Comparison of the absolute magnitude of change between pre- and post-therapy scores for ClearSpeechTogether and standard SLT. Abbreviations: CST: ClearSpeechTogether, ST: standard SLT, A: assessment
Further group differences emerged from the descriptive analysis considering clinically relevant thresholds for change in that a higher proportion of ClearSpeechTogether participants achieved an increase at or above the threshold (Fig. 3) for all comparisons.
Fig. 3
Percentage of participants who improved beyond the clinically relevant change thresholds for confidence and participation between pre-therapy (PT) and immediate (A3) and follow up post-therapy assessments (A4). Abbreviations: CST: ClearSpeechTogether, ST: standard SLT, PT: pre-therapy, A: assessment
The data thus suggest that both treatment arms successfully improved communication confidence and participation in many participants, and that these effects were generally maintained at follow-up. Both statistical and descriptive analyses suggested superiority of ClearSpeechTogether over ST in this respect.
Secondary OutcomesIntelligibility, breath support and voice quality were secondary outcome measures.
Intelligibility was evaluated in both reading and free speech tasks. The two arms were well matched at baseline (reading: p = .269, free speech: p = .389). There were no significant differences over time for either group or task (Table 3). The ST group showed a worsening of performance in reading at A4 which approached significance.
Table 3 Means and standard deviations and statistical results for Pre- and Post-Therapy assessments for reading and free speech intelligibility scores and maximum phonation time (MPT)There was no difference in the degree of improvement from pre- to post-intervention between the two arms in either reading (PT- A3: p = .287, d = 0.742; PT-A4: p = .102, d = 0.169) or free speech (PT- A3: p = .743, d = 0.181; PT-A4: p = .062, d = 0.617). However, the effect size analysis (d) suggested a medium to large potential for ClearSpeechTogether to show greater improvement for the PT-A3 comparison in reading, and PT-A4 in free speech. The descriptive analysis further supports this, indicating that a higher number of ClearSpeechTogether participants improved above the clinically meaningful threshold in reading at A3 (Fig. 4).
Breath support was evaluated on the basis of an MPT task. Groups were again well matched at baseline (p = .870). There was no difference over time for either group (Table 3) and group comparisons showed no significant differences in the degree of change (A3: p = .094, d = 0.634; A4: p = .810, d = 0.331) although there was a medium effect size for ClearSpeechTogether participants showing greater improvements at A3. Twice as many ClearSpeechTogether than ST participants improved their MPT beyond the 20% threshold across the two groups at A3, but there was no difference by A4 (Fig. 4).
The final analysis parameter was voice quality in sustained vowels and connected speech (supplemental materials: Tables S2a&b). Baseline levels were again comparable between groups (p = .454). Analysis over time indicated no significant differences. Group comparisons and descriptive analysis showed a small advantage of ClearSpeechTogether over ST at A3 but not A4 (Fig. 4). The GRBAS categories demonstrating the highest level of improvement in the ClearSpeechTogether group were roughness and strain (50% of participants), no particular pattern emerged in the ST arm.
Fig. 4
Percentage of participants who improved beyond the clinically relevant change thresholds for intelligibility, breath support (MPT) and voice quality measures between pre-therapy (PT) and immediate (A3) and follow up post-therapy assessments (A4). For voice quality, the figure presents the mean value across all five GRBAS scores. Abbreviations: CST: ClearSpeechTogether, ST: standard SLT, PT: pre-therapy, A: assessment, intel: intelligibility, R: reading FS: free speech, MPT: maximum phonation time
In summary, there were no statistically significant changes apparent over time for the secondary outcome measures. Effect sizes and descriptive analyses suggested potential for ClearSpeechTogether to have greater benefit for participants for intelligibility and breath support but this requires further investigation.
Despite the non-significant statistical results, qualitative reports on the secondary variables were generally positive (Supplemental materials: Table S3). Only two participants indicated no or negligible changes in their speech, the rest reported a range of benefits, with a stronger voice and better breath management featuring most frequently. There were no noticeable differences between the two study arms in this regard.
Given that our sample include a wide range of disease severities, it was possible that this factor might have influenced the therapy outcomes. We therefore correlated both motor and speech severity values with the degree of change from time-matched pre-therapy to immediately post-therapy (A3) outcomes. Whilst the total SARA and speech SARA scores were related to each other (r = .502, p = .028), we found no correlation between either of these severity scores and any of the primary or secondary outcome measures.
Finally, as indicated above, one ClearSpeechTogether participant had completed all stages of the trial before his diagnosis was changed from probable MSA-C to MSA-P and a full data set was therefore available for him. The results show that he also responded well to the intervention, his reading intelligibility improved beyond the threshold and this was maintained during the follow up assessment, and he was one of the few participants who showed improvements in monologue intelligibility. He also reported clinically relevant improvements in confidence and voice quality measures.
Comments (0)