This current paper is part of a more extensive study on auditory feedback control in cerebellar ataxia [25]. For the current paper, a contextual speech task was chosen to control conversational focus for the syntax analysis. Tasks obtained in the larger study are being utilized for future research.
ParticipantsIndividuals with Ataxic Dysarthria
Twenty-six participants with cerebellar ataxia (8 males, 18 females) were recruited for a prior study. Ages ranged from 24–79 years (M = 54.3, SD = 15.1). Education ranged from 12–22 years (M = 15.3; SD = 2.5). All participants were native speakers of American English. Participants had normal or corrected to normal visual acuity. Ataxia diagnosis was confirmed through participant self-reports of neurology or genetic testing. Participants were recruited through local support groups, outpatient clinics of local medical/rehabilitation facilities, flyers in the monthly National Ataxia Foundation newsletter [42], social media, word of mouth, the Communication Research Registry at Northwestern University, and the CoRDS registry [54],Coordination of Rare Diseases at Sanford). Summary characteristics of speakers with ataxia are provided in Table 1.
Table 1 Participant characteristics. Participants are listed by group (AT = ataxia, CO = control), participant number, sex (M = male, F = female), education, ataxia diagnosis (SCA = spinocerebellar ataxia, AOA = ataxia with oculomotor apraxia, SCAR = spinocerebellar ataxia recessive autosomal, FA = Friedreich’s Ataxia), disease duration, and dysarthria severityDysarthria type and severity were assessed using the Frenchay Dysarthria Assessment (FDA-2) [13], a standardized assessment sensitive to various severity and subtypes of dysarthria. The FDA-2 assesses the level of function for speech subsystems, including respiration, articulation, phonation, resonance, and intelligibility. Dysarthria severity was assessed by comparing the level of function across the speech subsystems. All participants completed the Dysarthria Impact Profile, a patient-reported outcome measure designed to measure the psychosocial impact of acquired dysarthria. All participants were screened for a cognitive impairment cut-off score using the Montreal Cognitive Assessment (MoCA)[41]. Only one participant received a score below the cut-off used for this study; all other participants scored within the normal range. This study was approved by the Northwestern University Institutional Review Board (IRB). All participants provided written informed consent prior to participating in the study. Research procedures involving human participants were conducted in accordance with the ethical standards of the Northwestern University IRB and with the 1964 Declaration of Helsinki and its later amendments or comparable ethical standards. This study was not a clinical trial (clinical trial number: not applicable).
Healthy Control Speakers
Twenty-eight adults with no reported history of speech, language, or neurological impairment were recruited for this study as age- and sex-matched control participants (10 males, 18 females). All participants were native speakers of American English. Ages ranged from 24–71 years (M = 54.1, SD = 15.0). Years of education ranged from 12–22 years (M = 17.3; SD = 2.1). Participants had normal or corrected to normal visual acuity. Participants passed hearing and cognitive screenings.
Experiment OverviewSpeech Sample
Spontaneous speech samples were elicited from participants for conversational speech (from the prompt, “Tell me about a typical day”), passage reading (from the Grandfather Passage; [51], and picture description (from the Cookie Theft Picture; [26]). For this study, only speech samples from the picture description task were analyzed, as it provides a structured yet flexible context that allows for variation in sentence production. Speakers were shown the picture and prompted with the following “Tell me what is going on in this picture for 2–3 min.” Participants spoke into an over-ear microphone (AKG, model C420) positioned approximately one inch from the corner of the mouth. Recordings of the microphone signal were obtained using a multi-channel recording system (AD Instruments, model ML785, PowerLab A/D converter) and LabChart software (AD Instruments, v.7.0) with a sampling rate of 20 kHz. Following these speech recordings, participants with ataxia completed the Dysarthria Impact Profile [66].
Syntactic Complexity Analysis
The picture description task was transcribed in ELAN (Version 6.3), which aligned the transcriptions with the audio file through manual segmentation by phrase. The resulting transcriptions were then exported as datasheets with specific time domains listed for each annotated phrase. For this analysis, two complete sentences from each participant’s picture description were randomly selected. A sentence was defined as meeting one of the following two criteria: (a) an independent clause with any associated dependent clauses, or (b) two independent clauses connected by a subordinating conjunction. This ensured that selections were full sentences rather than incomplete phrases, while also preventing artificially long sentences resulting from participants linking multiple independent clauses with coordinating conjunctions like “and.” To ensure unbiased sentence selection, a random number generator was used to generate integers corresponding to the line numbers of transcribed sentences. Each selected sentence was then reviewed to confirm that it met predefined criteria for a complete sentence (i.e., an independent clause with or without dependent clauses, or two independent clauses joined by a subordinating conjunction). If a selection did not meet these criteria, a new sentence was randomly chosen.
The speech phrases were broken into independent and dependent clauses. Dependent clauses were determined by identifying phrases following subordinating clauses or phrases that would stand as incomplete sentences in isolation. The selected sentences were run through a custom script in Python (version 3.9.2), which categorized all words within the sentences into parts of speech types using functions available in the Natural Language Toolkit (NLTK) package [5]. The accuracy of categorization was confirmed and adjusted as needed by two research assistants. A frequency of occurrence count was taken for each part of the speech category within the groups. These data can be seen in Supplemental Table 1.
A syntactic complexity scoring system was developed based on the natural acquisition timeline of syntax and morphology in children. Parts of speech were categorized by complexity level, with nouns and pronouns assigned to Level 1, as they are typically acquired first, around 10–12 months [64]. In contrast, more advanced grammatical structures, such as adjectives (including comparatives and superlatives), were assigned to Level 6, as their acquisition generally occurs later, around 5–6 years of age [64].
One challenge in classification involved particles and phrasal verbs, as there is limited research pinpointing the precise age at which they are acquired. While some phrasal verbs emerge early in language development [34], their intentional and contextual use may not become evident until later [52]. Another area requiring manual adjustment was the IN category, where “IN” is the tag used in Python’s NLTK package to denote both prepositions and subordinating conjunctions [5]. Because these word types develop at different times (prepositions around 27–30 months and subordinating conjunctions closer to 4 years of age) the research assistants manually assigned complexity levels based on their specific function within the sentence.
In the scoring system, points corresponded directly to complexity levels: Level 1 words received 1 point, Level 3 words received 3 points, and so forth. The full breakdown of the six-level system is presented in Table 2.
Table 2 Syntactic Complexity Scoring System Levels. Levels are listed by level number (Level), Part of speech abbreviation with written-out definition (Part of Speech), and stage of developmental acquisition (Acquired)Individual Complexity Scores
To give individual syntactic complexity scores, part-of-speech data was input into an Excel document. Levels were color-coded, and the occurrence of each part of speech per level was calculated using an Excel formula. The total occurrence was multiplied by the level number to award the correct number of points associated with each level. The sum of the points was taken to obtain a total complexity score for individual sentences. These can be seen in Supplementary Table 2.
Validation of the Novel Complexity Scoring Method
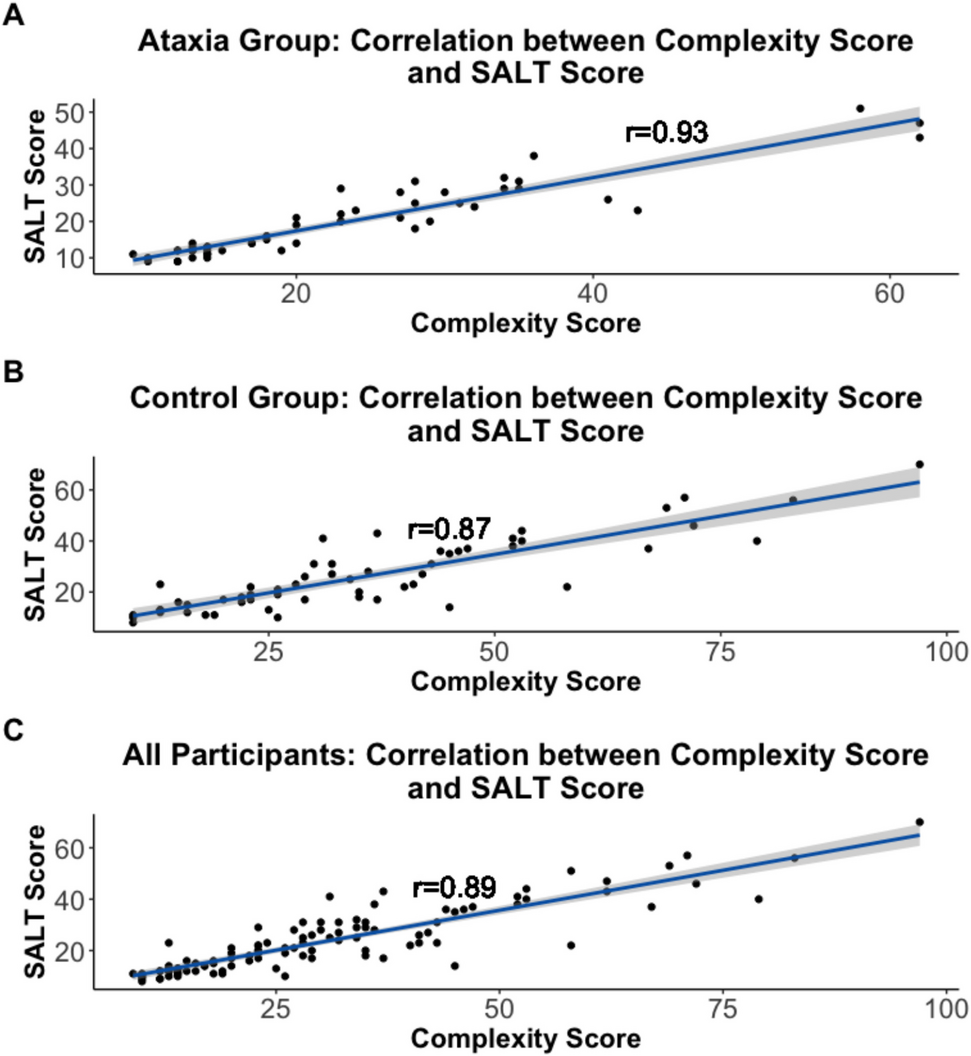
The process to validate the syntax scoring system used in this paper included an independent analysis using the Systematic Analysis of Language Transcripts (SALT) software [40]. This validation process involved coding each sentence for syntactic features (i.e., all bound morphemes including affixes, suffixes, past/present tense verb endings, plural “s” marker, possessive “s,” third person verb “s,” as well as subordinate clauses, and syntactic errors). Then, each coded sentence was entered into SALT and analyzed. The analysis for each sentence generated a standard measures report. From these reports, MLU (mean length of utterance) in morphemes, number of verbs, number of different words, and the subordination index score were entered into a spreadsheet and added together to create a combined SALT results score. A correlation analysis compared the complexity scores derived using the original formula from this study and the combined SALT results score. Three Pearson's correlation analyses were run to compare the scores for (1) the sentences produced by the subjects in the ataxia group, (2) the sentences produced by the subjects in the control group, and (3) scores for all sentences produced by all subjects in the study. A high correlation between the complexity scores using the novel scoring method created for this study and the SALT results scores can provide validation of the original scoring method created for this study and confirm that it is an accurate measure of complexity.
Of note, the novel complexity scoring system utilized in this study was developed to obtain a nuanced understanding of expressive syntax. We anticipated that any differences in expressive language between groups might be sub-clinical, as no participants in the AD group were presenting with overt evidence of a language disorder based on clinical observation. Thus, it was critical to examine syntactic organization at a deeper level than can be obtained using the SALT program. Therefore, while the standard measures obtained with SALT were utilized to validate our complexity scoring system, the novel scoring method was necessary to address the goals of the study.
Speech Naturalness Ratings for Final Analysis
The final analysis evaluated the predictive factors of these complexity scores, in which speech naturalness was one of the predictors included in the model. Speech naturalness ratings were included as an exploratory predictor of syntactic complexity. Naturalness ratings, as commonly used in the perceptual evaluation of dysarthric speech, reflect an overall impression of how typical a speaker’s prosody, rate, and voice quality sound to a listener. We hypothesized that lower naturalness could be associated with reduced syntactic complexity. Specifically, speakers with severely disrupted prosody or strained vocal quality may simplify sentence structure as a compensatory mechanism to improve fluency or reduce the motor demands of speech. This inclusion allowed us to examine whether perceptual speech degradation corresponded with syntactic adaptation in ataxic dysarthria.
Speech naturalness was evaluated using a perceptual rating approach in which trained raters assessed speech samples on a seven-point interval scale, with higher scores indicating more natural-sounding speech. Raters were instructed to evaluate naturalness based on how well the sample adhered to expected norms of rate, rhythm, intonation, and stress patterning. Each speech sample was presented twice to the rater: first for naturalness scoring and then for orthographic transcription, ensuring that naturalness judgments were independent of intelligibility assessments. The ratings were completed by nine graduate students in speech-language pathology, all of whom were fluent in American English, had completed coursework on motor speech disorders, and reported normal hearing abilities. To ensure consistency, 15% of the trials were duplicated for intra-rater reliability analysis, and all trials were intensity-normalized to 70 dB. The same naturalness ratings used in this study were derived from the methodology detailed in Hilger, Cloud, and Fahey [23], which demonstrated moderate to high inter- and intra-rater reliability for speech naturalness assessments. For additional details on the rating procedures and methodology, refer to Hilger, Cloud, and Fahey [23].
Statistics
The goals of this analysis were fivefold: (1) to determine if the novel complexity score analysis was validated against SALT scoring, (2) to determine if there was a group difference in syntactic complexity across all sentences, (3) to determine if the inclusion of a dependent clause influenced syntactic complexity by group, (4) to determine if there was a group difference by the number of dependent clauses used, and (5) to analyze potential predictors within the ataxia group for syntactic complexity by dysarthria severity, dysarthria impact scoring, speech naturalness rating, age, and sex. For all goals apart from the fourth, linear mixed-effects regression models were built using the lme4 package [3] in RStudio (version 2022.07.1; [48]) running R (version 4.2.0; [50]). An alpha level of 0.05 was set as a reference for statistical significance using the lmertest package [33]. Cohen’s d was calculated for significant results using the effect size [4].
For the first goal, the complexity score was predicted by the interaction of the SALT score and group to determine if these two scoring systems correlated for all sentences combined as well as separately for the control vs. ataxia groups. For the second goal, the complexity score was predicted by group and whether the sentence had a dependent clause with random intercept included by participant. The dataset for this model included all sentences in the study. If the sentence included a dependent clause, it was labeled as “yes” in the binary dependent clause variable. For the third goal, we analyzed group differences for complexity scores for only independent clauses, and then only for dependent clauses. For the fourth goal, a generalized linear mixed-effects model (GLMM) was built using the lme4 package to determine if the number of dependent clauses was predicted by Group (Ataxia, Control) using a binomial GLMM, with random intercepts by Participant to account for repeated measures. Odds ratios and confidence intervals were computed to quantify the likelihood of producing dependent clauses by group. Finally, the fifth analysis used a linear mixed-effects regression model to determine if complexity score was predicted by age, sex, dysarthria severity, or speech naturalness rating with random intercept by participant.


Comments (0)