
Remember me

SAHA and CI-994 are used as positive controls and purchased from Sigma Aldrich. Propidium iodide (PI) stain was obtained from SRL chemicals. The Annexin V-FITC apoptosis staining/detection kit was procured from Abcam. Actin phalloidin stain was purchased from Sigma Aldrich. Dulbecco’s Modified Eagle Medium (DMEM) was acquired from Himedia. HDAC1 (Catalogue No. 50051) and HDAC2 (Catalogue No. 50002) were purchased from BPS Biosciences.
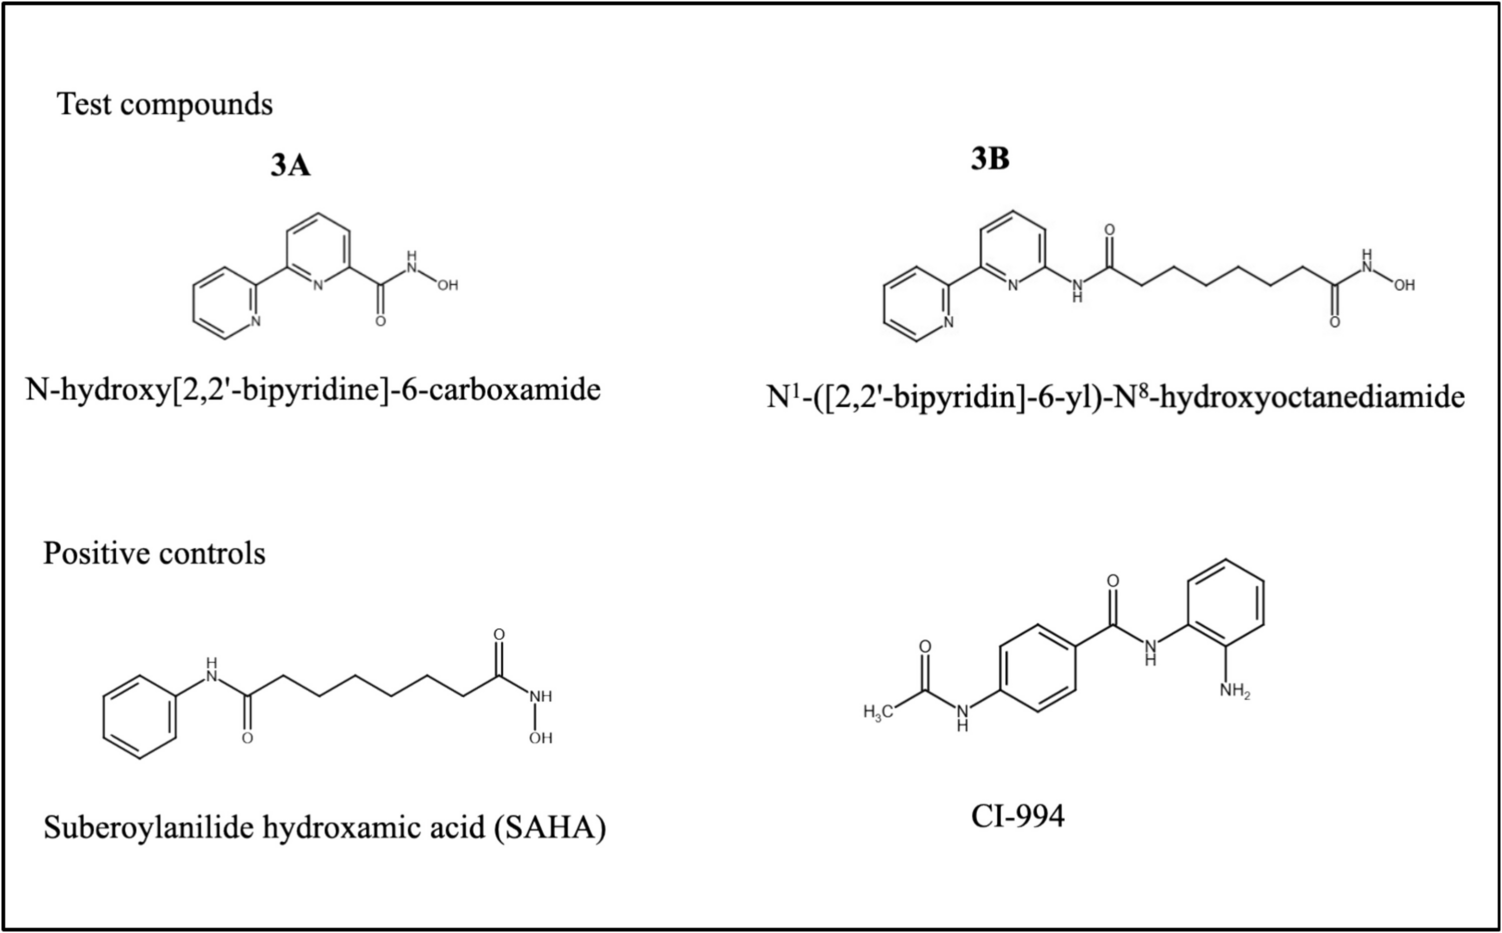
Chemical structureTwo novel hydroxamic acid derivatives (3A—N-hydroxy[2,2'-bipyridine]-6-carboxamide and 3B—N1-([2,2'-bipyridin]-6-yl)-N8-hydroxyoctanediamide), which are analogues of SAHA, were designed, synthesized, and characterized previously in our lab. The compounds are patented by Manipal Academy of Higher Education, Manipal (Patent ID No. 202441019540). Preliminary data support that these compounds are potent HDACis and docking study shows these compounds as potent HDAC1 and 2 inhibitors. The structures of the compounds are given below along with the positive controls (SAHA and CI-994) (Fig. 1).
Fig. 1
Chemical structures of the test compounds (3A and 3B) and positive controls (SAHA and CI-994)
Biological evaluationSH-SY5Y, human neuroblastoma cell line was obtained from American Type Culture Collection (ATCC) and was cultured in DMEM/F12 low glucose media supplemented with 10% FBS. The cell line was incubated at 37 °C with 5% CO₂ in an Eppendorf CellXpert® C170, and the culture media was replaced every 48–72 h to support ideal growth. BALB/c male nude mice was procured from ACTREC Mumbai.
Cytotoxicity assaySH-SY5Y cells were loaded at 100,000 cells/mL, in a 96-well plate and was incubated for 24 h. Different concentrations of drugs were dissolved in dimethyl sulfoxide (DMSO), and the cells were treated with different concentrations of test compounds and maintained for 48 h. After that, 5 mg/mL of MTT solution was added and incubated for 4 h. The MTT added media was discarded, and DMSO was added in each well. Absorbance was recorded at 570 nm and 630 nm using a TECAN multiplate reader (Austria).
Cell cycle analysisSH-SY5Y cells were cultured and plated 1,000,000 cells/mL in a 10-cm plate. After reaching 60% confluency, they were exposed with different concentration of the test compounds and maintained for 48 h. After that, cells were washed with PBS, trypsinized, and fixed with 70% ethanol and incubated for 1 h. Followed by, centrifugation at 106 rcf for 10 min at 4 °C. RNase was added to pellet and kept for 3 h in water bath at 37 °C, then stained with PI and incubated for 30 min. The readings were recorded via Beckman Coulter CytoFLEX flow cytometer (California, USA).
Apoptosis assayApoptosis was assessed following drug treatment using flow cytometry. 30,000 cells were plated per 3 mL of media in a 6-cm plate, maintained for 24 h. Cells were treated with various concentration of the test compounds and incubated for 48 h. Then, cells were collected, centrifuged, and to the supernatant binding buffer was added and stained using PI and Annexin V. The cells were incubated for 10–15 min in dark, and apoptosis analysis was performed using the Partec CyFlow Space flow cytometer with FloMax software (Germany).
Colony formation assaySH-SY5Y cells were seeded (500 cells/well) in a 6-cm plate. After 24 h, cells were exposed with IC50 concentrations of the test compounds, maintained for 48 h. Media was changed every 3 days. After 14 days, colonies were stained using 0.4% crystal violet for 10 min and washed twice with Milli-Q; then, colonies were counted.
Confocal imagingSH-SY5Y cells were cultured on coverslip placed in a 6-cm plate and were treated with different concentration of the test compounds, which were incubated for 48 h. After that, the coverslips were rinsed with PBS to eliminate residual media, and then, the coverslips were further processed. First cells were fixed using 4% paraformaldehyde; blocking was performed using 5% bovine serum albumin and 0.5% Triton-X for 1 h. The cells were further stained with actin phalloidin for 45 min, followed by stain removal and two washes with PBS. The cells were subsequently stained with DAPI stain for 10 minutes, after which another PBS wash was performed. Then, the coverslips were mounted on glass slide and visualized using Leica SP8 confocal microscope via the Leica Application Suite (Germany).
HDAC1 and HDAC2 activity assayIn a multiwell plate (black), different concentrations of test compounds, HDAC assay buffer, and HDAC1/HDAC2 proteins were mixed and incubated for 30 min. A fluorescent substrate (Boc-Lys (Ac)-AMC) was then added to the reaction mixture and continuously shaken at room temperature for 2 h. To stop the reaction, a developer solution consisting of trypsin, Trichostatin A (TSA) (0.2 mM), and HDAC assay buffer was added and the mixture was left at room temperature for 10–15 min. Fluorescence intensity was recorded using a TECAN multiplate reader, with an excitation wavelength of 354 nm and emission wavelength of 450 nm.
Western blottingSH-SY5Y cells were plated 200,000 cells/well in a 6-well plate and treated with different concentration of the test compounds and incubated for 24 h. After that cells were lysed in RIPA buffer, lysate was collected and centrifuged to collect the protein. Protein samples were separated using SDS-PAGE. Subsequently, proteins were then transferred onto a nitrocellulose membrane for 2 h. The blocking was done by 5% BSA and incubated with CST antibodies, including acetyl-histone H3 (Lys9), acetyl-histone H4 (Lys8), Bax, Bcl-2, and β-Actin at a 1:5000 dilution. After that, it is incubated with secondary anti-rabbit antibodies at a 1:5000 dilution. The protein bands were visualized via the iBright™ CL1500 Imaging System (USA).
Antitumor activityAnimal experiments were carried out in accordance with ethical guidelines with prior approval from the Institutional Animal Ethics Committee, Manipal Academy of Higher Education, Manipal (IAEC No. IAEC/KMC/82/2023). All experiments were carried out at the animal house facility, Manipal Academy of Higher Education, Manipal. For this study, male BALB/c male nude mice aged 6–8 weeks with body weights of approximately 25–30 g were used. Xenograft models were generated by subcutaneously injecting 3 × 10⁶ SH-SY5Y cells into the flank region of the mice. When the tumor volumes reached approximately around 100–300 mm3, the mice were randomly allocated to two groups control and treatment group (n = 3) for further studies. The treatment group received oral administration of compound 3B at daily dose of 50 mg/kg for 14 days. The drugs were administered using a solution containing 10% DMSO and 10% cremophor in Milli-Q water. The tumors were excised, and weight was recorded. The excised tumors were then subjected to histopathological analysis to evaluate the in vivo antitumor efficacy of compound 3B against neuroblastoma cells.
HistopathologyHematoxylin and eosin (H&E) staining was conducted to examine tissue pathology. Paraformaldehyde (4%) was used to first fix the tissue samples, followed by dehydration and paraffin embedding. Using a microtome, the samples were sliced into 4 µm thick vertical sections. After the dewaxing process, the sections were stained using Mayer’s hematoxylin for 5 min, followed by eosin-phenoxine staining for 2 min. Subsequently, the stained sections were dehydrated and sealed using neutral resin. A coverslip was placed on each slide, and the processed slides were observed under an LX-500 LED trinocular research microscope (Labomed). Images were captured using a MiaCam CMOS AR 6pro microscope camera connected to the Image AR Pro software. Histopathological analysis was carried out to assess tumor morphology, including necrosis, tumor cell presence and mitotic figures.
Comments (0)