Patients
Nine patients with glioma who underwent tumor resection at Gifu University Hospital between June 30, 2023 and May 10, 2024 were included in the study. They were pathologically diagnosed, and their tumors were classified according to the 2021 WHO classification. All patients provided consent. The study was approved by the Ethics Committee of Gifu University Graduate School of Medicine (Number: 2023-025).
Surgery
All patients underwent maximum tumor resection performed by N.N. using an exoscope (ORBEYE; Olympus, Tokyo, Japan) and a navigation system (BrainLAB, Munich, Germany). Gadolinium-enhanced MRI (Gd-MRI) was used as the baseline for navigation systems.
MRI
Three-dimensional turbo field echo T1-weighted images were acquired under the following conditions: repetition time, 15 ms; echo time, 3.8 ms; field of view, 26 × 26 cm; matrix size, 288 × 288 in the sagittal plane using a 3 T MRI machine (Intera Achieva Quasar-dual 3.0; Philips, Best, the Netherlands). Transaxial images were obtained from the sagittal images. The slice thickness was 3 mm, and the slice gap was 1 mm. Gadobutrol (Gadovist; Bayer, Leverkusen, Germany), a gadolinium-based contrast agent, was administered at 0.1 mmol/kg for the contrast sequence. The tumor vessels in the gadolinium-enhanced area were initially observed using an optical microscope. This was followed by assessment of the MRI and histopathological images of the same sites.
Tissue preparation
Surgical specimens were collected immediately after tumor resection to prepare frozen sections. Each sample consisted of approximately 5-mm3 cubes of tissue. Tissues were protected with Tissue OCT compound (Sakura Finetek, Japan), snap-frozen in liquid nitrogen, and stored at − 80 °C. Next, 5-μm serial sections were generated using a Leica CM1850 cryostat (Leica Microsystems, Wetzlar, Germany). The sections were air-dried at room temperature for 30 min. For the preparation of the formalin-fixed paraffin-embedded sections, the surgical specimens were fixed in 10% neutral buffered formalin, routinely processed, and whole-mount embedded.
Histological and immunohistochemical procedures for paraffin sections
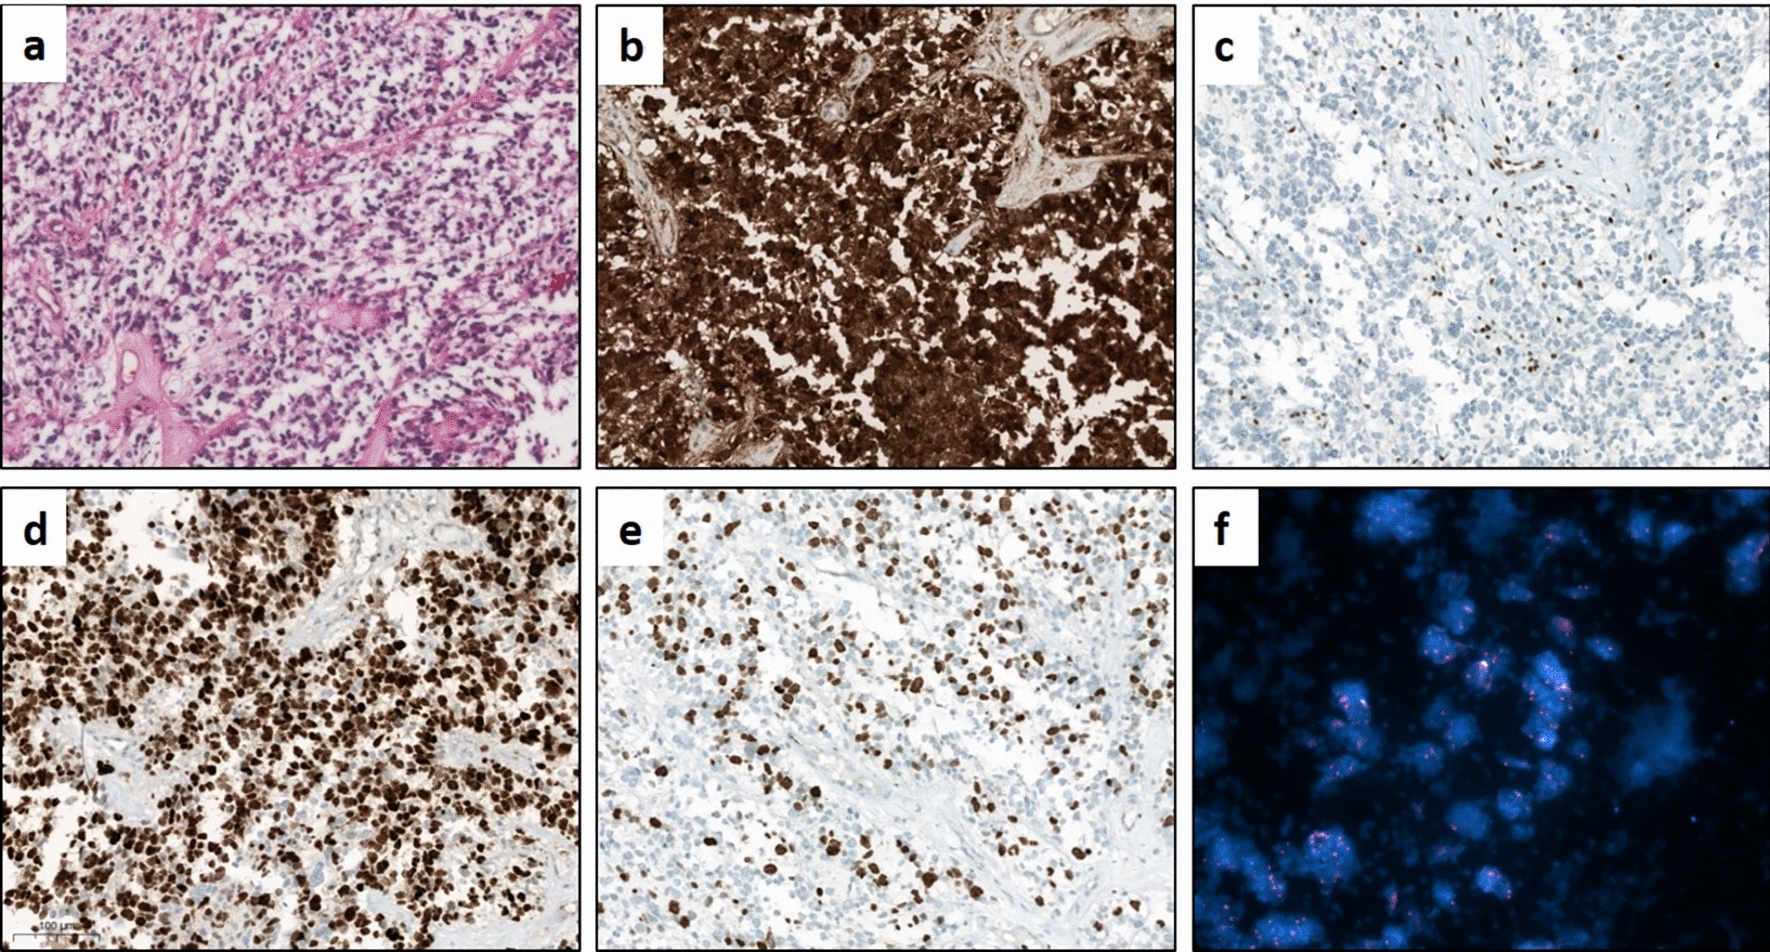
Paraffin blocks were dissected into 3-μm thick sections and subjected to hematoxylin and eosin (HE) staining using a routine procedure. Adjacent serial sections were subjected to immunohistochemistry for CD31. For immunostaining, deparaffinized sections were subjected to autoclave boiling in Tris EDTA buffer solution (pH 9.0) for 10 min at 110 °C as an antigen retrieval procedure before incubation with 3% H2O2 diluted in methanol for 10 min and blocked with 2% normal bovine serum. The sections were incubated with rabbit anti-CD31 antibody (dilution 1:200, ab76533; Abcam, Cambridge, UK) overnight at 4 °C, followed by incubation with peroxidase-labeled anti-rabbit antibody (Histofine Simplestain Max PO [R]; Nichirei) for 60 min at 37 °C. The immunoreaction was visualized using 3,3′-diaminobenzidine tetrahydrochloride (DAB; Sigma-Aldrich, St. Louis, MO, USA). The sections were counterstained with hematoxylin, mounted on slides with mounting medium, and topped with coverslips.
Double staining with fluorescence-labeled lectins and anti-CD31 antibody
Twenty different types of lectins (lectin screening kits; I–II, Vector Laboratories, Newark, CA) were used in this study. Lectins are useful in detecting glycan expression in tissue sections and are classified into five groups according to their binding specificity and inhibitory sugars: N-acetylglucosamine, mannose, N-acetylgalactosamine, complex-type N-glycan groups, and fucose [18]. The fresh frozen sections were fixed for 15 min in 4% paraformaldehyde (0.1 M phosphate buffered saline [PBS], pH 7.4). They were subsequently soaked in PBS for 10 min, placed in carbon-free blocking solution (CFBS; Vector Laboratories), and maintained at room temperature for 60 min. Next, a mixture of biotinylated-lectin and a rabbit monoclonal anti-CD 31 antibody (dilution 1:200, ab76533; Abcam) was added and kept overnight in a refrigerator at 4 °C. After soaking in PBS for 15 min the next day, streptavidin-DyLight 594 (dilution 1:200, Vector Laboratories) and goat anti-rabbit IgG H&L-DyLight 488 (dilution 1:200, ab96899; Abcam) were added, and sections were maintained at room temperature for 60 min. They were soaked in PBS for 15 min, followed by 4ʹ,6-diamidino-2-phenylindole dihydrochloride (DAPI; DOJINDO, Kumamoto, Japan) for 5 min. The sections were soaked again in PBS for 5 min, sealed with a fluorescent anti-extinguishing sealant, and observed under a microscope (BX53; Olympus) [19].
Assessment of lectin-staining intensity
ImageJ software was used for the quantitative analysis of fluorescence intensity. The intensity analysis was performed manually with 40 high-power fields per sample (n = 3 per sample) in the focal plane. A straight line was drawn on the merged image, with green representing the endothelium and red indicating the presence of lectins. The staining intensity profile of lectin was represented by a line on the corresponding image [20]. The areas where the lectin intensity profile (red channel) showed higher values than the CD31 intensity profile (green channel) were identified in the curve graph of the 20 different types of lectin staining.
Scanning and transmission electron microscopy
Sample preparation for electron microscopy was performed as described previously [21, 22]. The tissue samples were diced into approximately 5-mm3 cubes for scanning electron microscopy (SEM) and 1-mm3 cubes for transmission electron microscopy (TEM). Some of these tissue pieces were light-shielded and soaked overnight in 2% glutaraldehyde at 4 °C. To observe the microstructure of the endothelial glycocalyx using electron microscopy, the rest of the tissue pieces were immersed overnight in a solution comprising 2% glutaraldehyde, 2% sucrose, 0.1 M sodium cacodylate buffer (pH 7.3), and 2% lanthanum nitrate. They were soaked overnight in a solution without glutaraldehyde the next day and washed in an alkaline (0.03 M NaOH) sucrose (2%) solution. The specimens were dehydrated using a graded ethanol series. The frozen fracture method was used to prepare the samples for 3D examination using SEM. Each sample was placed on an iron plate chilled with liquid nitrogen, and ethanol was sprinkled onto it. The sample was fractured using a chisel once the ethanol was frozen, such that it was not directly touched. They were incubated with tert-butyl alcohol at room temperature. The tert-butyl alcohol was freeze-dried after it solidified, and the specimens were examined using SEM (S-4800; Hitachi, Tokyo, Japan). To prepare the samples for TEM, each specimen was embedded in an epoxy resin. Ultrathin sections (90 nm) stained with uranyl acetate and lead citrate were examined using TEM (HT-7800; Hitachi).
Quantitative assessments of the endothelial glycocalyx height
Quantitative morphometric analyses were conducted on coded samples by an examiner blinded to the case details. The endothelial glycocalyx height was assessed by selecting five capillary vessels randomly chosen from TEM images for each case. The average height of the endothelial glycocalyx was determined by taking measurements at five points along the vessel wall, except for the nuclear part [21].
Statistical analysis
For the assessment of lectin-staining intensity, statistical significance was determined using the Wilcoxon rank-sum test. All statistical analyses were performed using JMP 14.2 software (SAS Institute, Cary, NC, USA). Statistical significance was set at p < 0.05 for all analyses. All data are presented as mean ± standard error of the mean.


Comments (0)