
Remember me
Leveraging recent efforts to compile advancements in nonlinear optical characterization across eight categories of materials and structures since the year 2000, we introduce a digitized version of the resulting data tables published in Vermeulen et al (2023 J. Phys. Photon. 5 035001). Presented in the form of a web-application, users are able to search, filter, and extract information ranging from material and structure information, excitation parameters, measurement technique, and nonlinear coefficients from the data tables presented in Vermeulen et al (2023 J. Phys. Photon. 5 035001). The effort is intended to improve reliable access to nonlinear material parameters and support the growing international nonlinear optics community.
Export citation and abstractBibTeXRIS
Characterizing the nonlinear optical properties of materials and structures has been an active area of research for more than 60 years. Building from early studies of harmonic generation and index modulation, the last few decades have seen significant expansion due to growing capabilities in material development, theoretical understanding, fabrication and integration, and light sources which cover new spectral regions. In an effort to aid the community, advancements since the year 2000 in nonlinear optical bulk materials, solvents, 0D–1D–2D materials, metamaterials, fiber waveguiding materials, on-chip waveguiding materials, hybrid waveguiding systems, and THz nonlinear materials were recently compiled into data tables through an international effort of researchers [1]. While a significant resource for the community, digital versions of the data tables would enable improved access to the properties and parameters of the listed materials and measurements. Here we introduce a web-based application, entitled Nonlinear Optics Info Table (NLOINFO)[2], which enables users to query, filter, and download relevant material, measurement, and nonlinear parameters. In this work we introduce NLOINFO and provide a short overview of its capabilities.
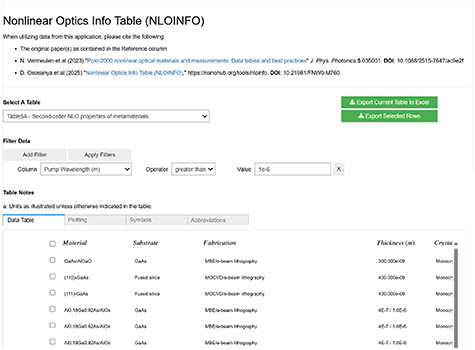
NLOINFO is provided through the hubzero [3] platform on the nanohub.org website [4], accessible at nanohub.org/tools/nloinfo [2]. Upon launching the application, users are presented with a GUI front end where they may interact with the data from various data tables as published in [1], see figure 1. The nonlinear optical information, as presented in [1], has been subdivided into eight categories: bulk materials, solvents, 0D–1D–2D materials, metamaterials, fiber waveguiding materials, on-chip waveguiding materials, hybrid waveguiding systems, and THz nonlinear materials. Second-order and third-order nonlinear measurements have been subdivided into separate tables where applicable.
Figure 1 Overview of the NLOINFO web-application front page.
Download figure:
Standard image High-resolution imageUsers begin by selecting the table of interest, and the table is loaded under the ‘Data Table’ tab at the bottom of the application while notes associated with table entries or headers are displayed above the output area. Table names and numbers correspond to the tables as outlined in the original publication [1]. Symbols and abbreviations used throughout the tables are defined in the corresponding tabs of the output area.
Custom filters of the data may be applied by selecting the ‘Add Filter’ button. Filters can be applied to any column and are defined based on operators such as ‘equal to’ or ‘greater than’, and vary for text-based and numerical columns. Filters are applied to the table by selecting the ‘Apply Filter’ button. Filters can be stacked allowing fine-grained filtering of the available data. Filters are removed by selecting the x-button to the right of the appropriate filter operation.
Users may also plot data of any numerical column against any other numerical column in the ‘Plotting’ tab. To do so, users select the entries they which to plot using the checkbox next to the entry, or by selecting all rows with the checkbox in the table header. Then, navigating to the ‘Plotting’ tab, users can select the column for the x-axis and y-axis and select ‘Plot Scatterplot’. References are denoted with a number next to the data point which are enumerated in a table below the plot. Resetting the plot is completed by selecting the ‘Reset Scatterplot’ button. We note that not all table entries have a value in every column, and only references which contain numerical values for both the x- and y-axes will be plotted.
Once the appropriate information has been identified, users may download entries from the table by using the green export functions. The ‘Export Current Table’ function exports all currently displayed data while the ‘Export Selected Rows’ only outputs the rows of the table whose checkbox is selected. Both functions output the relevant table entries to a .csv file that is tab-delimited as commas appear within certain entries of the table. Original unmodified tables may also be extracted by exporting an unfiltered table.
It is also important to mention several standards that were used when converting the originally published data tables of [1] into a digital format that is friendly for queries. First, values with relative markers such as >, <, or ∼were separated, displaying the marker and number in adjacent columns. While both columns will be included, only the numerical column is searchable. A note is subsequently placed in the comments section of the table to indicate the appropriate interpretation of the value. For entries in [1] which contained a range of values, such as over thickness or wavelength, or multiple specific values, such as multiple nonlinear coefficients, the largest value is displayed within the digital table. Both the originally displayed range and list of values are subsequently noted within the comments column. Moreover, as in the original tables, superscript symbols are included in the first column of an entry to identify traits in the measurement such as varied parameters. For more details on entries with varied parameters, we direct readers to the originating reference through the link provided. For entries which contain complex numbers, the real and imaginary parts were placed in separate columns. Entries which contain error values have been modified to display only the central value while the deviation value is displayed in the comments column. Columns which contained multiple entries or multiple units were separated into individual columns where feasible. As a result of these modifications, it is essential that users refer to the comments column to ensure an accurate interpretation of the data as needed for their application. Additionally, all units within the tables have been returned to base SI units where practical. Lastly, the THz material table is not included in the initial release of NLOINFO due to the large number of qualitative entries for that table in [1] which make numerical conversion impractical. We refer users to the originally published table [1] for information on THz nonlinear materials. While presently a limitation, we hope that continued development of this and other fields in nonlinear optics will yield data and discoveries which would be amenable to this application.
In keeping with the spirit of the original data table effort, we have endeavored to design the application to make updates to the existing data tables and the addition of new tables as easy as possible. The data tables are organized in individual Microsoft Excel® workbooks. This allows broad file compatibility and familiarity with the data structure, allowing modification or addition of new entries and even entirely new tables through future efforts of the community.
Due to the manual manipulation required to transform the originally published data tables into a format suitable for this application, we note that cross-checks of all entries were completed by comparing the values in the backend digital tables with those of the published article [1]. Keeping with the spirit of the original project, this aims to improve the reliability of the data contained within the resource.
In conclusion, we provide a new resource to the nonlinear optics community which provides a vast database of details and properties for nonlinear measurements in a user-friendly application. In addition to the features available in the initial release of NLOINFO, future updates are planned to expand the functionality and utility of the tool. To ensure that all works are appropriately acknowledged, we request that users of the application cite the original paper containing the data (reference contained within the application), the data table project [1], as well as the NLOINFO application.
The data that support the findings of this study are openly available at the following URL/DOI: https://doi.org/10.21981/N2B5-ZF55.
N.K acknowledges funding from the Air Force Office of Scientific Research Grant FA9550-22-1-0383, National Science Foundation Grant 2322891, and Virginia Commonwealth University Department of Electrical & Computer Engineering.
Comments (0)