Lifelines and Palga
A cohort study was conducted by use of the Lifelines database, for which the design and rationale have been described in detail elsewhere [25,26,27]. In brief, Lifelines is a multi-disciplinary prospective population-based cohort study examining, in a unique three-generation design, the health and health-related behaviours of 167,729 persons living in the North of the Netherlands. Questionnaire data, measurements, and biological samples have been collected from the entire cohort in general assessment rounds. Up to now, there data from the baseline (2007–2013), second (2014–2017) and third (2019–2023) assessment round are available. This study is conducted according to the Declaration of Helsinki and approved by the medical ethics committee of the Universitair Medical Center Groningen (no. 2007/152) and is ISO certified (9001:2008 Healthcare). A written informed consent was collected from all participants. Since 1971, Palga has played an indispensable role as the sole data expert in the Netherlands responsible for collecting, safeguarding, and providing access to pathology data, and achieved full nationwide coverage in 1991 (https://www.palga.nl/, accessed on 4th July, 2025). The integration of Lifelines with Palga further enriched this data by linking demographics, blood/anthropometric metrics, and cancer diagnoses.
Inclusion and exclusion criteria
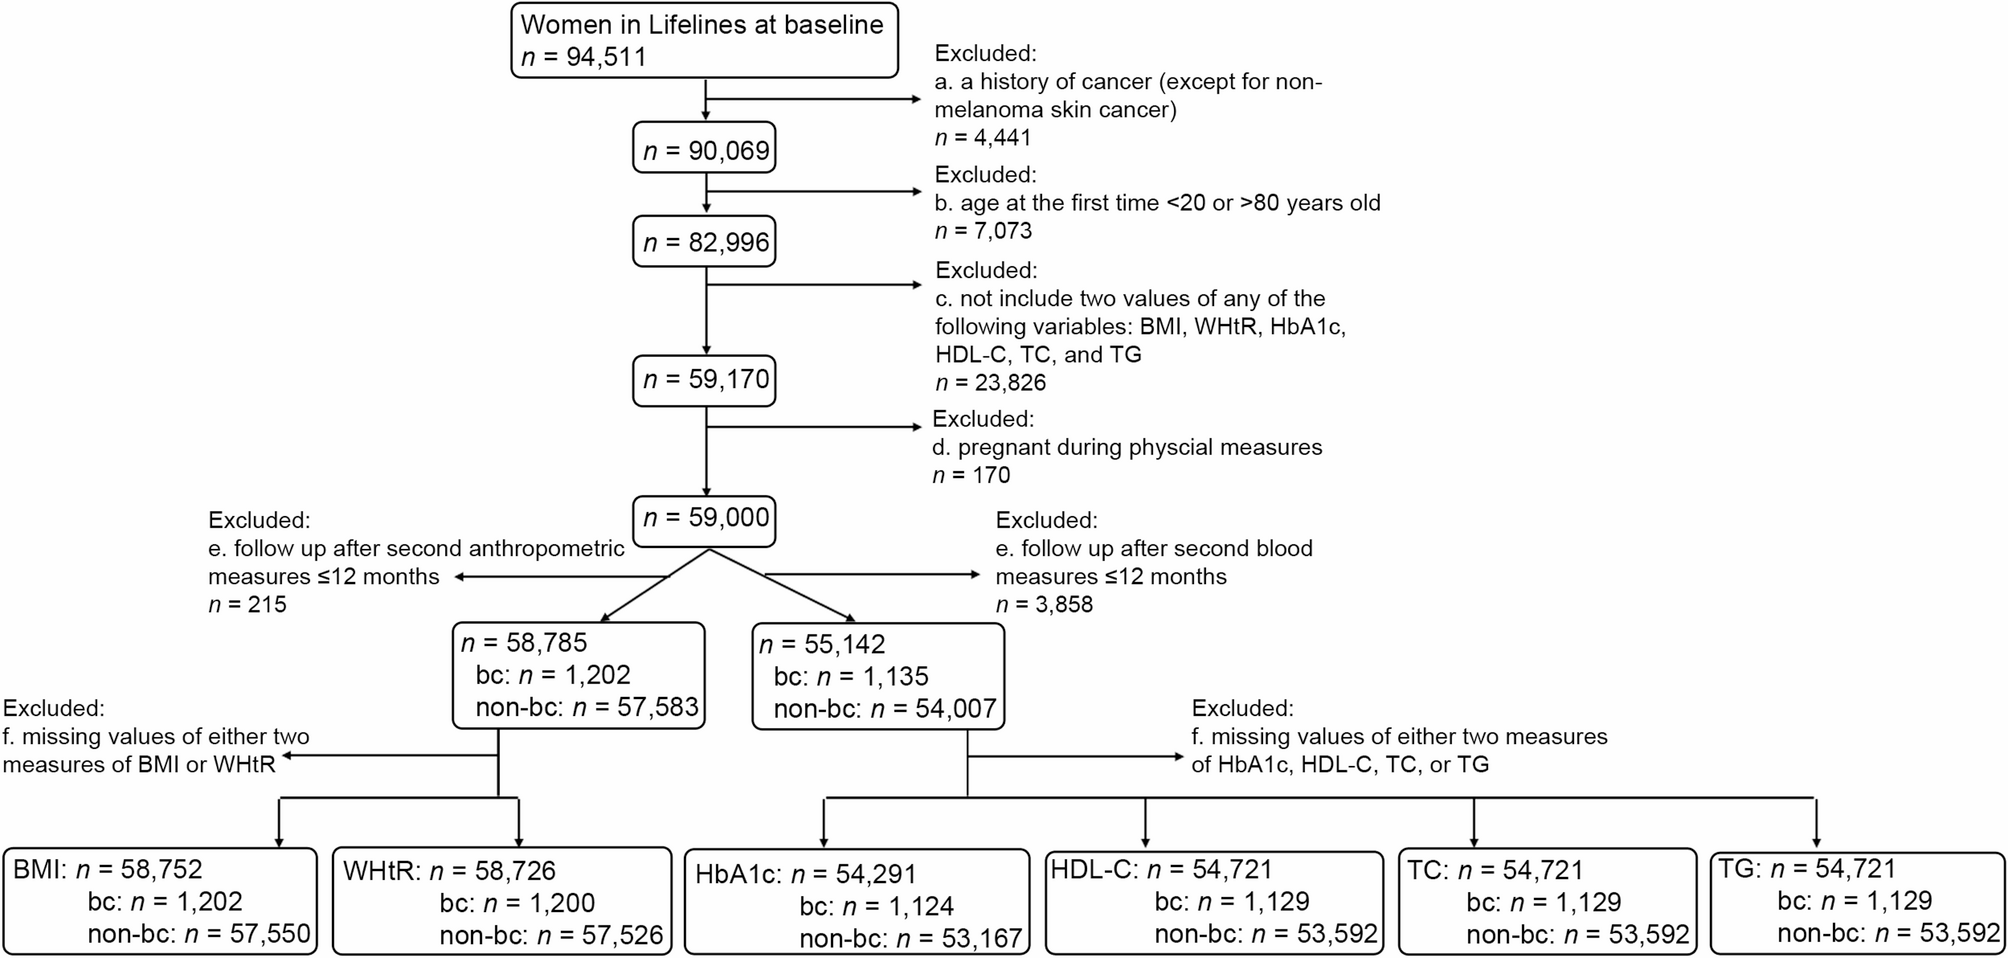
Women aged 20–80 with measurements of either BMI, WHtR, HbA1c, HDL-C, TC, or TG at baseline and second assessment rounds available in Lifelines were included. Woman with a history of cancer except non-melanoma skin cancer at baseline, or a follow up less than 12 months after the second assessment round, or who were pregnant at the time of either assessment round, were excluded. To account for potential differences in measurement dates, follow-up periods were calculated separately for anthropometric measures (e.g., weight, height, waist circumference) and blood measures (e.g., HbA1c, HDL-C, TC, TG). Analyses for each metric of interest included only participants with complete data at two time points. For instance, when working on the mean annual change (mean AC) in BMI, only women with BMI measured at both two time points were included in the analysis.
Baseline definition
The date of the baseline examination for anthropometric metrics (i.e., BMI and WHtR), glucose (i.e., HbA1c), or blood lipids (i.e., TC, HDL-C and TG), was defined as the index date at baseline.
Metrics of interest
The metrics of interest are defined as the mean AC in the following metabolism-related metrics: BMI, WHtR, HbA1c, HDL-C, TC and TG. In detail, the mean AC in years was calculated as: mean AC = (X2 – X1)/(t2 – t1), where X1 and X2 separately stands for the baseline and follow-up values obtained in the first and second examinations, and t1 and t2 are the dates of the first and second physical examinations. To clarify, t1 and t2 may show slight variations between anthropometric and blood metrics, and we used the exact dates corresponding to each specific exposure. The mean AC for each metric was further categorized into three groups—decrease, no change, and increase—based on standard deviation (SD). Specifically, mean AC values below − 0.5 × SD were classified as the decrease, those equal to or above 0.5 × SD as the increase, and values between these thresholds as the no change. As we focused on variations within individuals, with an expectation of a high correlation between the two measures, we selected 0.5 × SD instead of 1 × SD to achieve a balanced sample size across groups.
Outcome of interest
The outcome of interest was time to breast cancer diagnosis, including invasive and in situ carcinomas. Participants were followed from the time at the second physical examination till the diagnosis of breast cancer or death or the last date of follow up: March 16th, 2023. Mortality data were obtained from the Municipal Personal Records Database (Basisregistratie Personen, BRP), which contains personal information on all residents of the Netherlands. Death certificates are available for residents. Breast cancer diagnoses were retrieved from the Palga database, where daily pathology results are automatically submitted to. Given the reliability of both the Municipal BRP database and the Palga database, loss to follow-up is not anticipated.
Potential confounders
The following variables at baseline were collected and regarded as potential confounders. Several were categorized into three groups in tertiles, namely age in years (T1: <41; T2: 41–49; T3: ≥50), BMI in kg/m2 (T1: <23.3, T2: 23.3–26.7, T3:≥26.8), WHtR (T1: <0.47, T2: 0.47–0.52, T3: ≥0.53), HbA1c in % (T1: <5.4, T2: 5.4–5.5, T3: ≥5.6%), HDL-C in mmol/L (T1: <1.4, T2: 1.4–1.7, T3:≥1.8), TC in mmol/L (T1: <4.5, T2: 4.5–5.3, T3: ≥5.4), and TG in mmol/L (T1: <0.72, T2: 0.72–1.05, T3: ≥1.06). Education (low, middle, high) and smoking history (non-smokers, < 10, ≥10 packyears) were separately categorized in three levels; the others were treated as binary variables, namely age at menarche (≤ 13, > 13 years), menopause (yes/no), having biological children (yes/no), alcohol use (≤ 1, > 1 glasses per day), hormonal contraception (e.g., the pill, injection, or Mirena IUD; yes/no), diabetes (yes/no), hypertension (yes/no), and history of high cholesterol diagnosis (yes/no).
Statistical analyses
All data analyses were performed using R version 4.3.2. In the cohort prior to selection based on follow-up periods and complete metric data, several baseline variables had missing values. The missing rates were as follows: age at menarche (4.6%), menopausal status (19.4%), alcohol use (6.3%), smoking history (5.1%), education (1.8%), hormonal contraception use (12.5%), HDL-C (0.9%), TC (0.9%), TG (0.9%), HbA1c (1.4%), BMI (0.1%), and WHtR (0.1%). For variables with a missing rate < 10%, multiple imputations with a chained equation were used. If a missing rate was ≥ 10%, a separate category was designated for the missing values. But for menopausal status, baseline age at 50 was used as a proxy to determine the status for missing values [28]. Those aged < 50 were regarded as not stopping menstruation, while those aged ≥ 50 were regarded as stopping menstruation.
Descriptive statistics were reported as means with standard deviations (SD) or as counts with percentages. Baseline characteristics were compared between women with and without breast cancer and between the decrease/increase and no-change groups using Standardized Mean Difference (SMD) scores, excluding missing values. SMD quantifies the magnitude of baseline differences between two groups independent of sample size [29]. A notable difference between groups was defined as a positive SMD with a 95% confidence intervals (CIs) lower limit exceeding 0.1 or a negative SMD with an upper limit below − 0.1. This ensures a 95% likelihood that the effect size exceeds 0.1. SMD is used for descriptive purposes to indicate the effect size.
Cox proportional hazards models were conducted separately to test the associations of the mean ACs in BMI, WHtR, HbA1c, HDL-C, and TG with breast cancer occurrence. One model was for one metric of interest, and participants were further restricted to those who did not have missing values for that specific exposure at two assessments time points. We presented the results as adjusted hazard ratios (aHRs) with 95% CIs. The mean AC was included in models as a categorical variable with three groups: decrease, no change, and increase, with ‘no change’ being a reference category.
To understand the role of baseline values in the relation between mean AC and breast cancer risk, Model 1 only included age and baseline values of the metric of interest. Model 2 further included the mean AC of the metric. Model 3 was further adjusted for baseline values of other metabolism-related variables, in addition to Model 2. Model 4 (final model) was adjusted for diabetes, hypertension, dyslipidemia, age at menarche, menopausal status, biological children, alcohol, packyears, education, contraception in addition to Model 3. Since WHtR and BMI were both calculated with height, they were not adjusted simultaneously in the same model, and baseline BMI was used as the covariate in these models. The proportional hazards assumption was examined by the score test which revealed that age in tertiles and alcohol went against the assumption. Therefore, these two variables were treated as stratification factors in models.
To further understand the role of age, BMI and baseline values in the relation between mean ACs and breast cancer risk, subgroup analyses were conducted for these characteristics. Participants were grouped into two groups according to age at second measure at 50 years old, according to BMI at 25 kg/m2, and according to baseline values at medians. The medians for BMI, WHtR, HbA1c, HDL-C, TC and TG were 24.9 kg/m2, 0.5, 5.5%, 1.6, 5.0 and 0.87 mmol/L, respectively. Model 4 was run again in these subgroups, with baseline values of the exposure included as a continuous variable.
Invasive breast cancer exhibits more aggressive pathological features and carries a poorer prognosis compared to breast cancer in situ. To better understand how changes in these metrics are associated with invasive breast cancer specifically, a sensitivity analysis was conducted, restricting the outcome of interest to invasive cases only.


Comments (0)