Recruitment, randomization, and treatment groups
The MIND study is a three-year, two-site, randomized, controlled trial that evaluated the effect of the MIND diet intervention on changes in cognitive function and structural changes in the brain [19, 20]. From January 2017 through April 2018, 604 individuals aged 65 years and older with overweight or obesity (BMI ≥ 25), suboptimal diet quality (MIND score < 8 as based on a 14-item dietary screener), no cognitive impairment (MOCA > 22), and with a self-reported family history of Alzheimer’s dementia were enrolled in the trial. Participants were randomly assigned to follow the MIND diet with mild caloric restriction for weight loss (intervention) or their usual diet with the same mild caloric restriction for weight loss (control). The caloric restriction consisted of consuming 250 kcal less per day.
Dietary counseling was led by registered dietitians and provided by telephone to all participants at the same frequency. For the MIND diet group, it consisted of instructions on incorporating foods from the MIND diet and strategies to lose weight while keeping exercise levels the same as at baseline. The MIND diet intervention consisted of promoting 9 brain-healthy food groups (green leafy vegetables, other vegetables, nuts, berries, beans/legumes, whole grains, fish, poultry, extra-virgin olive oil) and limiting consumption of 5 unhealthy food groups (red and processed meats, fried foods, pastries and sweets, butter, and full-fat cheese). Dietary counseling for the control diet group was focused on calorie tracking, portion control, and behavioral strategies to lose weight without changing the types of foods consumed. At the end of the 3-year intervention, both groups experienced, on average, clinically meaningful weight loss (~5.2% weight loss from the baseline weight) [19].
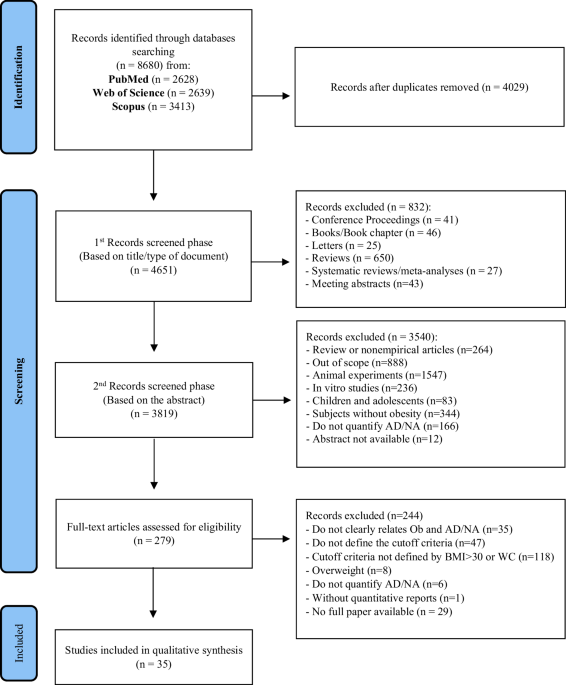
Of 604 individuals enrolled in the MIND trial, 520 had measured weight at the year 3 visit (i.e., study exit). From 520 individuals, we excluded 2 people with similar weight at year 3 compared to the baseline weight. Five hundred eighteen (n = 518) participants experienced weight changes (i.e., gained or lost weight) and, consequently, were included in the analysis. The baseline characteristics, including demographics, lifestyle factors, and genetics, of people included in the study (n = 518) from those excluded from the study (n = 86) were similar (p > 0.1), as shown in Supplementary Table 1.
Assessment of weight and calculation of weight loss
Using standard protocols, trained research staff measured body weight at the baseline, month 6, year 1, year 2, and year 3. We used data on participants’ weight at the baseline and end of the study/study exit (i.e., year 3) to calculate the 3-year weight loss percentage. To calculate the percentage weight change, we subtracted participants’ weight at year 3 (i.e., study exit) from their baseline weight, divided this difference by their baseline weight, and multiplied the result by 100. Based on the sample distribution and the trial goals for planned weight loss, as well as clinically meaningful weight loss, participants were categorized into four groups: those who did not lose weight (i.e., weight gainers), those who lost less than 5% of their baseline weight, those who lost between 5% and 10%, and those who achieved a weight loss of more than 10%.
Assessment of covariates
Age at baseline was computed by subtracting the date enrolled in the study from the birthdate. Race, sex, and education (years of formal schooling) were self-reported at the baseline visit. Apolipoprotein E gene (APOE) e4 allele was assessed via genetic testing. Physical activity was assessed through the Yale Physical Activity Survey, where participants reported time spent in activities, including brisk walking, calisthenics, cycling, and swimming [21]. Smoking status was self-reported, and participants were categorized as ever and never smokers. Dietary behavior and calorie intake were assessed by a validated food frequency questionnaire estimating how often, on average, a participant had consumed specified amounts of foods during the previous year. The diet quality was determined using the Mediterranean-DASH Diet Intervention for Neurodegenerative Delay (MIND) diet score [22, 23]. Body mass index (BMI) was calculated based on weight and height at the baseline. Medication use was self-reported. We specifically considered diabetes medications, including metformin and insulin, as well as statin medications for dyslipidemia, such as Lovastatin, Pravastatin Sodium, Rosuvastatin Calcium, Simvastatin, and Atorvastatin. Hypertension was defined as being told by a healthcare provider that he/she had high blood pressure or hypertension or being advised by a healthcare provider to take medication for high blood pressure.
Assessment of lipid biomarkers, inflammation, and glucose regulation
Traditional lipid biomarkers included high-density lipoprotein (HDL), low-density lipoprotein (LDL), triglycerides, and total cholesterol. Total cholesterol and triglyceride concentrations were measured using the Beckman Coulter Cholesterol reagent on the Beckman Coulter AU5800 series automated chemistry analyzer. HDL cholesterol concentration was determined after precipitating all apoB-containing lipoprotein particles [intermediate density Lipoprotein (IDL), low-density lipoprotein (LDL), and lipoprotein (a)] using 50 kDa dextran sulfate with magnesium ions (MgCl2) as the precipitation agent. Cholesterol was then measured in the supernatants only containing HDL particles using the Beckman Coulter cholesterol reagent. LDL cholesterol was calculated using the Friedewald formula: LDL cholesterol = Total Cholesterol – HDL cholesterol – (triglycerides/5) [24].
Biomarkers of inflammation included high-sensitive C-reactive protein (hs-CRP), high-sensitive Interleukin-6 (hs-IL6), GlycA, and adiponectin. Measurements of hs-CRP were performed using Siemens reagent on a Siemens BN2 nephelometer. Measurements of hs-IL6 were performed by a sandwich ELISA method using a monoclonal antibody specific for IL6 as a capturing antibody and a biotinylated polyclonal antibody specific for IL6 as a detecting antibody (R&D Systems Quantikine kit). GlycA was assessed in serum via the Nightingale Health platform using established protocols, as described previously [25, 26]. GlycA was assessed in serum via the Nightingale Health platform using established protocols, as described previously [25, 26]. Briefly, GlycA is a composite biomarker of systemic inflammation that reflects both acute and chronic inflammatory states. Elevated GlycA levels have been associated with subclinical atherosclerosis and an increased risk of cardiovascular disease [27]. Total adiponectin concentration was measured by Enzyme-Linked Immunosorbent Assay (ELISA) using Quantikine® Human Total Adiponectin/Acrp30 ELISA Assay kit (DRP300) by R & D Systems.
Hemoglobin A1c (HbA1c) was assessed by high-performance liquid chromatography (HPLC) using the Tosoh G8 automated glycohemoglobin analyzer.
All these biomarkers were assessed in blood samples collected after overnight fasting and stored in −80 °C freezers at each clinical trial site until shipment to the Northwest Lipid Metabolism and Diabetes Research Laboratories at the University of Washington and Medpace Reference Laboratories, for measurements of total cholesterol, HDL cholesterol, triglycerides, hs-CRP, hs-IL6, adiponectin, and HbA1c. Measurement of GlycA was performed by Nightingale Health Laboratories.
Statistical Analysis
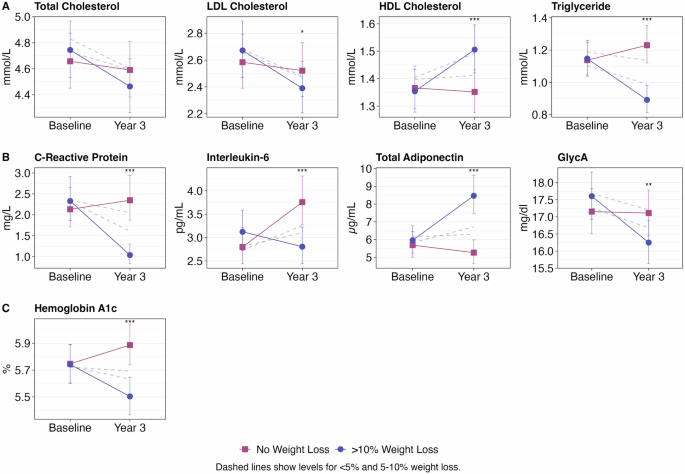
Characteristics of the study participants are summarized as mean and standard deviation (SD), median and interquartile [IQR], or as number (n) and percentages (%) of participants. Linear mixed-effect models with a random intercept were used to estimate the association of weight loss with 3-year changes in biomarkers of cardiometabolic health, including traditional lipid biomarkers, markers of inflammation, and glucose regulation. The proportion of weight loss at year 3 (i.e., study exit) relative to baseline (i.e., study entry) was evaluated as a categorical variable with people who did not lose weight as reference category. Other weight loss categories included those who lost less than 5% of their weight, those who lost between 5% and 10%, and those who achieved a weight loss of more than 10%. Biomarkers of cardiometabolic health were log10 transformed to normalize the distribution. To simplify the interpretation, we back-transformed the beta coefficients (i.e., 10beta) into relative differences. The relative difference can be interpreted as a percentage lower (negative value) or higher (positive value) in cardiometabolic biomarkers attributed to the weight loss categories [28]. In addition, to enable clinical interpretation of our findings, we calculated the means of these biomarkers at the baseline and year 3 by each category of weight loss. Models were adjusted by age (years), sex (male vs. female), race (White vs. non-White), education (years), APOE e4 carriership (yes vs. no), body mass index (kg/m2), physical activity (hours/week), smoking history (never vs. ever), MIND diet score (points), and dietary assignment (MIND diet group vs control diet group).
We conducted several sensitivity analyses to test the strength of the associations between weight loss groups and cardiometabolic biomarkers. First, we excluded people who did not lose weight (i.e., weight gainers) as nonadherent to the trial interventions. In this analysis, the reference category was the group of people with a weight loss of less than 5%. In addition, by changing the reference category to those who lost less than 5% and comparing people with weight loss 5–10 and >10%, we address the question of whether clinically meaningful weight loss (i.e., >5%) [29] is necessary for improving cardiometabolic health. Second, we investigated the influence of caloric restriction on the association between weight loss and cardiometabolic health. Individuals who substantially reduce their calorie intake are more likely to achieve greater weight loss. Therefore, to address whether the association of weight loss with cardiometabolic health is attributed exclusively to caloric restriction, we conducted an additional sensitivity analysis by adjusting our models for total calorie intake at baseline and year 3. Third, we evaluated the role of medication, specifically statin use for dislipidemia and metformin and insulin use for diabetes treatment, by adjusting the multivariable model with medication at the baseline and year 3 and evaluating the association of weight loss with biomarkers of cardiometabolic health. Fourth, we adjusted the multivariable model by the laboratory (i.e., Medpace and the University of Washington) to evaluate whether potential variations in lab settings could influence our results—despite the same investigator directed measures of these biomarkers in both laboratories. Lastly, we examined the role of intervention (MIND diet vs. control diet) in associations of weight loss with cardiometabolic health by assessing the significance of the interaction between weight loss and dietary intervention in association with 3-year changes in cardiometabolic biomarkers.
Analyses were performed using R statistical computing, version 4.4.1 (R Foundation for Statistical Computing, Vienna, Austria) [30].
Study protocol approval and patient consent
The institutional review board of Rush University Medical Center, Harvard School of Public Health, and Brigham and Women’s Hospital approved the MIND study protocol and all participants provided written informed consent.


Comments (0)