
Remember me

Fifty-four right-handed healthy participants (28 females; age range: 19–26 years; mean age: 22.44 years; SD: 1.66) from the University of Electronic Science and Technology of China were recruited. All participants had normal or corrected-to-normal vision, were free from color blindness, and had no history of neurological or psychiatric disorders. Written informed consent was obtained from all participants, who also received financial compensation. The study was approved by the Ethics and Human Protection Committee of the University of Electronic Science and Technology of China (UESTC) and was conducted in accordance with the Declaration of Helsinki.
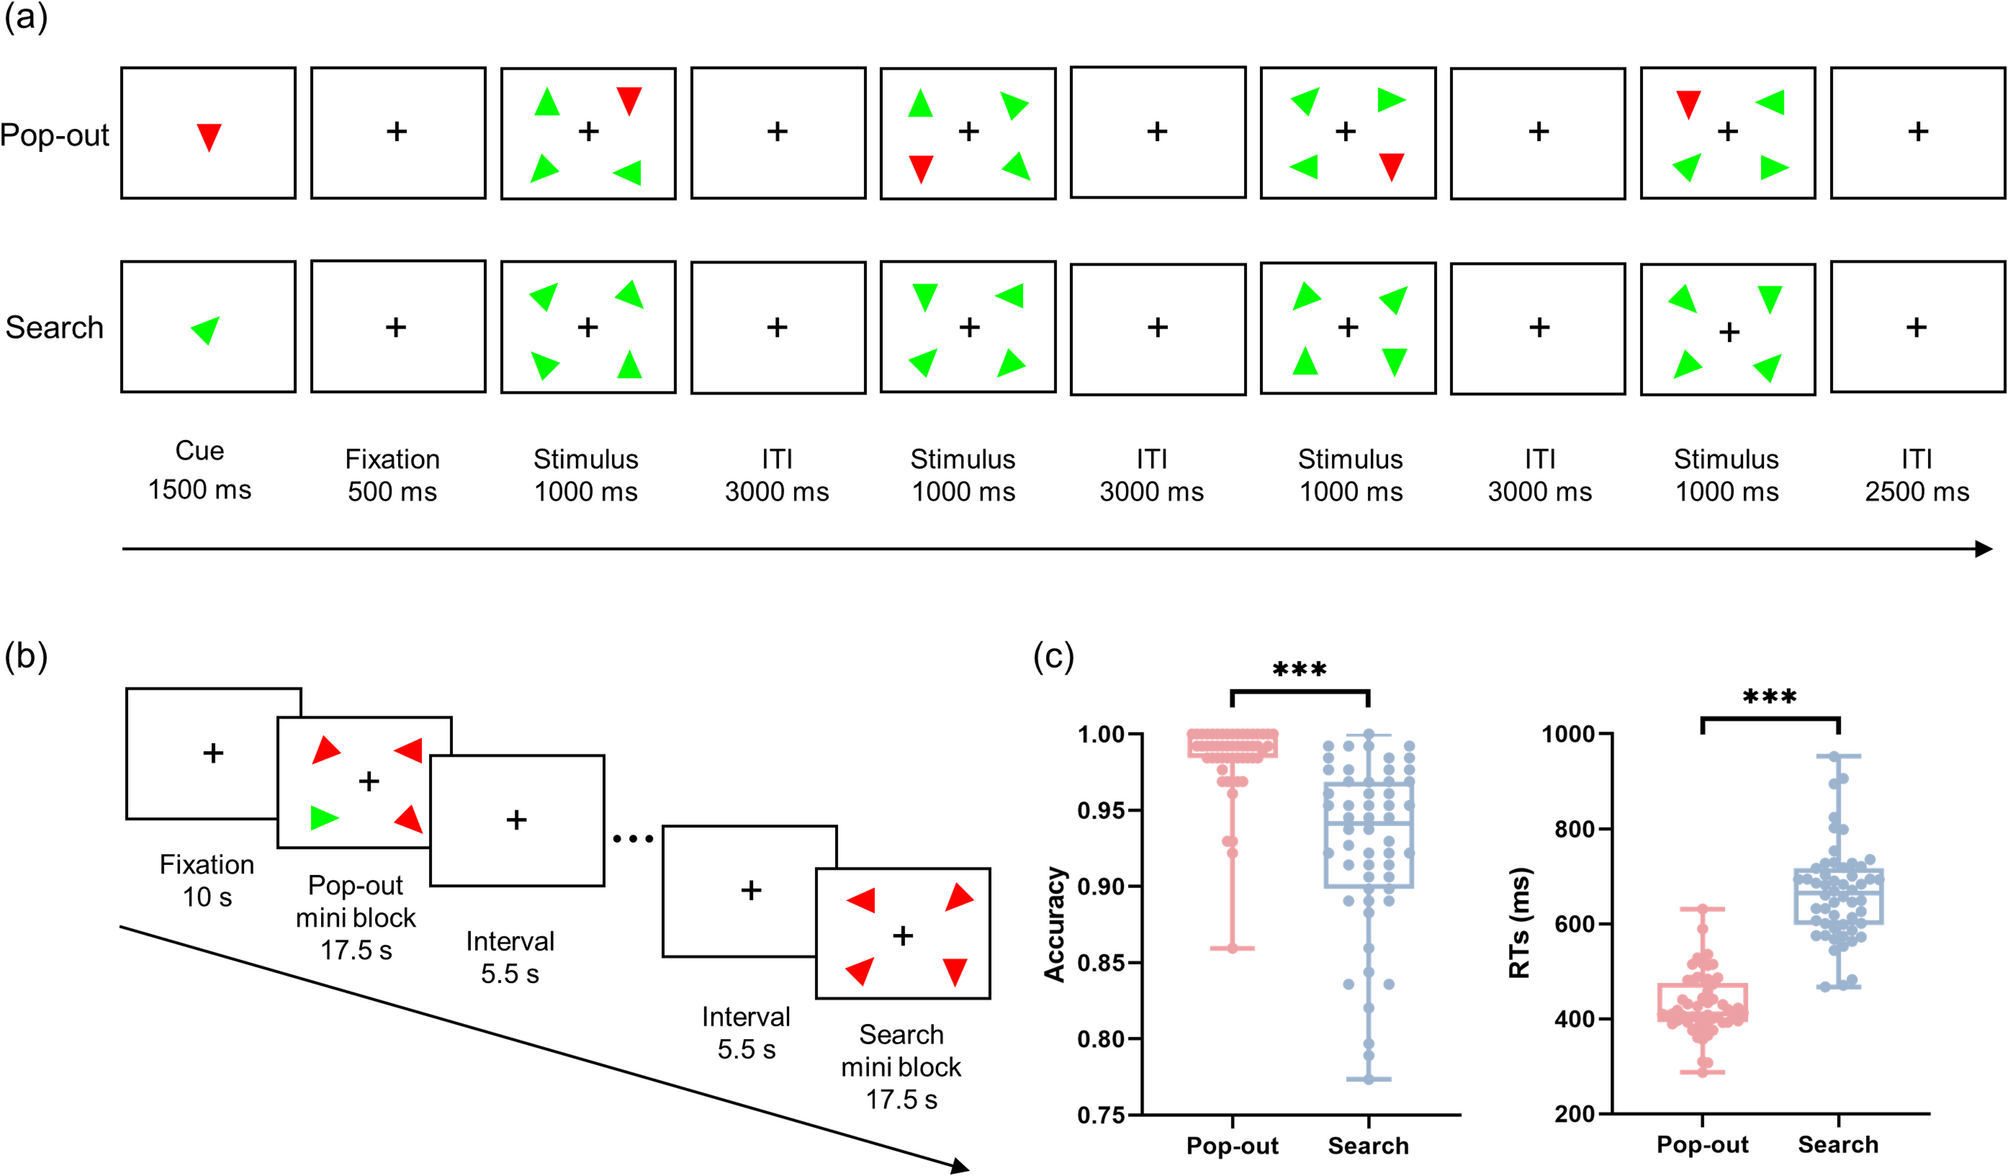
Design and procedureThe stimuli consisted of isosceles triangles presented in two colors (red and green) and eight orientations (0°, 45°, 90°, 135°, 180°, 225°, 270°, and 315°). Based on the task designed by a previous study [7], in the pop-out task, the target and distractor differed in both color and orientation, whereas in the search task, the target and distractors shared the same color but differed in orientation. Each mini-block started with a 1500 ms cue, during which participants were instructed to memorize the target’s color and orientation. This was followed by the presentation of the fixation for 500 ms. Immediately after, the stimulus was presented for 1000 ms, followed by a 3000 ms inter-trial interval (ITI) (Fig. 1a). The four isosceles triangles were displayed in the upper-left, lower-left, upper-right, and lower-right positions relative to the fixation (i.e., one target and three distractors). Participants pressed the ‘2’ key (left hand) for targets on the left side of fixation, and the ‘6’ key (right hand) for targets on the right side. At the beginning of the formal scanning session, a 10 s blank fixation was displayed. Each mini-block lasted 17.5 s and was separated by a 5.5 s interval (Fig. 1b). The formal experiment began after participants completed 16 practice trials. Each mini-block comprised four trials. The experiment consisted of four runs, in total 64 mini-blocks and 256 trials (128 trials for each task: pop-out and search tasks). The E-prime 2.0 (Psychology Program Tools, Pittsburgh, USA) was used to present stimuli and record behavioral data.
Behavioral data analysisAccuracy was calculated as the average proportion of correct responses. Trials with correct responses and reaction times (RTs) within the 3 standard deviations (SD) from the mean were classified as valid. RTs were then computed as the average of these valid trials. Normality was assessed using Shapiro-Wilk tests and Q-Q plots. The results indicated non-normal distributions for accuracy in both tasks (pop-out: W = 0.625, p < 0.001; search: W = 0.905, p = 0.004) and for pop-out RTs (W = 0.944, p = 0.013), while search RTs were normally distributed (W = 0.959, p = 0.061), with Q-Q plots confirming these patterns (Table S1 and Fig.S1). We used a nonparametric Wilcoxon signed-rank test to analyze the behavioral performance differences between the pop-out and search tasks. Behavioral data were analyzed using SPSS 20 software (IBM Corp., Armonk, NY), and p < 0.05 was considered statistically significant.
fMRI data acquisition and analysisData acquisition and preprocessingMagnetic resonance imaging (MRI) data were acquired using a 3 T General Electric scanner (General Electric Medical System, Milwaukee, WI, USA). An 8-channel phased-array head coil and a standard echo planar imaging (EPI) sequence were employed to obtain functional images. The functional images were acquired with repetition time (TR) = 2000 ms, echo time (TE) = 30 ms, flip angle (FA) = 90°, field of view (FOV) = 240 × 240 mm², matrix size = 64 × 64, voxel size = 3.75 × 3.75 × 3 mm³, interleaved scanning with slice thickness = 3 mm, no gap, and 43 slices. Four runs were performed, with each run acquiring 187 whole-brain images, resulting in a total of 748 whole-brain images. Additionally, T1-weighted structural images were acquired with TR = 5.9 ms, TE = 1.9 ms, TI = 450 ms, FOV = 256 × 256 mm², FA = 9°, matrix size = 256 × 256, slice thickness = 1 mm, no gap, voxel size = 1 × 1 × 1 mm³, and 176 slices.
Preprocessing was performed using the DPARSF package within MATLAB software. First, the initial five time points of each run were removed to account for magnetic field instability. Subsequently, the remaining images underwent slice timing correction and motion correction. T1-weighted structural images were coregistered to functional images, normalized to MNI space using the DARTEL algorithm, and resampled to a voxel size of 3 × 3 × 3 mm³. Finally, spatial smoothing was applied to the normalized functional MRI (fMRI) images using an 8 mm full-width-at-half-maximum (FWHM) Gaussian smoothing kernel to reduce noise and enhance signal contrast. Beta images smoothed at 8 mm FWHM were utilized for univariate and gPPI analyses, whereas unsmoothed data were used for MVPA. For MVPA, unsmoothed data can maximize the spatial pattern information for decoding, whereas excessive spatial smoothing may reduce decoding accuracy by blurring discriminative voxel-wise patterns [42,43,44,45].
Univariate analysisUnivariate analysis was conducted to examine the activation patterns associated with the two attention processes, aiming to determine whether the right DLPFC and the right SPL are involved in both top-down and bottom-up attention. We conducted whole-brain, ROIs, conjunction, and inclusive masking analysis.
The activations in the four conditions (pop-out, search, pop-out > search, search > pop-out) were analyzed using whole-brain analysis with SPM12 software. In the first-level analysis, we modeled individual-level brain activation by constructing a general linear model (GLM) for each participant. The design matrix consisted of four runs, with each run containing eight regressors. Two regressors represented the pop-out task and the search task, respectively. Additionally, six head motion parameters were included as covariates of no interest, comprising three translational and three rotational parameters. These regressors were convolved with the canonical hemodynamic response function (HRF) to account for the delay and dispersion of the blood oxygenation level-dependent signal (BOLD) response. A high-pass filter with a cut-off frequency of 1/128 Hz was applied to remove low-frequency noise. Contrast analyses were performed to examine individual activations for the pop-out > search and search > pop-out conditions. In the second-level analysis, we conducted a group-level analysis of activation using a one-sample t-test.
For univariate ROI analyses, we first constructed 6-mm spherical ROIs centered on the right DLPFC (MNI: 39, 39, 30) and SPL (MNI: 27, − 66, 51) using MarsBar software. Beta values were extracted for the pop-out, search, and search > pop-out contrast. Shapiro-Wilk tests and Q-Q plots indicated that the beta values of both ROIs in pop-out and search conditions violated normality assumptions (right DLPFC in the pop-out: W = 0.934, p = 0.005; right SPL in the pop-out: W = 0.82, p < 0.001; right DLPFC in the search: W = 0.955, p = 0.04; right SPL in the search: W = 0.931, p = 0.004) (Table S1 and Fig. S1). Although the right DLPFC beta values for search > pop-out passed normality testing (right DLPFC in the search > pop-out: W = 0.99, p = 0.935), the SPL did not (right SPL in the search > pop-out: W = 0.892, p < 0.001). Consequently, we employed non-parametric Wilcoxon signed-rank tests to compare the ROIs’ differences.
A conjunction analysis was performed to identify brain regions commonly activated by both the pop-out and search tasks. For inclusive masking analysis, the search > pop-out contrast was inclusively masked with search task activity to restrict results to regions showing a task-positive search effect while excluding areas where significance might come from pop-out task deactivation. Similarly, the pop-out > search contrast was inclusively masked with pop-out activity to specifically identify pop-out-enhanced regions while avoiding search task deactivation effects. Previous studies have found that difficult tasks with higher cognitive demands engage the multiple demand network (MDN), which extends over a wide range of the fronto-parietal network and default mode network, compared to simple tasks [46,47,48]. It includes regions such as the lateral prefrontal cortex, intraparietal sulcus, anterior cingulate cortex, and anterior insula, which collectively support adaptive control during complex tasks. Given the difference in difficulty between the pop-out and search tasks, we specifically examined whether the search > pop-out contrast would engage MDN. The whole-brain analysis was corrected for multiple comparisons using family-wise error (FWE) at the voxel level (p < 0.05), with a minimum cluster size of 20 voxels.
In the current univariate analysis, the specific functional contributions of regions remain unclear. Therefore, we selected the right DLPFC (right DLPFC (MNI: 39, 39, 30) and SPL (MNI: 27, − 66, 51) ROIs from our previous study [41] for ROI, MVPA, and gPPI analyses. For univariate analysis, we first verified that both coordinates fell within the activated clusters of the search > pop-out contrast. As they were included, we then used these DLPFC and SPL clusters from the contrast as ROIs for MVPA. For gPPI analysis, we created spherical ROIs (6-mm radius) centered on these same DLPFC and SPL coordinates.
Multivariate pattern analysis (MVPA)MVPA was used to assess whether the activity patterns within the right DLPFC and right SPL could distinguish between top-down and bottom-up attention. MVPA was conducted using preprocessed beta images that underwent slice timing correction, motion correction, spatial normalization to the MNI template, and no spatial smoothing. Since the pop-out and search tasks differ in difficulty, we included RTs from all trials as covariates in the GLM to control for potential confounding effects of task difficulty on neural decoding. A GLM was conducted for each participant based on trials to estimate the BOLD responses associated with 264 regressors using SPM12 software. The GLM included 128 regressors corresponding to the 128 trials of the pop-out task, 128 regressors corresponding to the 128 trials of the search task, six head motion regressors (three translational and three rotational regressors), an RTs regressor, and a constant regressor. In the GLM analysis, the BOLD responses associated with each regressor were convolved with the canonical HRF to account for the temporal delay and dispersion of the BOLD response. Additionally, high-pass filtering with a cut-off frequency of 1/128 Hz was applied to the data and model for each participant to remove low-frequency noise. For each participant, 256 beta images were generated, including 128 beta images corresponding to the pop-out task and 128 beta images corresponding to the search task. These beta images reflect the trial-by-trial BOLD signal changes under different tasks and provide the basis for the subsequent MVPA.
We performed MVPA classification on the beta images generated from the GLM analysis using the Nilearn toolbox [49] within Python to investigate whether the activity in the right DLPFC and right SPL can differentiate between pop-out and search tasks. The study consisted of whole-brain searchlight and ROI-based analysis of the right DLPFC and SPL.
For the whole-brain searchlight analysis, we first defined a 5 mm radius sphere as the searchlight region in the brain. The beta images, analyzed using a whole-brain mask and the GLM, were labeled (pop-out task as 0 and search task as 1) and merged, with all non-finite values (NaN and Inf) replaced by 0. We then implemented a support vector machine (SVM) classifier with a radial basis function (RBF) kernel, applying class balancing to address potential sample size bias. The classifier was evaluated using 10-fold cross-validation (single repetition) to assess model generalizability, producing whole-brain accuracy maps for each participant. At the group level, we combined searchlight results across all participants and performed a bootstrap of 10,000 times to compute voxel-wise mean accuracy values. The p-values were computed by comparing the raw means with the means derived from the bootstrap distribution, and these p-values were corrected for multiple comparisons using the false discovery rate (FDR) with p < 0.05. The thresholded statistical maps were visualized using glass brain plots.
For the ROIs-based analysis, we first identified the right DLPFC and SPL as ROIs based on our univariate activation results. After labeling the beta images (0 for the pop-out task and 1 for the search task) and merging them, we replaced any non-finite values (NaN or Inf) with 0 for data quality control. Using an RBF SVM classifier, we performed 10-fold cross-validation with 100 repetitions to obtain robust classification accuracy estimates. The normality of the accuracy distributions was then assessed using Shapiro-Wilk tests and quantile-quantile (Q-Q) plots. Finally, we statistically compared the classification performance between these two ROIs to evaluate their differential involvement in task discrimination. Shapiro-Wilk tests and Q-Q plots indicated that classification accuracy was normally distributed in the right DLPFC (W = 0.958, p = 0.055) but not in the right SPL (W = 0.939, p = 0.008) (Table S1 and Fig. S1). Given the non-normality in the SPL accuracy, a Wilcoxon signed-rank test was used to compare the classification accuracy of the two ROIs.
Generalized psycho-physiological interaction (gPPI) analysisThe gPPI is a method for studying dynamic changes in functional connectivity between brain regions by constructing psychophysiological interaction terms in each condition [50]. To assess how the functional connectivity of the right DLPFC and the right SPL changes in top-down and bottom-up attention, we conducted gPPI analyses using SPM8 and the MarsBaR toolbox. We hypothesized that the functional connectivity of the right DLPFC and the right SPL seed regions would be different between the pop-out and search tasks and that these changes in functional connectivity would be correlated with task performance (e.g., RTs).
The first step involved constructing the seed regions and extracting the time series. Using MarsBaR software, we defined spheres centered at the right DLPFC right DLPFC (MNI: 39, 39, 30) and SPL (MNI: 27, − 66, 51), with a radius of 6 mm for each seed region. Based on the GLM model with univariate analysis, we extracted the average time series of the BOLD signal from the seed regions. In the second step, we constructed gPPI GLM models for each participant. For the first-level analysis, a GLM was constructed for each of the four runs. In the model of each run, 11 regressors included two task condition regressors (pop-out and search tasks), one seed region time series regressor (right DLPFC or right SPL), two interaction regressors (gPPI_pop-out and gPPI_search) representing the psychophysiological interactions, and six head motion regressors. The gPPI_pop-out and gPPI_search interaction reflects the dynamic changes in functional connectivity between the seed regions and other regions under tasks. These regressors were convolved with the HRF. After model estimation, we focused on the interaction effects of the search and pop-out tasks. The third step involved analyzing the psychophysiological interaction effects at the group level. For the second-level analysis, we performed a one-sample t-test to assess group-level effects, applying FDR correction (p < 0.05) and a cluster size threshold of 20 voxels. In the fourth step, we assessed the relationship between functional connectivity and selective attention task performance. We extracted the parameter estimates (beta values) of functional connectivity and conducted a correlation between these beta values and RTs in the pop-out and search tasks.
Normality assessment using Shapiro-Wilk tests and Q-Q plots (Table S1 and Fig.S1) revealed that while RTs in the pop-out task violated the normality assumption (W = 0.944, p = 0.013), those in the search task were normally distributed (W = 0.959, p = 0.061). Consequently, we employed Spearman’s correlation for analyzing pop-out task RTs and Pearson’s correlation for search task RTs in relation to functional connectivity. Further analysis showed normally distributed connectivity between right DLPFC and right insula (MNI: 33, 21, − 6; W = 0.96, p = 0.066) as well as between right SPL and bilateral SPL regions (MNI: −27, − 57, 51, W = 0.968, p = 0.158; MNI: −18, − 66, 54, W = 0.976, p = 0.333) and right precentral gyrus (MNI: 33, − 3, 45; W = 0.987, p = 0.842), whereas DLPFC-left SPL connectivity (MNI: −27, − 45, 45) showed non-normal distribution (W = 0.913, p = 0.001).
Fig. 1
Experimental procedure and behavioural results. a A mini block of the pop-out task and the search task. The targets and distractors had different orientations. In the pop-out task, the color of the target is different from distractors, with the target being salient. In the search task, the target and the distractors were the same color. Participants discriminate the hemifield of the target (left or right). A mini-block consists of four trials. ITI: trial inter-trial interval. b The process of fMRI scanning. c Accuracy and RTs of the pop-out and the search tasks. Individual participants are indicated by dots. RTs: reaction times. *** p < 0.001
Comments (0)