
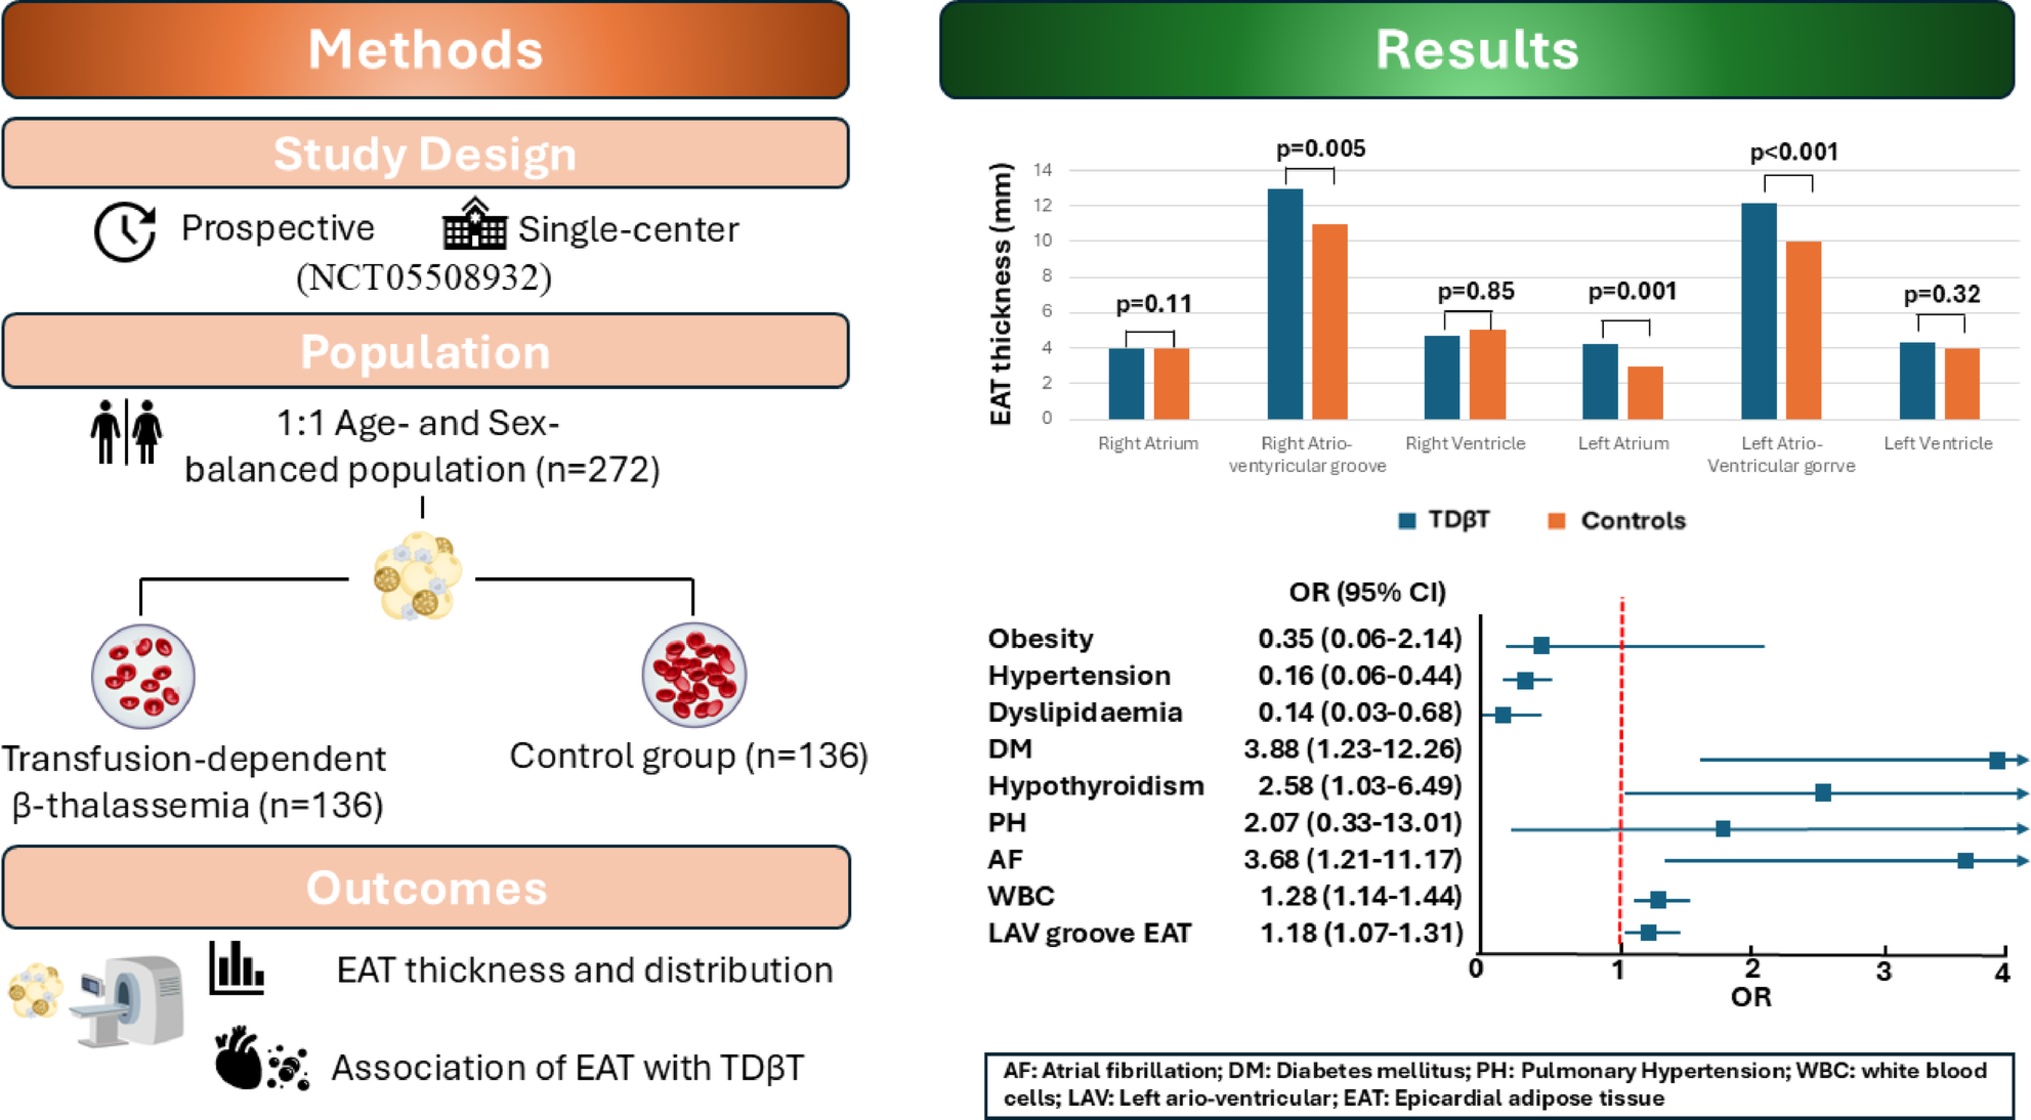
Remember me


We conducted a retrospective analysis of data obtained as part of a prospective single center cohort study of patients with TOF who underwent complete repair at Children’s Hospital of Philadelphia (CHOP) between September 2016 and September 2019. Children who underwent palliative procedures prior to complete repair (e.g.: placement of an aorto-pulmonary shunt or stent in the ductus arteriosus) were also included. The study cohort has been previously described [2, 13, 14]. We included patients with preoperative biomarker measurements. Subjects without any postoperative echocardiograms were not included in the mixed-effects models because they provide no information on outcome trajectories therefore were excluded. Complete TOF repair was defined as closure of the ventricular septal defect (VSD) with relief of RV outflow tract obstruction when necessary. We excluded patients who completed the TOF repair after two years of age.
The study protocol was approved by the Institutional Review Board of Protection of Human Subjects at Children’s Hospital of Philadelphia (CHOP) IRB: 23–021676, and the parents of the subjects provided informed consent to participate in the study.
Clinical dataClinical variables including demographic and perioperative characteristics, cardiac history, and operative variables were abstracted from the medical records and available for analysis.
BiomarkersSeven biomarkers were measured based on published data in children and adults with congenital heart defects: Galectin-3, procollagen type-I carboxy-terminal propeptide (PICP), procollagen type-III amino terminal propeptide (PIIINP), matrix metalloproteinase 1 (MMP1), matrix metalloproteinase 9 (MMP9), soluble suppression of tumorigenicity 2 (sST2), and N-terminal pro B-type natriuretic peptide (NT pro-BNP) [3,4,5, 15]. Blood samples were obtained at the time of TOF repair before cannulation for cardiopulmonary bypass. sST2 was only collected in the first 46 patients. Fifty-six (74%) patients had PICP levels greater than the maximum level of detection (6400 ng/ml), thus a binary variable (high/low PICP) was created. High PICP was defined as >6400 ng/ml and low PICP was defined as < 6400 ng/ml.
Biomarker assaysSerum and EDTA plasma samples were processed and frozen at − 80 ◦C for further analysis by the biomarker core laboratories from the Translational Core at CHOP for NT-proBNP, Galectin-3, sST-2, MMP-1, and MMP-9. Biomarkers were assayed using commercially available reagents by personnel who were blinded to clinical status.
Galectin-3 was measured in triplicate on the ELLA system. The average coefficient of variation (CV) was 1.68% (range 0.18–9.59%, n = 133). Inter-plate CV was 1.24% for QC1 (mean = 26.3 pg/ml, range = 22.3–37.2 pg/ml) and 2.10% for QC2 (mean = 1322 pg/ml, range = 1195–1992 pg/ml).
MMP-1 and MMP-9 were measured using a 2-plex kit also from MSD (Cat#: K15034C-2). Samples were tested in duplicate and the mean CV was 3.48% for MMP1 and 3.47% for MMP9 (range MMP1 = 0.17–9.80%, range MMP9 = 0–9.84%; n = 133). Inter-plate CV for QC1 was 8.43% for MMP-1 (mean = 89.3 pg/ml, range = 75.0–125 pg/ml) and 9.43% for MMP-9 (mean = 508 pg/ml, range = 375–625 pg/ml); for QC2 the inter-plate CV was 6.19% for MMP-1 (mean = 918 pg/ml, range = 750–1250 pg/ml) and 1.42% for MMP-9 (mean = 4565 pg/ml, range = 3750–6250 pg/ml); the inter-plate CV for QC3 was 6.57% for MMP-1 (mean = 9232 pg/ml, range = 7500–12,500 pg/ml) and 6.04% for MMP-9 (mean = 41,326 pg/ml, range = 37,500–62,500 pg/ml). Soluble ST2 was measured using the ELLA Automated Immunoassay System (Protein Simple; San Jose, California). Samples were tested in triplicate, and the mean CV was 1.91% (range = 0.21–7.56%, n = 133). Inter-plate CV was 0.60% for QC1 (mean = 365 pg/ml, range = 254–423 pg/ml) and 1.46% for QC2 (mean = 14,285 pg/ml, range = 12,679–21,131 pg/ml).
NT-proBNP was measured using kits (Cat#: K151JKC-2) from the Meso Scale Discovery (MSD; Rockville, Maryland). Samples were tested in duplicate and the mean CV was 5.43% (range = 0.01–9.90%, n = 138). Inter-plate CV was 7.21% for QC1 (mean = 11.4 pg/ml, range = 7.50–12.5 pg/ml), 6.52% for QC2 (mean = 89.3 pg/ml, range = 75.0–125 pg/ml), and 4.93% for QC3 (mean = 997.5 pg/ml, range = 750.0–1250 pg/ml).
EchocardiogramsRV strain was measured from echocardiograms obtained during the typical yearly routine outpatient visit using uncompressed data. We examined up to five years of follow-up data per patient. Images closest to the year mark were selected and considered suitable if the entire RV (free wall, apex and septum) were within the frame for at least one complete cardiac cycle on apical four chamber images, and if the frame rate was between 50 and 95 frames/second (Fig. 1). Covariates “RV dilation” and “pulmonary stenosis” were defined by an end-diastolic area (EDA) Z-score > 2, and as a peak velocity across the pulmonary valve > 2.5 m/s respectively. Echocardiograms with measurable strain images were available for 74% of patients in year 1, 60% in year 2, 44% in year 3, 48% in year 4, and 37% in year 5.
Fig. 1
Echocardiographic measurements. Echocardiographic four-chamber view. The RV endocardium was traced at end-diastole (A) and end-systole (B) (Yellow boundaries)
RV longitudinal peak systolic strain (RVLS), free wall longitudinal peak systolic strain (FWS), RV peak systolic strain rate (SR) and free wall peak systolic strain rate (FWSR) were assessed tracing the endomyocardium with speckle tracking analysis using TomTec software (Cardiac Performance Analysis, TomTec, Germany) by a single observer (JAG). Tracings were generated automatically by the software and subsequently adjusted manually for optimal tracking. Prior to initiating data collection, intra-reader reliability was assessed using intraclass correlation coefficients (ICC) derived from two measurements across 10 distinct samples. Subsequently, inter-reader reproducibility was evaluated using ICC based on 10 randomly selected samples measured independently by a second observer (RN). For ease of interpretation, worsening RV function was defined as a decrease in the absolute value of strain (typically a negative value), and improvement in function as an increase in the absolute value of strain.
Statistical analysisDescriptive statistics were calculated as frequency counts and percentages for categorical variables and mean ± standard deviation (SD) or median and interquartile range (IQR) for continuous variables. The preoperative biomarkers constituted the exposure of interest, and outcomes were strain measures over time. Covariates and potential confounders included patient and surgical factors, including type of TOF surgical repair and presence of a genetic syndrome.
Associations between exposures and outcomes were analyzed with univariable and multivariable linear regression models with Generalized Estimating Equations (GEE). Multivariable linear mixed-effects (LME) models were run as sensitivity analyses. The primary models were used to test whether preoperative biomarkers were associated with the postoperative strain measures using up to 5 years of follow-up echocardiographic measurements per patient. Each of the four strain outcomes (RVLS, FWS, SR, and FWSR) was analyzed in regression models with each biomarker, time of measurement, and preoperative strain as covariates. First, preoperative strain and time were used as covariates to explore the relationship of biomarkers with postoperative function, unadjusted for patient covariates (GEE Model 1). Then we added clinically important covariates which could be potential confounders in the adjusted model (GEE Model 2) including included type of TOF repair (transannular patch, RV to pulmonary artery conduit, non-transannular patch, VSD closure only) and diagnosis of a genetic syndrome.
To correctly specify the correlation structure for the GEE and LME models, we tested with four correlation structure functions, including: autoregressive, exchangeable, independence and unstructured. We chose the correlation structure with the lowest Quasi-likelihood under Independence Model Criterion (QIC value). We calculated the false discovery rate using the Benjamini-Hochberg procedure to account for all biomarker-outcome models, though we ran these models four different ways: (1) fixed effects unadjusted for patient covariates, (2) fixed effects adjusted for patient covariates, (3) GEE regression model and (4) LME regression model to check the conclusions reached by the primary models.
For the biomarkers with an identified linear relationship with the strain outcome, we also checked for nonlinear associations by fitting restricted cubic splines with three knots at percentiles of the biomarker distribution. We checked to see if the nonlinear model fit the data better than the linear model using goodness of fit statistics (e.g. QIC and QICu). We found significant nonlinear associations between MMP1 and RVLS, but the goodness of fit statistics were lower for the linear model than the model with restricted cubic spline terms, indicating that the linear model was preferrable for MMP1. No other significant nonlinear associations between biomarkers and strain were identified.
Additional analysesWe used the same statistical methodology to assess changes in strain over time using time as the exposure instead of preoperative biomarkers. We ran linear regression models with GEE to test if there were a categorical effect of each post-repair year compared to the first-year data.
In sensitivity analyses, we assessed whether time-dependent variables—right ventricular (RV) dilation and residual pulmonary stenosis—might impact the relationship between biomarkers and strain. To minimize bias from time-dependent variables, we applied the framework by Burcu & Oehrlein [16] and adjusted separately for the presence of RV dilation and pulmonary stenosis in the multivariable GEE models (Online supplement). Additionally, RV EDA Z-score (treated as a continuous variable) was not significantly associated with strain and was not included in final adjusted models. Full sensitivity model results are provided in the Online Supplement.
All analyses were performed using SAS Software version 9.4 (SAS Institute, Cary, NC). We considered a p-value of < 0.05 to be statistically significant. Given completeness of patient characteristics, there was no missing data imputation performed in this study.
Comments (0)