In the present study, heterogeneous density and hypodensities were found to be the NCCT markers that were most closely related to the dynamics of acute ICH. Heterogeneous density and hypodensities were the markers that best predicted the presence of active hemorrhage, although their performance was modest. Consistently, both heterogeneous density and hypodensities were related to a higher rate of hematoma expansion and decreased in frequency from baseline to follow-up NCCT after ICH stabilization. This decrease in frequency was higher in patients who presented active hemorrhage at baseline, supporting the value of these markers in reflecting different facets of the dynamic evolution of ICH.
NCCT markers were consistently related to ICH volume at baseline in the present study. However, ICH is a dynamic process, and hematoma expansion occurs in up to a third of ICH patients scanned within the first 6 h [23], yet the pathophysiological mechanisms of expansion remain poorly understood [6, 24]. While one model of hematoma expansion assumes ongoing bleeding for a single source, with expansion following the path of least resistance within and surrounding the hematoma, the most commonly accepted model is the so-called avalanche model [6, 8]. The avalanche model proposes that the initial vessel rupture is responsible for peripheral vessels sharing that rupture secondarily, resulting in a cascade of ruptures that maintain ongoing bleeding [8, 24, 25]. The spot sign is considered a marker of active hemorrhage [2, 23, 26, 27], specifically when detected in earlier acquisitions of CTA [3, 4]. Thus, we hypothesized that NCCT markers of hematoma expansion at baseline are related to the spot sign in phase 1 of multiphase CTA as a surrogate of active hemorrhage, and therefore, the presence of NCCT markers would decrease after ICH stabilization at follow-up NCCT, as found with heterogeneous density and hypodensities.
In the present study, mean and SD hematoma density at baseline were lower the earlier the patients were scanned. As proposed before and supporting the avalanche model, lower attenuating regions on NCCT would constitute more immature areas, and hyperattenuating regions would represent more stable areas since hematoma evolution causes extrusion of lower attenuating plasma, resulting in an even higher attenuation of the hematoma [6, 8]. Conversely, neither the presence of both heterogeneous density and hypodensities at baseline, nor the change in frequency from baseline to follow-up NCCT, was associated with a lower OIT. This reinforces the significance of these two markers at baseline in the present study, regardless of the time from symptom onset in patients scanned within the first 6 h. However, a larger multicenter study reported that their frequency may vary with OIT, even within 6 h, which may reflect differences in sample size and study design compared with the present study [28].
In contrast to other NCCT markers, the frequency of irregular shape was higher at follow-up NCCT than at baseline NCCT, despite the magnitude of the change between both NCCT scans not being related to the presence of active hemorrhage at baseline. This finding supports the hypothesis that irregular shape may reflect peripheral sites of secondary bleeding occurring at the border of the hematoma, rather than the primary source of bleeding, which is consistent with the avalanche model [6, 8, 11].
These findings have potential implications for the design of clinical trials guided by NCCT markers in patients with acute ICH [8]. Although it is thought that the different NCCT markers are actually capturing different manifestations of the same pathophysiological phenomenon [6, 14], heterogeneous density and hypodensities would be the best markers to consider, taking into account their association with different facets of the dynamic evolution of acute ICH. Furthermore, the evaluation of these two markers relies only on their visual appearance on NCCT, making them more clinically useful than quantitative density markers, black hole sign, and blend sign, which require of quantitative assessment of hematoma density [8, 9].
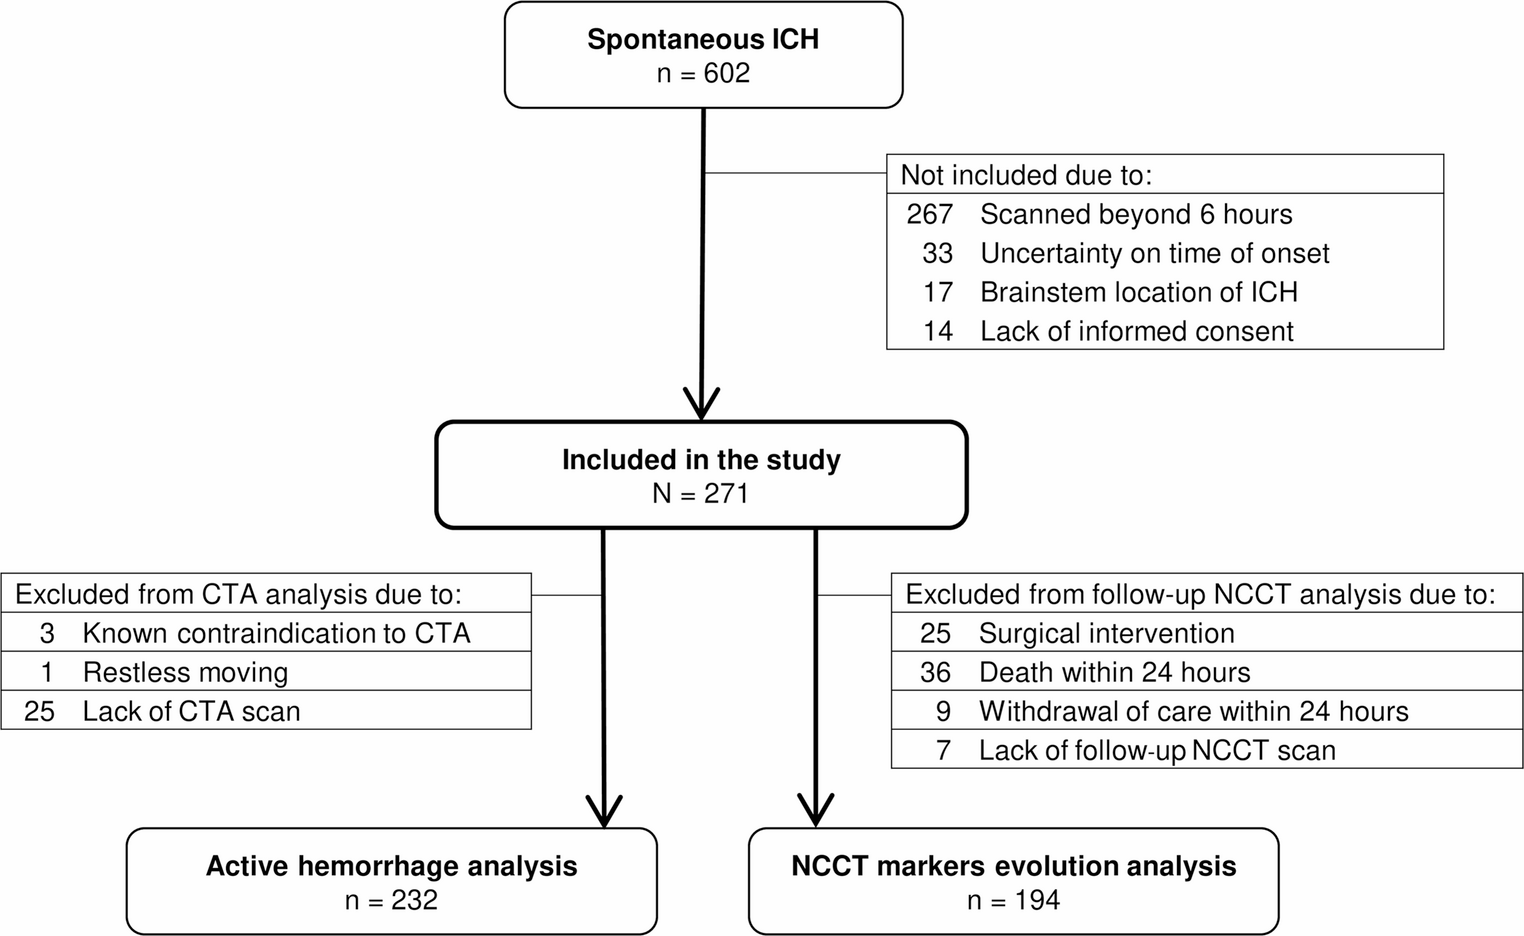
The strengths of this study include its prospective design, standardized neuroimaging protocol, evaluation of active hemorrhage, and standardized evaluation of NCCT markers evolution over time. The study also has some limitations, however. First, we included patients scanned within 6 h from symptom onset, what prevents the generalizability of findings to late presenters. Second, patients with uncertainty about the exact time from symptom onset were excluded, which may limit the generalizability of findings to all patients scanned within 6 h from symptom onset. Third, patients who underwent surgical hematoma evacuation or died before follow-up NCCT scan were excluded from the analysis of NCCT markers evolution, which could potentially introduce a selection bias. However, this exclusion was necessary because evaluating evolution of NCCT markers in such cases was not feasible. Fourth, we used the presence of a spot sign in phase 1 of multiphase CTA as a marker of active hemorrhage [3], but the exact pathology of the spot sign is not known, and it could represent more than just active hemorrhage. Fifth, a single rater assessed the presence of NCCT markers of hematoma expansion in the present study. However, interrater agreement was evaluated in 30 randomly selected patients by another rater and was found to be moderate-to-excellent, in line with what has been observed in previous studies [29, 30]. Sixth, markers such black hole sign, blend sign, and fluid level are infrequently or rarely found in ICH patients [16, 17, 31], which could imply that our sample size was relatively small to find associations between these markers and variables such as active hemorrhage. Finally, we did not specifically assess severe hematoma expansion, defined as an absolute increase of > 12 mL or a relative increase of > 66%, despite its recognized clinical impact [32].

Comments (0)