
Remember me
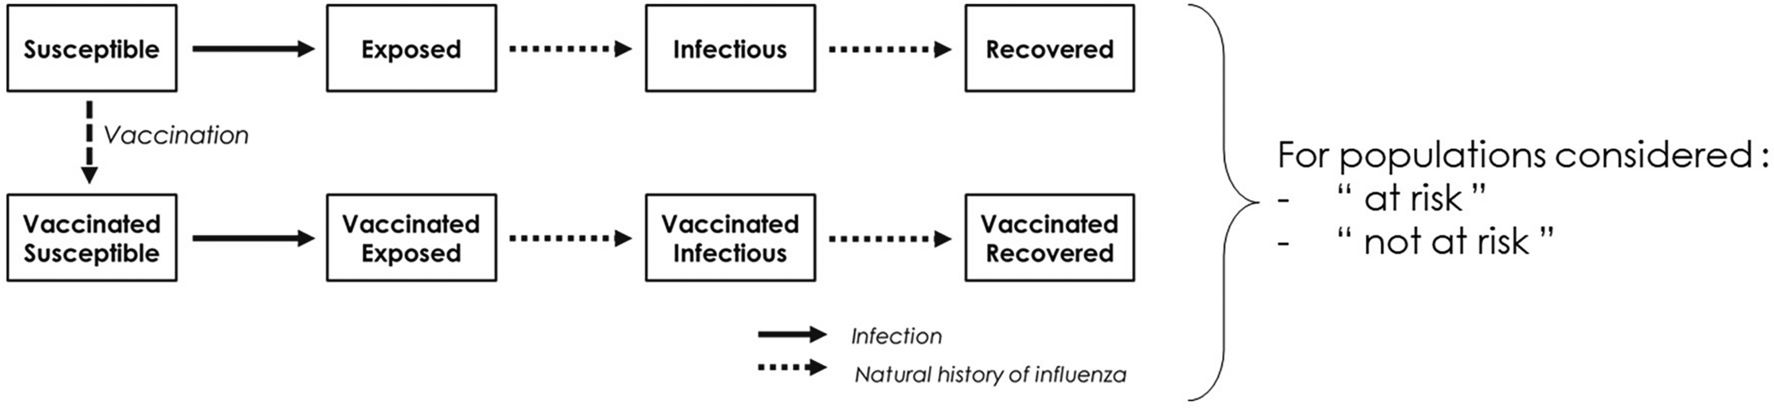


The CEA was structured in Microsoft Excel® (Redmond, WA, US) using a decision-analytic Markov (state-transition) cohort model. The Markov model estimated pneumococcal disease-related events in both unvaccinated and vaccinated individuals (Fig. 1). The model captured an individual’s possible transition to several clinical events, including IPD (developing into either meningitis or sepsis/bacteremia), all-cause pneumonia (non-hospitalized or hospitalized), all-cause OM, no pneumococcal disease state, and death. Death captured both general mortality and case fatality, which could occur in any disease state and non-disease state. The transition occurred on an annual cycle and was age- and vaccination-specific. The non-mutually exclusive nature of pneumococcal disease was reflected through each 12-month interval during which persons could transition to one or more disease states or remain in a non-disease state. In the case of more than one pneumococcal disease, costs and quality-adjusted life year (QALY) decrements associated with all events were considered. At the beginning of each annual cycle, a new cohort of children (i.e., incoming birth cohort) entered the model and was eligible for vaccination.
Fig. 1
Model structure. IPD invasive pneumococcal disease, mo months, OM otitis media, SoC standard of care, yrs years
The full health benefit of vaccination was applied to the entire German population, of which the vaccinated cohort experienced the direct effects of vaccination immediately, while the rest of the unvaccinated population gradually received indirect effects over the model time horizon.
Target Population and SubgroupsThe target population was composed of infants aged < 2 years (i.e., ,a vaccination cohort), while the model assumed that the groups aged 2–4 years, 5–17 years, and 18–49 years were not vaccinated with the higher-valent PCVs. In clinical practice, a proportion of the group ≥ 60 years is vaccinated under the adult immunization program [19, 20]; hence, within this pediatric model, that proportion of adults was excluded from receiving indirect effects, while the remainder of the population ≥ 60 years remained unvaccinated and benefitted from indirect effects of pediatric vaccination.
Intervention and Comparator StrategiesSTIKO currently recommends PCV10, PCV13, and PCV15 for infants and children in Germany [21]. However, PCV13 was shown to avoid more cases than PCV10 [22] and accounts for the majority of vaccination rate, at more than 90%, in children, remaining the most used PCV in the past decade in Germany [13, 23]. Therefore, PCV10, although included in the STIKO recommendation, was not considered among comparators in this analysis. The analysis evaluated the clinical and economic outcomes of PCV20 in a 3+1 schedule as a potential vaccination strategy compared with PCV13 (i.e., standard of care) and PCV15, both in a 2+1 schedule.
Perspective, Time Horizon, Cycle Length, and Discount RateThe base-case analysis was conducted from a German societal perspective using a 3% annual discount rate for both costs and benefits, according to the recommendations of the Institute for Quality and Efficiency in Health Care and STIKO [24, 25]. The model used an annual cycle length over a 10-year time horizon to capture relevant costs and outcomes. The 10-year time horizon sufficiently captures the health benefits of the PCV vaccination program, based on the observation of the accrual and stabilization of indirect effects over a 5- to 10-year period following the introduction of PCV7 and PCV13 [26, 27]. The life years and QALY loss is accumulated over the time loss between death occurrence and life expectancy (with the QALYs being age-dependent and discounted from the year the death occurs). Lifetime long-term costs related to a clinical event, such as sequalae following meningitis, were incorporated in the model as a one-time discounted cost in the cycle in which the event happens.
This study was based on previously conducted studies and does not contain any new studies with human participants or animals performed by any of the authors; as such, ethical approval was not required.
InputsPopulation and Epidemiology DataPopulation data were obtained from the German Federal Statistical Office to determine the size of the stratified population age groups [28] (Table S1; Supplementary Material) and the incoming birth cohort each year [29] (Table S2; Supplementary Material).
Age-specific disease incidence rates per 100,000 individuals were informed by German-specific published literature [30,31,32,33], adjusted for relevant age groups using population size from the German Federal Statistical Office [28] (Table 1).
Table 1 Epidemiology inputsMortality in the analysis was considered as a combination of general mortality [34] and case fatality, which were applied to meningitis, sepsis/bacteremia, and all-cause hospitalized and non-hospitalized pneumonia (Table 1), while no mortality was assumed for OM [22, 31].
The model considered sequela following meningitis (i.e., deafness and non-deafness) in the base case as sequela following meningitis are quite common among patients with IPD [22]. The data for the proportion of patients developing complications with IPD were sourced from published literature [22] (Table S3; Supplementary Material).
IPD serotype-specific distribution by each PCV stratified by age groups was obtained from [35, 36] (Table 2). The serotype coverage for PCV7 serotypes (4, 6B, 9V, 14, 18C, 19F, 23F) was incorporated as one input, while the coverage for each additional serotype included in higher valent vaccines was input separately for each age group. The analysis did not consider cross-reactive serotypes. Non-invasive serotype distributions (i.e., for pneumonia and OM) were assumed to be the same as IPD serotype distribution.
Table 2 Current serotype distribution by age [35, 36]Vaccine Effectiveness and EfficacyThe direct effect of PCVs against IPD for a complete vaccine schedule was assumed to be equivalent to the adjusted PCV13 effectiveness against PCV13-type IPD, of which 78.2% [95% confidence interval (CI) 56.0, 89.0] was applied for vaccines in a 2+1 schedule while 89.7% (95% CI 82.0, 94.0) was used for PCV20 in 3+1 schedule (Table 3) [37]. To estimate the direct effects of the higher-valent PCVs against all-cause pneumonia (non-hospitalized and hospitalized) and OM, the model adopted an approach commonly used in CEAs [38,39,40,41,42], in which the effectiveness of higher-valent PCVs against non-invasive disease was assumed to be the same as the reported trial-based efficacy data of PCV7, which was then adjusted based on study design, period, and country-specific factors. These results demonstrated an efficacy of 25.5% (95% CI 4.4, 34.0) [43], 6.0% (95% CI − 1.5, 11.0) [44], and 7.8% (95% CI 5.2, 10.5) [45] against radiographically confirmed non-invasive hospitalized pneumonia, non-hospitalized pneumonia, and OM, respectively (Table 3).
Table 3 Vaccine effectiveness, cost, and utility parametersIn addition, a < 12-month effect modifier was used to account for potential reduced effectiveness in the first year of life during which children have only received the priming series of the full vaccination schedule [i.e., at two-thirds (~ 67%) of the full effect for vaccination with a 2+1 schedule for PCV13 and PCV15, and at 75.6% for PCV20 3+1 based on the Advisory Committee on Immunization Practices’ assumption [46]]. Vaccine coverage was set at 89.9% for the priming series and at 76.8% for the booster dose [47].
Evidence has shown that direct effects of PCVs remain stable for a few years after the final dose. For example, the efficacy of PCV13 was steady for up to 4 years in infants after vaccination was completed [37] and for more than 5 years in people aged ≥ 65 years after a single dose [48]. Therefore, in the base case, a full direct effect for the first 5 years after the booster dose was assumed for all vaccines, followed by an annual waning of 10% from year 6 through year 10.
The analysis considered indirect effects in unvaccinated individuals since they are an important benefit from pediatric PCV national immunization programs. The indirect effect against serotypes covered represents the maximum protection the unvaccinated population could receive from a vaccine regimen. This was modeled as a percent reduction in the expected age-specific disease incidence. Indirect effect was not realized immediately and was only applied to newly covered serotypes in PCV15 and PCV20, as the indirect effect for PCV13 serotypes was assumed to have already reached a steady state. These benefits accrued gradually until a new steady state was reached for additional serotypes. Indirect effect for PCV15 and PCV20 was assumed to have no added effects on PCV13 steady-state serotypes. The model assumed that incidence trends for all newly covered serotypes would decrease consistently across ages. For IPD and non-hospitalized and hospitalized pneumonia, indirect effect was assumed for all age groups, while for OM, indirect effect was assumed only for the < 5 years age group. To estimate indirect effects, the model incorporated the reduction in incidence of the newly covered serotypes and the accrual of the indirect effects of higher-valent PCVs (see Supplementary Material, Appendix A).
Resource Use and CostsVaccine costs for PCV13, PCV20, and PCV15 were derived from retail pharmacy price per dose [49], and the administration cost were from [22], inflated to 2022 Euros (€). Additional vaccine cost and administration cost, which accounted for an additional visit, were applied to the extra dose under 3+1 schedule for PCV20. Medical costs per episode related to each disease state sourced from [22] were included for all relevant age groups in the model [22]. Lifetime medical costs per episode of sequela were assumed to be the same across all age groups for deafness and non-deafness [22]. Societal costs considered productivity loss per episode of meningitis, sepsis/bacteremia, inpatient and outpatient pneumonia and OM, as well copayment for adult patients. All costs were in Euros (€) and obtained from German published sources and the literature, then inflated to 2022 prices using the healthcare component of the consumer price index [50] where relevant. The summary of cost inputs is listed in Table 3.
UtilityThe model used baseline utility for the general population [51] minus disutilities related to disease states and acute events to assess quality of life related to each vaccination strategy (Table 3) [42, 52,53,54,55,56,57].
Assessment of UncertaintyUncertainty around the analyses was evaluated using deterministic sensitivity analyses (DSA), probabilistic sensitivity analyses (PSA), and scenario analyses. DSA assessed uncertainty around the following variables: disease incidence, breakdown of IPD cases, case fatality rate (CFR), serotype distribution by age, vaccine effectiveness and utilities.
In the PSA, all parameters subject to any degree of uncertainty were assessed The incremental results for costs, QALYs, and incremental cost-effectiveness ratios (ICER) were recorded for each simulation of a total of 1000 simulations to examine the stability of the model findings.
Several scenarios were conducted, the description and results of which are reported in Table 6. In addition to the scenario assessments, threshold analyses were conducted to assess the price per dose of PCV20 under a 3+1 schedule. These analyses aim to determine the price range at which PCV20 stays a cost-saving strategy compared to PCV13 2+1 and PCV15 2+1, assuming consistent input parameters for other variables (including the prices of PCV13 and PCV15).
Comments (0)