
Remember me

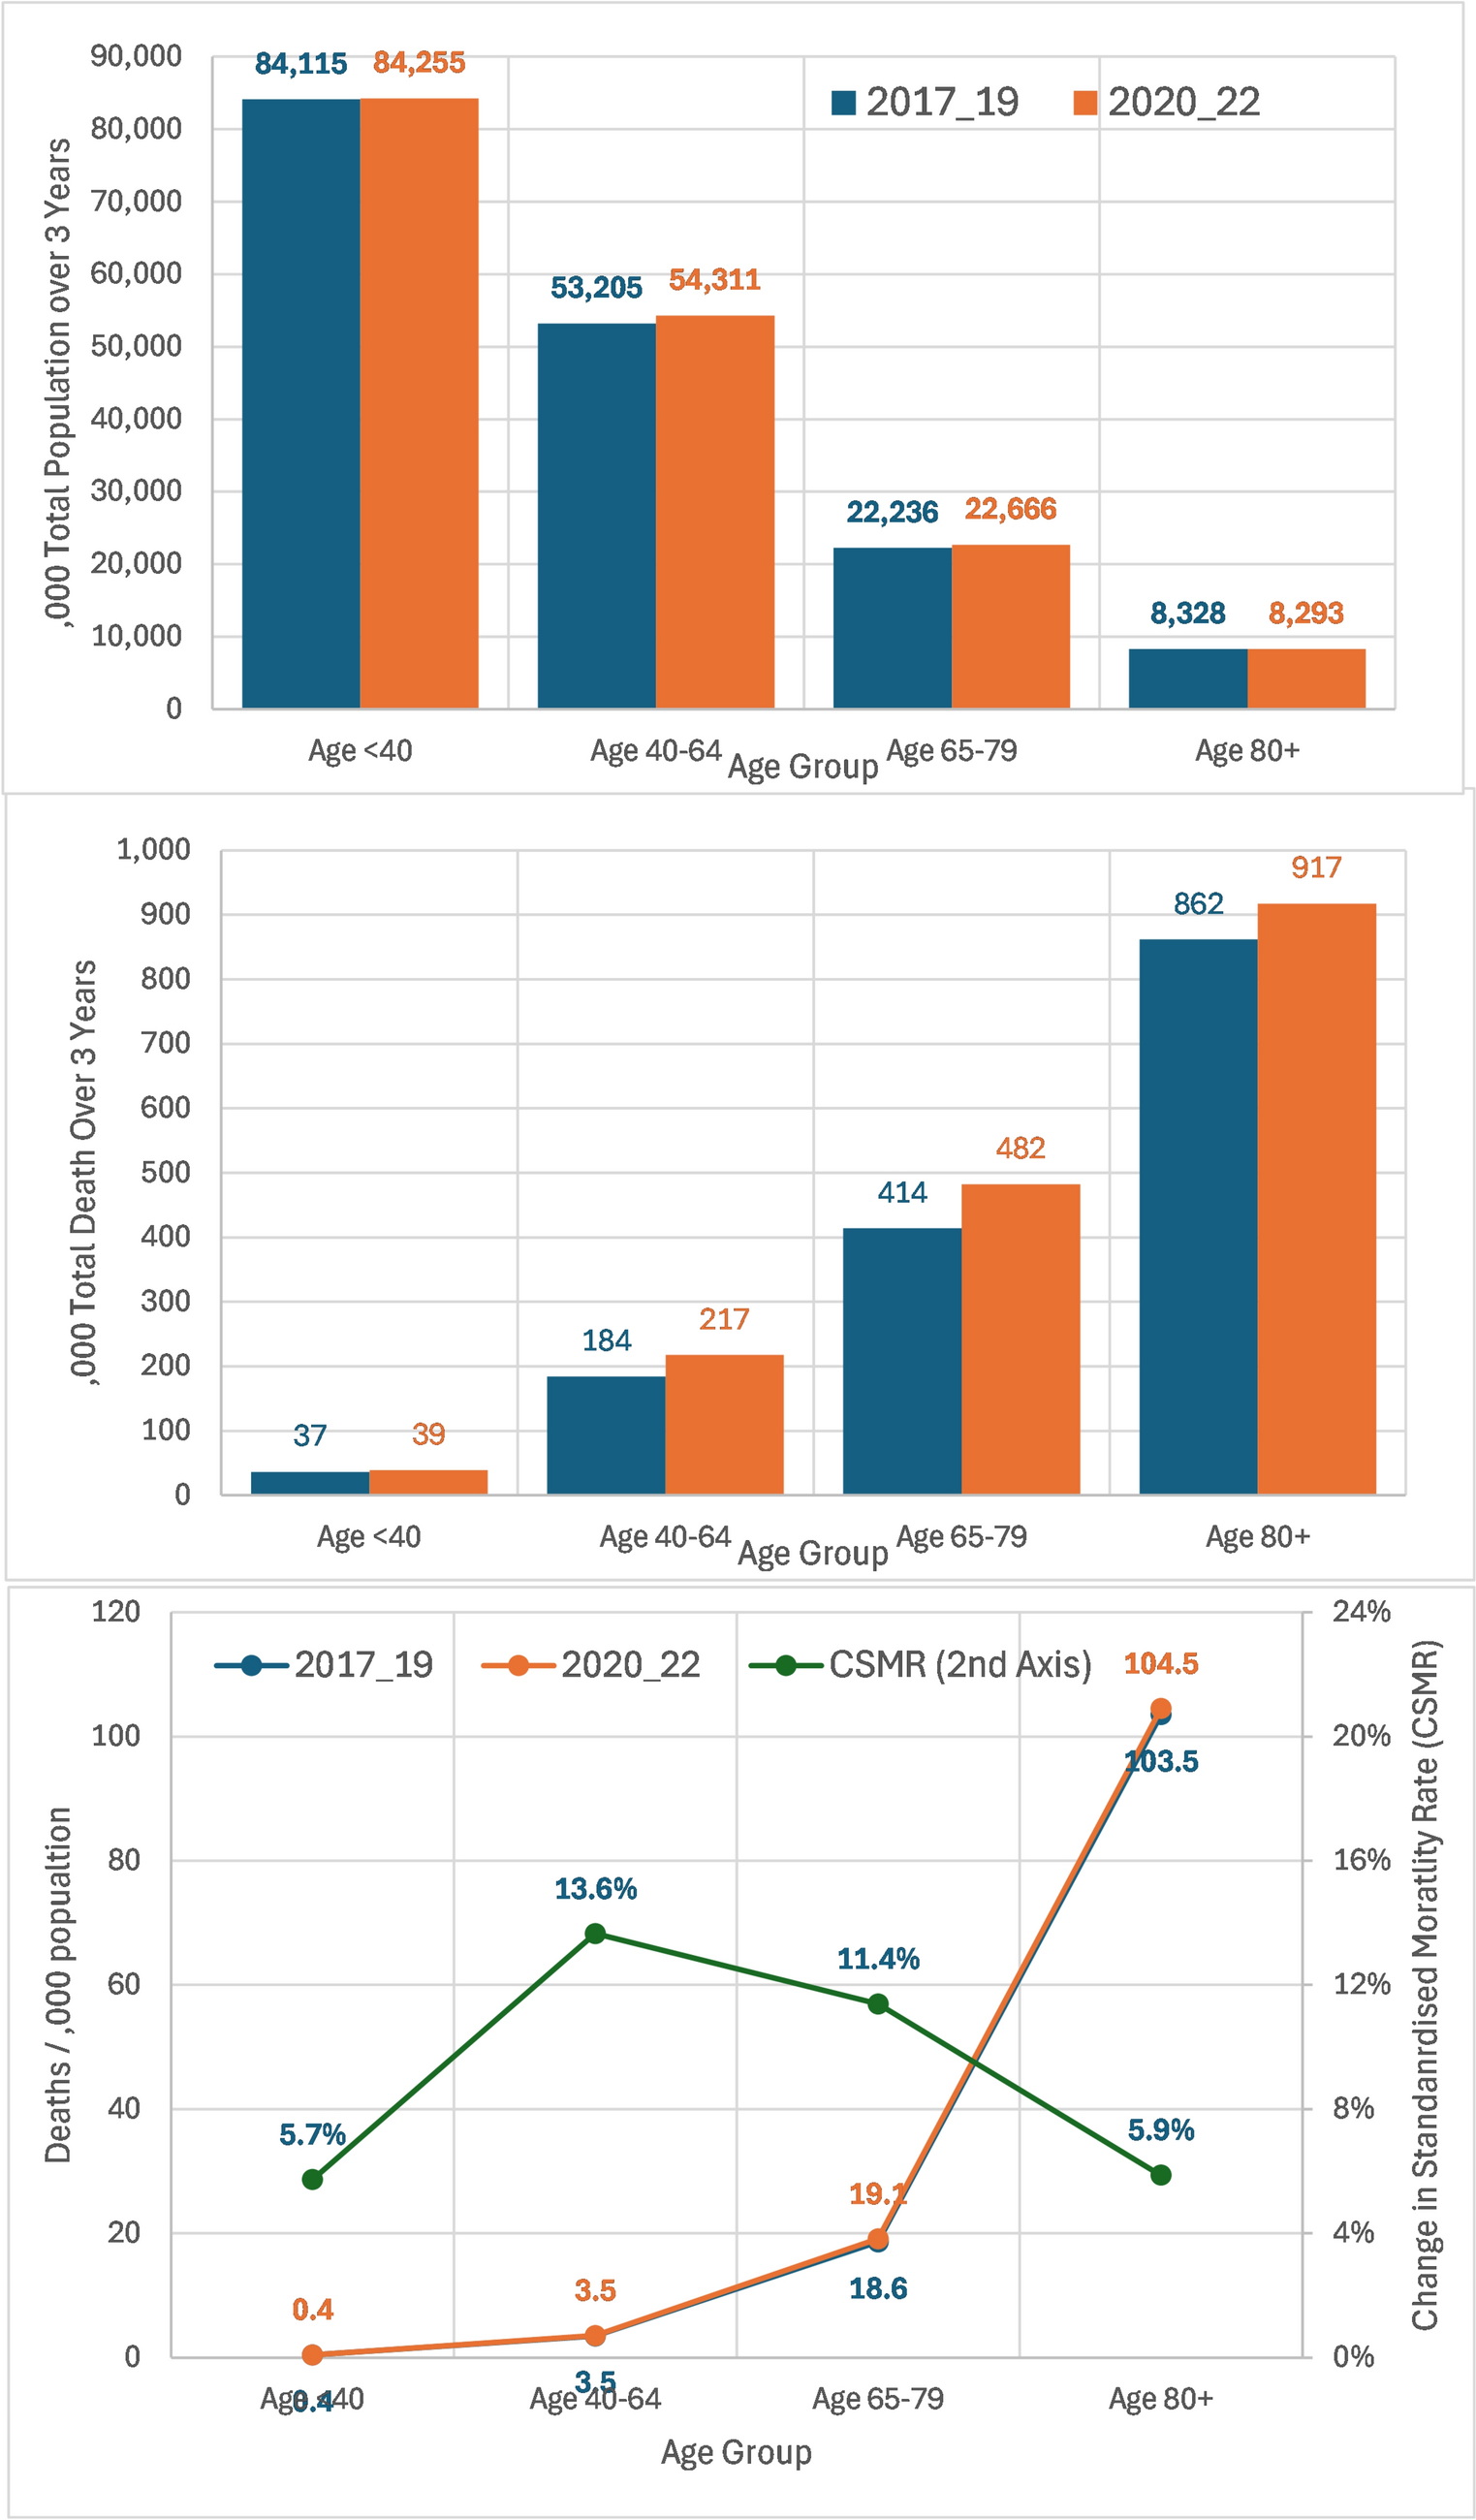


Table 1 reflects the sum of LSOA data in 2017–2019 to calculate average national mortality rate by sex and age group, then applied as a baseline calibration to determine the local expected deaths both for the 2017–2019 period and then in the 2020–2022 period.
Table 1 National average mortality rate (NAMR) deaths /,000 population by sex and age over all LSOAs for 2017–2019Table 2 and Fig. 1 reflect the actual population and deaths over the two 3-year periods, partitioned by age group. Overall, the number of LSOAs in the 2017–2019 period was 32,844, containing on average 55.96 million individuals with 498,982 deaths/year recorded. They had an average mortality rate of 8.9 deaths per 1000 population. In 2020–2022, there were on average 56.51 million people with 551,975 deaths per year, giving an average mortality rate 9.77 deaths per 1000 population – representing an increase of 8.4% to the 2017–2019 period.
Table 2 Population, deaths reported, expected deaths based on mortality rate in 2017–2019, change in standardised mortality rate and excess deaths in lower layer super output area (LSOA) by year and age groupFig. 1
Total population years, deaths, mortality rate and change in standardised mortality rate (SMR) by age group for 2017–2019 compared with 2020–2022
If there had been no change in the mortality rate over the years during and after the pandemic, there would have been 128,336 (7.7%) fewer deaths. For 2020–2022, excess deaths were 2106 in people aged < 40 years, 26,120 in the age range 40–64 years, 49,301 in the age range 65–79 years and 50,857 in the age range 80+ .
This excess mortality occurred as 55,256 deaths in 2020, 57,432 in 2021 and 15,696 in 2022. Of note, in 2022, the excess mortality effect was lowest in the 80+-year age group (down to 1013 deaths). Change in CSMR between 2017 and 2019 and 2020–2022 was highest in the age group 40–79 years.
Table 3 shows the figures for observed and expected deaths both before and during the COVID-19 pandemic, in LSOA, split by decile of IMD 2019 score; the 50% of LSOAs with lower deprivation had a similar value of CMSR at between 6% and 7%. However, the CSMR increased linearly in the higher deciles, reaching 16% in the highest decile. The top five deciles of social deprivation were linked to 69% of the excess deaths, while the bottom five constituted 31% of excess deaths. This suggests that if the CSMR rate achieved in the 50% of least socially deprived areas could be achieved across the country, then 36,000 (28% of total) excess deaths could have been avoided.
Table 3 Association between social deprivation lower layer super output area (LSOA) split by IMD 2019 score decile on expected deaths based on average 2017–2019 mortality rateFigure 2 shows how the COVID-19 pandemic had a differential effect, per social deprivation, on age groups. In age 80+ years (light blue), LSOAs below IMD 20 (50% of population) had a stable CSMR (~4%); however, in those LSOAs with IMD > 20, the CSMR increased linearly in this age group, reaching 16% for IMD > 50. For age 65–79 years (green), CSMR was stable to IMD < 25 (10%), then stable above IMD 25 at 14%. In age 40–64 years (red), CSMR was stable for IMD < 10 at 10%, then also increased to 14%. For age < 40 years (dark blue), CSMR was around 0% for IMD < 10, then for IMD > 10, it fluctuated around 6%. The relation between CSMR and IMD was similar in men and in women.
Fig. 2
Impact of social deprivation on CMSR by age group and sex
To investigate the impact of care home beds on the overall increase in mortality, further analysis, by grouping LSOAs by the amount of local RCH beds (expressed as tertile of RCH beds as percent of age-65-years population), showed that there was a difference in mortality between tertiles (Table 4). Out of the entire number of 32,841 LSOA (n = 32,841), 22,357 LSOAs had no RCH within them. These LSOAs had 4.3% of their population in the ≥ 80-year age bracket, compared with the 10,484 LSOAs with RCH present, who had 6.1% of their population in the age ≥ 80 years group.
Table 4 Association between the presence of residential care homes (RCH) beds in each lower layer super output area (LSOA) on change in standardised mortality rate (CSMR)In 2017–2019, and in LSOAs without an RCH in the 80+-years age group, the population was 4.3% of the total population, and their SMR was 0.80 compared with those LSOA with RCH, where age 80+ years was 6.1% of the total population, and the SMR was 1.26.
By contrast, in 2020–2022, the SMR in those LSOAs without RCH was 0.88, giving a CSMR of 10%, while those with RCH had SMR of 1.30, giving a CSMR 3.1%. If we calculate expected deaths on the basis of a CSMR of 0% and then take the difference to actual deaths, in the age 80+ years, 37,791 of these excess deaths were in the community compared with 17,840 excess deaths in the RCH.
When those LSOA with RCH are split tertile by percent RCH beds as percent population age > 65 years, then the above effects were augmented in the higher tertiles of RCH beds.
Social deprivation in LSOAs with and without RCH was similar (IMD average: 21.3 with RCH and IMD average: 21.8 without RCH), suggesting that the difference in social deprivation did not influence this outcome.
The ONS reported that in 2021, 74% of older people in care homes in the UK were age 80+ years. Figure 3 shows the CSMR variation by RCH beds as percent population age > 65 years, split by age group. This shows that the reduction in CSMR was only apparent in the age 80+-year age group, with no effect apparent in the 65–79-year age group, supporting the hypothesis that RCHs are the main source of this effect.
Fig. 3
Change in SMR between 2017 and 19 and 2020–2022 linked to RCH beds as percentage of population aged > 65 years, by tertiles, for age 65–79 years and age 80+ years
Table 5 examines models that have been used to establish the impact of the COVID-19 pandemic on the number of deaths for the population age 80+ years population, who are the main residents in RCHs and had in total 47,779 excess deaths by (1) the availability of RCH beds within LSOAs and (2) the type of RCH beds present in LSOA-only RH (i.e. no nursing support), only CH (i.e. that have nursing support) or mixed both RH and CH present.
Table 5 Estimating residential care homes (RCH) association with mortality and excess deaths both by (1) number of RCH beds and (2) by type of RCH beds in local population age 80+ yearsTo examine how the differences in CSMR on were reflected into excess death compared with each other, two scenarios were evaluated in Table 5 for variation by number of beds (1) and by type of care home (2).
Scenario 1 examined the benefit of RCH restrictions by applying the CSMR from ‘no RCH’ to those LSOAs with RCHs; it suggests that 24,968–27,610 more deaths might have been expected in the age 80+-year population if RCHs had followed the same guidelines as the community and that RCHs with nursing care brought the largest benefits in relation to avoided deaths.
In Scenario 2, the opportunity if RCH standards had been applied for age 80+ years in the community was examined. The CSMR in highest % RCH beds tertile or CH only were applied to all LSOAs; it suggests that if similar support had been offered to all with age 80+ years, then 32,815– 58,128 deaths might have been avoided.
Comments (0)