
Remember me


The present retrospective study represents the third and final phase of the AUTO-CAND project, and was conducted at IRCCS Ospedale Policlinico San Martino, a 1200-bed teaching hospital in northern Italy.
In the first phase of the AUTO-CAND project, a computerized extraction system of laboratory features from candidemia and bacteremia episodes was manually validated across a random subset of episodes to guarantee automated (i.e., computerized and non-manual) extraction accuracy > 99% [19]. The validation allowed the automated extraction, over a few days, of laboratory features from 15,752 episodes of candidemia and bacteremia (with 10% prevalence of candidemia, of which 2% mixed episodes of candidemia and bacteremia), i.e., all the episodes occurred at IRCCS Ospedale Policlinico San Martino from January 1, 2011 to December 31, 2019, a task that would have taken much longer if performed manually. The complete technical details of the automated extraction system and of its validation have been previously published [19, 20]. The first phase of the AUTO-CAND project served to provide a large dataset on which to explore the diagnostic performance of machine learning models for the diagnosis of candidemia based on laboratory features (the complete list of automatically extracted features is available as Supplementary Table S1).
This means that clinical features (e.g., presence of central venous catheter, total parenteral nutrition, previous broad-spectrum antibiotic therapy) were not automatically extracted. While, in principle, this can be expected to lead to lower diagnostic accuracy, it also cannot be known a priori whether training of machine learning models on a large amount (in terms both of features and of training examples) of laboratory data alone could provide useful complementary information to understand how to improve early diagnosis of candidemia through machine learning techniques.
In the second phase of the AUTO-CAND project, we assessed the diagnostic performance for the early diagnosis of candidemia (as a prediction task), based on the dataset of laboratory features extracted in the first phase, of three different supervised statistical/machine learning models: (i) penalized logistic regression with L1-norm; (ii) penalized logistic regression with L2-norm; (iii) random forest [13]. To this aim, we first considered that, whenever empirical treatment is required in clinical practice in patients with signs and symptoms consistent with BSI, early antibacterial therapy is usually administered, independent of the need for concomitant early antifungal therapy. This is because of the overall higher risk of bacteremia than candidemia, if only in terms of baseline prevalence. Consequently, we deemed the binary prediction task of clinical interest to be candidemia vs. no candidemia, with the former including both isolated candidemia and mixed candidemia/bacteremia, and the latter isolated bacteremia [13]. Second, we addressed the inherent and expected issue of missing values in real-world data. Owing to the large percentage of missing sequential data, we considered for each laboratory test only one result (i.e., the closest one to the onset of candidemia or bacteremia in the interval from within 2 days before to 12 h after the onset). Then, after excluding episodes and features with a proportion of missing values of more than 50% (in order to apply multiple imputations with sufficient reliability), the final dataset for the analysis was composed of 12,483 episodes (of which 1275 and 11,208 candidemia and bacteremia episodes, respectively) and 29 features (see Table 1 and Supplementary Table S2).
Table 1 Causative agents of candidemia and bacteremia in the study populationNotably, both serum beta-d-glucan (BDG) and serum procalcitonin (PCT), the combination of which is usually considered within our clinical reasoning for the differential diagnosis between candidemia and bacteremia [5]), were initially removed from the features considered for the analysis, owing to a high proportion of missing values (89% and 72%, respectively). The resulting dataset, not including serum BDG and serum PCT, was randomly split into a training set and a test set, including 70% and 30% of episodes, respectively, while retaining the original 10% prevalence of candidemia in both the training and test sets. Then, missing values were imputed through multiple imputation with chained equations, using a nearest neighbors method, and continuous features were standardized by subtraction of means and division by standard deviations [21]. Considering that we aimed to improve the baseline diagnostic performance for early candidemia compared to that of laboratory markers usually employed in our center (serum BDG and serum PCT, as discussed above), we decided to set the sensitivity of serum BDG previously measured in our center (around 60% based on internal data) as the threshold of minimum sensitivity to be required for the trained machine learning models. In addition, we set the rule for sensitivity to be higher than specificity. Indeed, we ranked the potential consequences of lower sensitivity, i.e., lack of early antifungal treatment in true cases of candidemia, as more clinically relevant than those of lower specificity, i.e., early antifungal treatment in false cases of candidemia (indeed, in such a case early antifungal treatment could then be discontinued at the time of blood culture results, while continuing antibacterial therapy). Consequently, for the training of machine learning models, we deemed any chosen τ value (defined as the threshold to assign an episode to 0 or 1 according to the probability predicted by the evaluated classifier) to fulfill the following condition in the training set: sensitivity ≥ specificity ≥ 0.60 [13].
Overall, the random forest model achieved the best diagnostic performance for candidemia, with 98% sensitivity and 65% specificity in the training set (with τ = 0.1, based on a user-defined score function built to maximize the true skill statistic [TSS], also known as Youden Index) and 74% sensitivity and 57% specificity in the test set (for more details on the complete calculation of the model diagnostic performance see [13]). Then, we exploited a permutation feature importance approach to identify the most influential features in predicting candidemia. This resulted in 12 selected features (eosinophil count, platelet count, neutrophil cell count, hematocrit, uric acid, monocyte cell count, hemoglobin, urea, albumin, lymphocyte cell count, white cell count, and prothrombin time) that were re-employed, together with serum BDG and PCT, to train a new random forest classifier for predicting candidemia among the 1165 episodes (of which 177 were candidemia, 15%) with available serum BDG and PCT results. This allowed us to leverage what was learned on the much larger entire dataset of 12,483 episodes without serum BDG and PCT results for the subsequent training of a smaller dataset in which it was possible to consider these two markers. Eventually, the diagnostic performance for candidemia of the model including the twelve selected features plus serum BDG and PCT was apparently numerically better than that of a model including only serum BDG and PCT for the majority of the evaluated diagnostic performance measures (e.g., in terms of TSS, sensitivity, weighted positive predictive value [wPPV] and negative predictive value [NPV]), although the differences were small and unlikely to be clinically significant [13].
Interpretation of Phase 2 Results and Rationale for Phase 3Although small, the numerical trend towards better diagnostic performance when the model was trained on serum BDG and PCT plus the selected less specific 12 features vs. training on serum BDG and PCT alone could merit further investigation. In particular, should a true improvement exist, two non-mutually exclusive possibilities may deserve to be explored: (i) whether employing an alternative machine learning-based predictive model able to catch more complex interactions between the above less specific laboratory values could further improve the diagnostic performance of serum BDG and PCT plus nonspecific laboratory features over serum BDG and PCT alone; (ii) whether adding also clinical predictors of candidemia (e.g., previous broad-spectrum antibiotic therapy, presence of central venous catheter, total parenteral nutrition) to large datasets of laboratory features could further improve the early diagnosis of candidemia through ML techniques.
In the third phase of the AUTO-CAND project, we specifically explored the first of these two possibilities by training a deep learning model on the same dataset of laboratory features used in the second phase. The AUTO-CAND project was approved by the pertinent local ethics committee (Liguria Region Ethics Committee, registry number 71/2020). The requirement for informed consent for this study was waived due to the retrospective nature of the analyses.
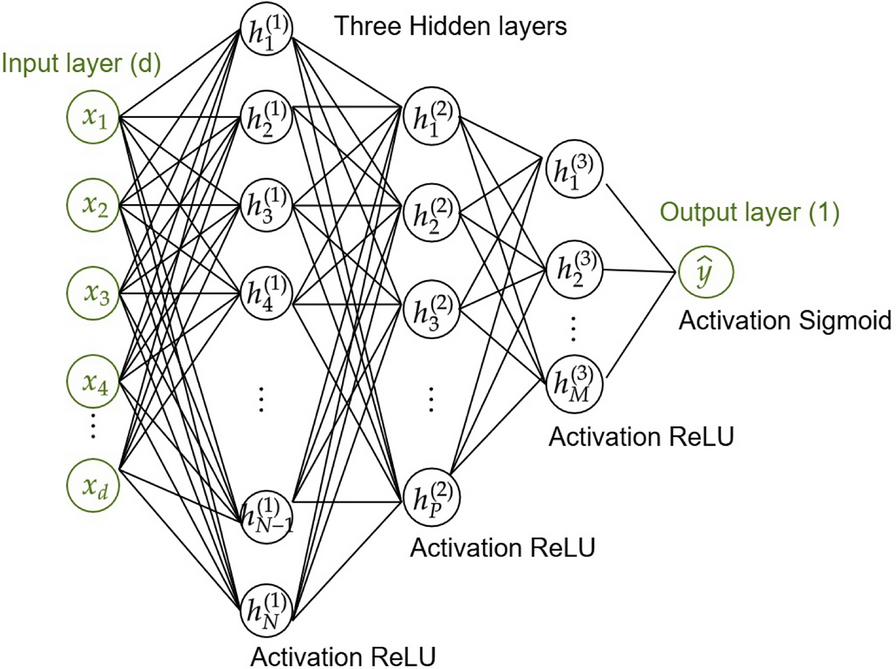
Phase 3 MethodsPredictive Model CharacteristicsWe implemented a feed-forward neural network (NN) with one input layer, three hidden layers, and one output layer (Fig. 1): the first hidden layer contained 100 neurons, and the number of neurons was halved in each subsequent hidden layer. The activation functions were rectified linear unit (ReLU) for all layers, except for the last one, where the sigmoid function was used to provide the output probability of the event of interest (candidemia) being positive. For the training phase, we used a loss function called score-oriented loss (SOL) function that optimizes the TSS, and is particularly suitable for evaluating performance on imbalanced datasets [22]. We used Adam optimization [23], with the learning rate set to 10–5 and a batch size of 256. We applied early stopping with a patience of 1000 epochs by monitoring the validation loss in order to stop the training process for preventing overfitting. The hyperparameters of the NN were set by an empirical trial-and-error optimization process on several experiments.
Fig. 1
Architecture of the feed-forward neural network trained for the early prediction of candidemia. The neural network architecture consists of the following components: the input layer contains d-neurons (corresponding to the number of features), the three hidden layers have 100, 50, and 25 neurons, respectively, and the output layer has a single neuron. ReLU, rectified linear unit
Dataset PreparationWe employed the same dataset of phase 2 [13]. As reported above, the dataset consisted of 12,483 observations, with a candidemia prevalence of 10% (1275/12,483), and 29 features (see Table 1 and Supplementary Table S2). We considered 16 different splits of this dataset in training-validation-test sets with the following percentage: we randomly assigned the 30% of the dataset to the test set, while the remaining 70% of the observations were divided, again randomly, between the training (85%) and validation (15%) sets. The only criterion that the assignment into different sets had to respect was the maintenance of the balance between prevalence of candidemia (10%) and bacteremia (90%). The rationale for splitting the dataset was to assess the robustness of the predictive model among different configurations of training, validation, and test sets.
Model Performance EvaluationThe prediction task was evaluated by means of several performance measures, computed from the confusion matrices, and obtained varying the threshold that assigns the model result to the classes 0 or 1. The performance measures we employed were: sensitivity, specificity, TSS, PPV, wPPV, NPV, and area under the curve (AUC). For each split we checked if in the validation set a clinical condition of sensitivity ≥ specificity ≥ 0.60 was satisfied for a certain value of the threshold. If so, the threshold value was used in the corresponding test set, otherwise we employed the threshold that maximized the TSS in the validation set. The wPPV in all the analyses was the PPV computed in the weighted modality (i.e., the score was calculated as a weighted average of the precision scores of each class, where the weights depend on the number of samples of each class) in order to ensure that the precision of each class was fairly represented based on its frequency, preventing dominance of numerically larger classes in the overall performance metric. This provided stability for technical comparison between models. Indeed, even with slight changes in the prevalence of candidemia (e.g., in subgroup analysis, see below) large changes in classical PPV would have occurred (differently from NPV, which is more stable to slight variations in presence of an already low prevalence of candidemia). However, since wPPV does not allow for an intuitive clinical interpretation (it does not answer the question “what is the probability of a true positive if positive?”), also classical PPV was calculated and reported in text and tables alongside wPPV.
Model Performance Evaluation: Feature SelectionIn order to identify the key features in predicting candidemia, we explored two advanced techniques for feature selection that build upon the widely recognized permutation feature importance (PFI) algorithm, and we used the SHapley Additive exPlanations (SHAP) algorithm for model explainability [24, 25].
PFI is a model-agnostic technique used to evaluate the importance of individual features in a trained AI model and the method works by randomly shuffling the values of each feature and measuring the decrease in the model’s performance. The greater the decrease in performance, the more important that feature is. Nevertheless, the PFI algorithm does not take into account the correlation between features. Therefore, in the present work, we considered two advanced PFI-type methods, which include the absolute correlation coefficients between features in the permutation process. The first is cross-validated permutation feature importance (CVPFI) [24]. CVPFI is an extension of PFI that accounts for the correlation between features and incorporates cross-validation to improve the robustness of the feature importance scores. Cross-validation splits the dataset into multiple folds, training and testing the model on different subsets of the data, which helps to mitigate overfitting and gives a more generalized estimate of feature importance. The second is correlation-driven permutation feature importance (CDPFI) [26]. CDPFI is a variant of CVPFI that accounts for the correlation between features. It adjusts for cases where features are highly correlated with each other, which can lead to misleading feature importance rankings if not properly accounted for.
For the two PFI-type approaches, we selected features with an importance score, based on the TSS, greater than a fixed threshold of 0.1. This means that a feature is considered relevant if it contributes to a change in the score of at least 0.1. These quantities were computed for all the splits and then aggregated to form a ranking of the features.
As introduced above, we also applied the SHAP algorithm to provide explanations for why the deep learning model made a specific prediction (positive or negative) for particular samples. SHAP is a machine learning explainability method based on Shapley values, which come from cooperative game theory and were originally designed to fairly distribute the payout (or value) among players in a game. In our context, each “player” is a feature, and the “payout” is the prediction made by the deep learning model. We also provided a ranking of the features based on the results from the SHAP algorithm, assigning an average position ranking to each feature derived from the SHAP analysis. While this did not allow to select features based on SHAP analysis, the average position ranking provided additional information to check whether features selected by means of CVPFI and CDPFI also had a high average position ranking by SHAP analysis. Eventually, we retained only those features that were selected by both CVPFI and CDPFI methods.
Subgroup Analyses in Patients with Available Serum BDG and PCT ValuesThe subgroup analyses were conducted only in the subgroup of episodes of candidemia and bacteremia for which serum BDG and PCT values were available (n = 1165), leveraging what was learned in the previous steps on the entire dataset of 12,483 episodes regarding the predictive ability of other nonspecific laboratory features. Of note, as above we started by considering 16 different splits of the entire dataset, which included all 12,483 candidemia and bacteremia episodes. However, in this case, the splitting strategy, in addition to maintaining the balance between candidemia and bacteremia (in terms of their relative prevalence), was designed to ensure that the balance was also preserved in the respective subgroups (employed in subgroup analyses) of episodes for which serum BDG and serum PCT values were available.
For subgroup analyses, we trained, validated, and tested the NN model in three different ways: (i) by considering only serum BDG and serum PCT; (ii) by considering the features selected by CVPFI and CDPFI plus serum BDG and serum PCT; (iii) by exploiting transfer learning, i.e., by including and freezing the weights of the dataset previously trained on the entire dataset (selected features-based model) in the architecture of the novel NN model trained on the subgroup of episodes with serum BDG and PCT values available. Overall, this latter model combined the pre-trained network with two additional features, serum BDG and serum PCT, and included two fully connected hidden layers with 24 and 12 neurons, respectively, to process the combined inputs from both the pre-trained model and the added features. The final output layer consisted of a single neuron with a sigmoid activation function to generate a probability prediction. The novel model was trained in a similar way to the pre-trained one, using the same optimizer, the SOL function tailored to optimize the TSS, and the early-stopping strategy to prevent overfitting. While the weights of the pre-trained model were not updated, the new layers added after it were trained from scratch. Finally, to adapt the model to the new input data, the first layers of the new model were retrained, a process commonly referred to as fine-tuning, which is particularly useful when limited data are available.
Comments (0)