
Remember me


Eight-week-old female MRL/lpr mice and 8-week-old female C57BL/6 mice were purchased from Shanghai SLAC Laboratory Animal Co., Ltd (Shanghai, China) and Hunan SJA Laboratory Animal Co., Ltd (Hunan, China), respectively. The animals were maintained in a specific pathogen-free environment in the Animal Experimental Center of the Second Xiangya Hospital of Central South University. Experiments were carried out according to the National Institutes of Health Guide for Care and Use of Laboratory Animals and were approved by the Ethics Committee of the Second Xiangya Hospital of Central South University. The study was reported in line with the ARRIVE guidelines 2.0, with additional supporting documents provided in the supplementary materials.
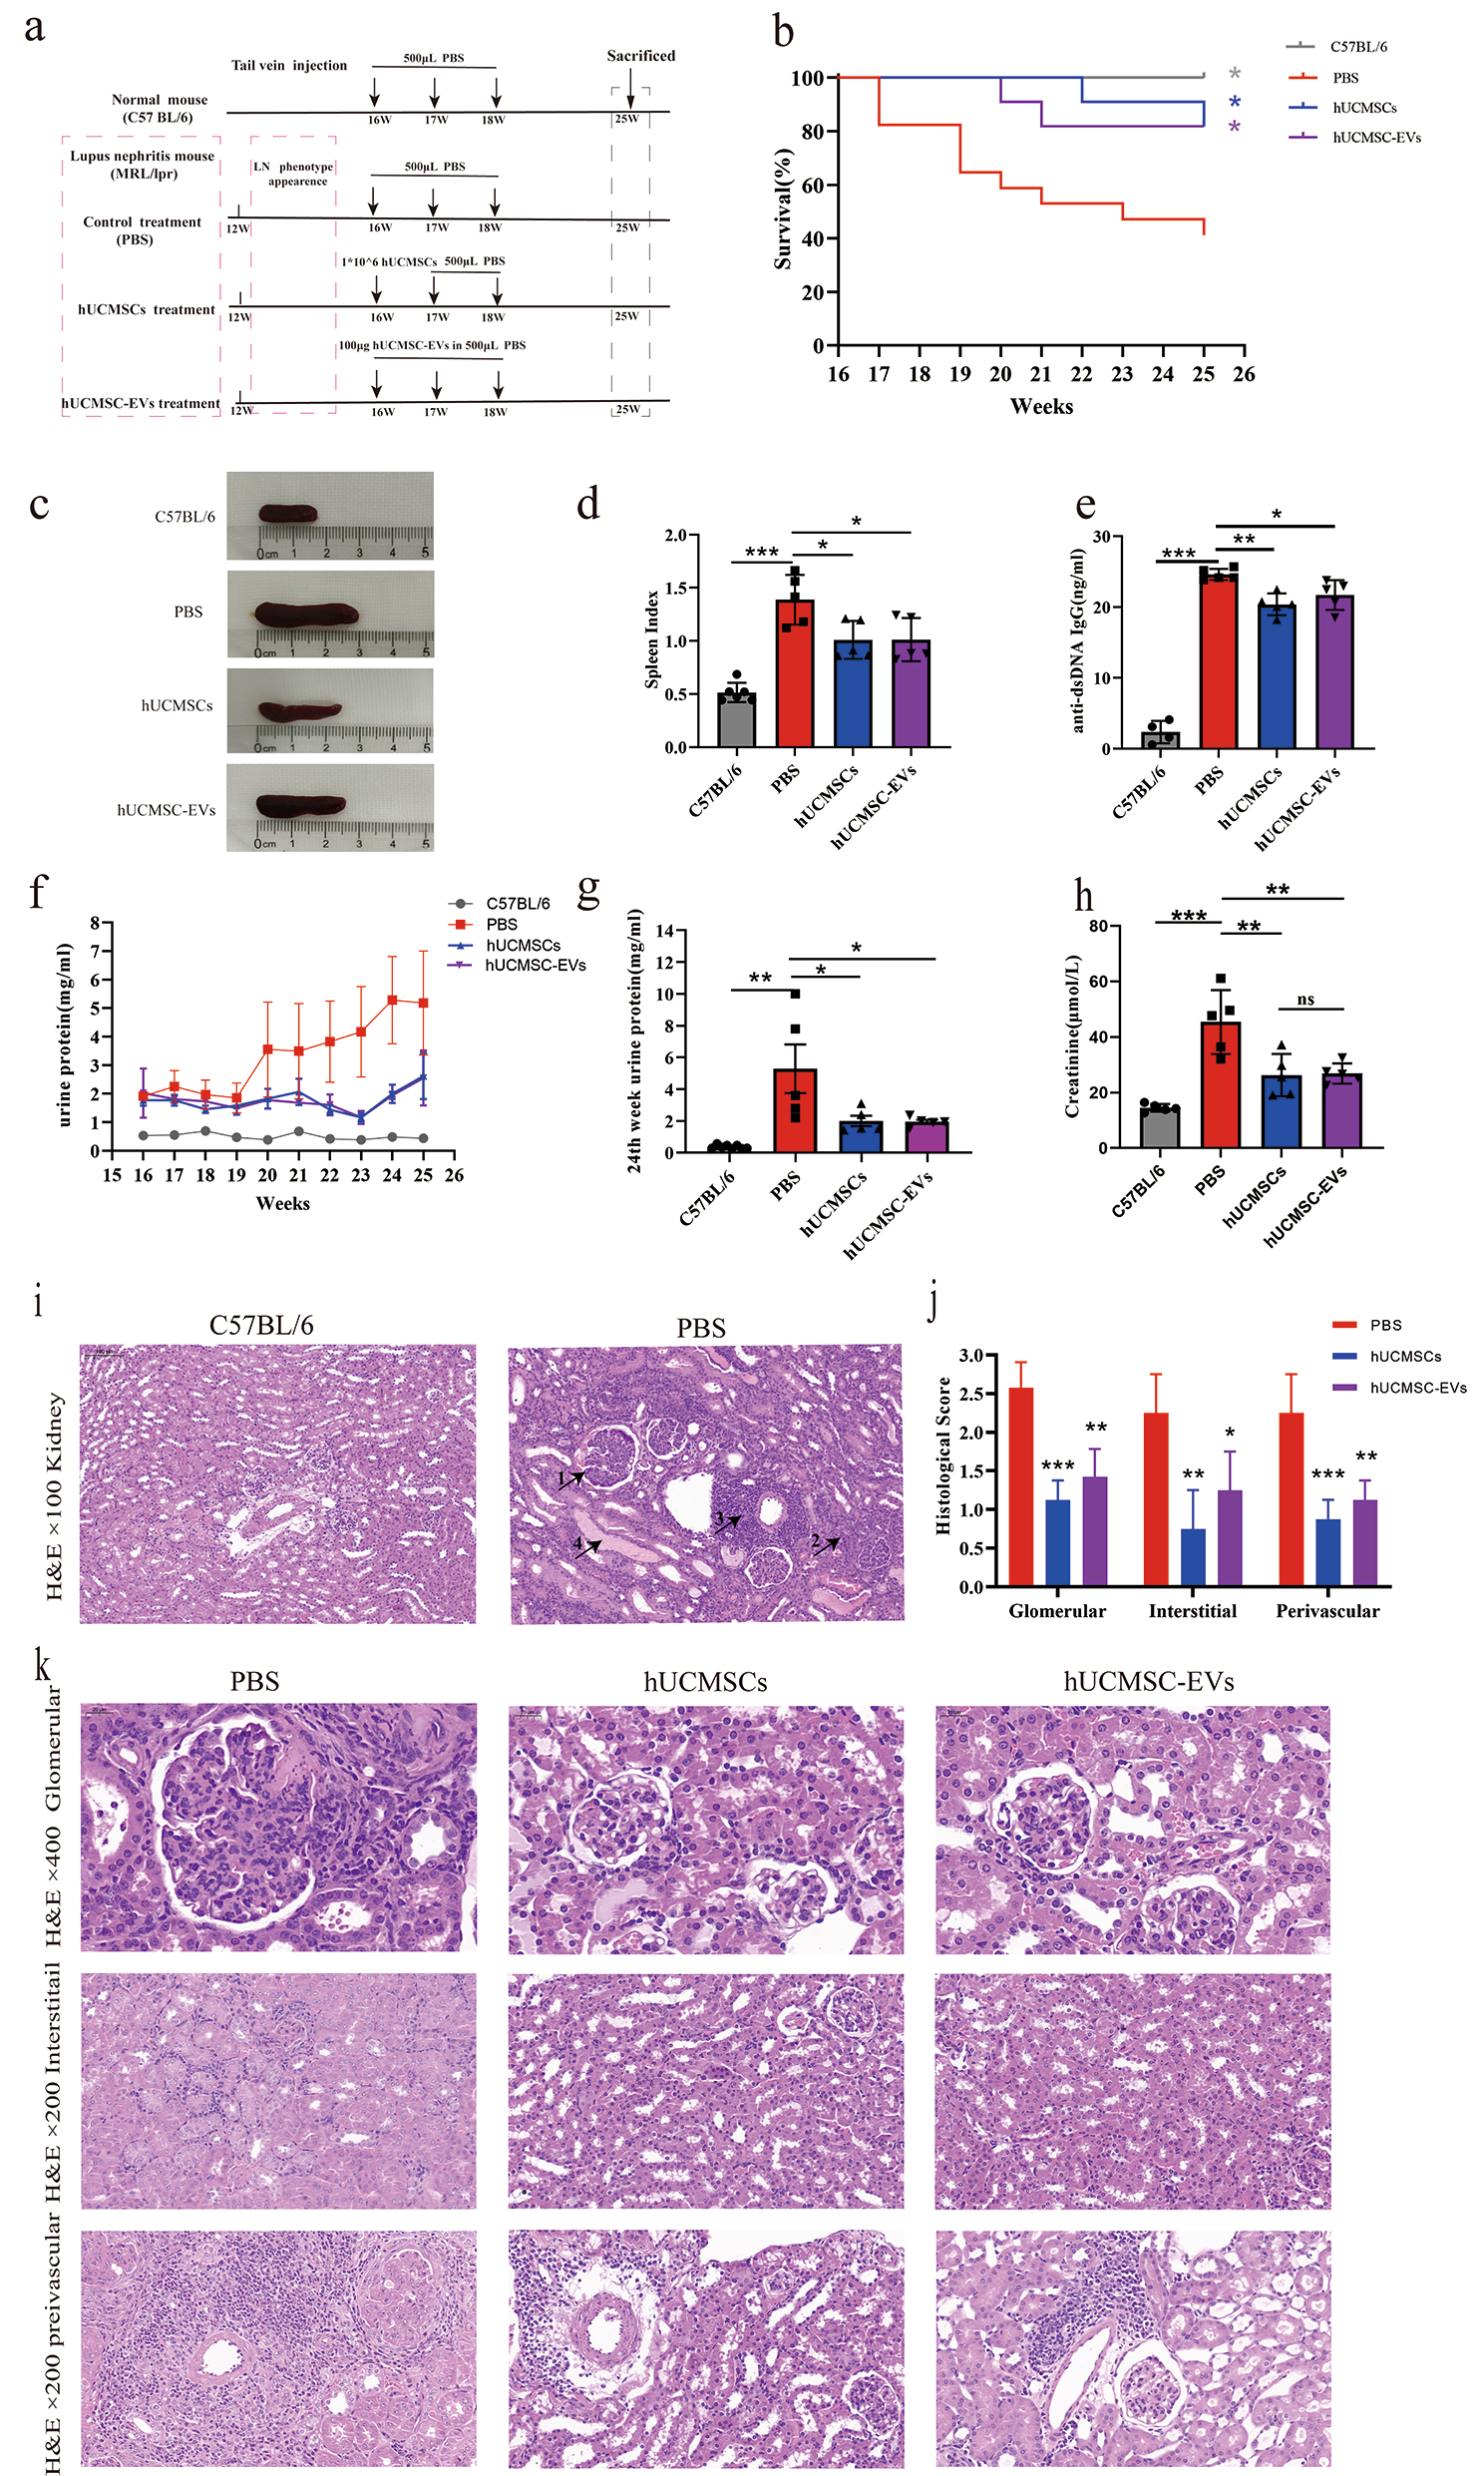
Treatment of mice16-week-old MRL/lpr mice were as models of experimental LN and randomly divided into three groups according to proteinuria level, as follows: phosphate buffered saline (PBS) group (n = 12), hUCMSCs group (n = 6), and hUCMSC-EVs group (n = 6). 16-week-old female C57BL/6 mice were used as normal controls (n = 6). To investigate the effect of hUCMSC-EVs on LN, 16-week-old MRL/lpr mice received hUCMSC-EVs at weeks 1, 2, and 3. PBS was used as vehicle control, and hUCMSCs were used as positive controls. All interventions in this study, including PBS, hUCMSCs, and hUCMSC-EVs, were injected via the tail vein of the mice. In week 10, the plasma, kidney, and spleen were harvested from all mice (Fig. 1a). Details of the intervention are shown in Fig. 1a. At the end of the experiments, euthanasia was performed using sodium pentobarbital, following the American Veterinary Medical Association Guidelines for the Euthanasia of Animals (2020 Edition). The experiment was repeated three times independently, and the results presented in this manuscript are mainly derived from the third experiment unless otherwise specified.
Fig. 1
Systemic administration of hUCMSC-EVs ameliorated LN in MRL/lpr mice. (a) The schematic diagram for studying the effects of hUCMSC-EVs treatment on experimental LN. (b) The cumulative survival rate of each group. The data was combined for two of three independently repeated experiments. The number of animals in the PBS, hUCMSCs, hUCMSC-EVs, and C57BL/6 groups was 17, 11, 11, and 6. (c) Spleen morphology and (d) spleen index: spleen weight per 100 g of animal body weight, and (e) serum anti-dsDNA level were detected at the end of the study. (f) Changes in proteinuria level every week during the study. (g) The proteinuria level near the end of the study. (h) Serum creatinine level was detected at the end of the study. (i) Representative kidney sections stained with H&E (original magnification, ×100) in normal mice and MRL/lpr mice treated with PBS: (1) glomerulosclerosis and increased mesangial matrix, (2) interstitial mononuclear cell infiltrations, (3) perivascular mononuclear cell infiltrations, and (4) renal tube cast. (j) Histological scores of glomerular, interstitial, and perivascular infiltration of PBS, hUCMSCs, and hUCMSC-EVs treatment of MRL/lpr mice. (k) Representative H&E staining of glomerular (original magnification, ×400), interstitial (original magnification, ×200), and perivascular infiltration (original magnification, ×200). Data are expressed as mean ± SD, *p < 0.05, **p < 0.01, *** p < 0.001 vs. the PBS group
Isolation and identification of hUCMSC-EVsThe expanded hUCMSCs met the minimum criteria for the essential characteristics of MSCs [19] (Supplemental Fig. 1). The hUCMSC-EVs were isolated as described in our previous study [15]. Briefly, P4-P6 hUCMSCs were cultured in MSCs serum-free complete medium (Clin-Biotechnology, China), and culture supernatants were harvested to isolate hUCMSC-EVs by differential ultracentrifugation. The final protein concentrations of EVs preparations were quantified by Bradford Protein Content Assay Kit (Keygen Biotech, China), and particle size distribution and particle number measurement were analyzed by nanoparticle tracking analysis (NTA) (NanoSight NS300, UK). hUCMSC-EVs morphology was observed by transmission electron microscopy (TEM) (FEI Tecnai G2 Spirit, USA). Analysis of CD9(ab236630, Abcam), CD81(ab79559, Abcam), and CD63(ab134045, Abcam) expression on hUCMSC-EVs was performed by using ExoView (NanoView Biosciences, USA).
Evaluation of renal injurySpot urine was collected at the same time every week using the “bladder-massage” method. Proteinuria and serum creatinine were measured with Bradford Protein Content Assay Kit (Jiangsu Keygen Biotech, China) and Creatinine Assay Test Kit (Sangon Biotech, China), respectively, according to the manufacturer’s instructions. Kidney tissue samples were fixed in 4% paraformaldehyde for 24 h and embedded in paraffin For renal histopathology assessment. Three μm sections were prepared for hematoxylin and eosin (H&E) staining. We evaluated kidney pathology as previously described [20]. Briefly, glomerular pathology, interstitial pathology, and perivascular cell accumulation were graded according to a scale of 0–3. Kidney slides were evaluated blindly by two investigators, and the final results were confirmed by a renal pathologist.
Isolation of splenocytes and KIIsAfter sacrifice, spleens were removed, and mice were perfused with 30 ml PBS until complete blanching of the liver and kidney occurred. Then, the kidneys were removed. The spleen was gently ground by a syringe plunger and passed through a 70-μm cell sieve to make single-cell suspensions. Erythrocytes in spleen single-cell suspensions were lysed with red blood cell lysis buffer (BD Pharmingen, USA). The Splenocytes were counted and resuspended in PBS for staining and Flow Cytometry analysis. The capsular layer of the kidneys was dissected away. The Kidneys were digested in RPMI 1640 medium (supplemented with 5% FBS) containing 2 mg/ml collagenase IV (BioFroxx, Germany) and 0.1 mg/ml DNaseI (BioFroxx, Germany) at 37 °C for 45 min on a shaker. The completed digested mixture passed through 70-μm and 40-μm cell sieves sequentially and was centrifuged (400 x g, 8 min, 4 °C) to obtain cell pellets. Immune cells were isolated by using percoll density-gradient centrifugation [21]. Briefly, the above-mentioned pellet was resuspended with 3 ml of 36% percoll centrifugation medium, then gently transferred to the upper layer of 3 ml of 72% percoll centrifugation medium without any disruption, and centrifuged (1,000 x g without brake, 20 min, 4 °C). Immune cells were located at the interface, and the cells were then washed, counted, and resuspended in PBS for staining and Flow Cytometry analysis.
Flow cytometry analysisThe cells were incubated in PBS. The following antibodies were used in this study. (1) For Th1 (CD4+IFN-γ+) and Th17 (CD4+IL-17 A+) cells: zombie NIR, BV750 anti-mouse CD45, BV605 anti-mouse CD3, BB400 anti-mouse CD4, FITC anti-mouse CD8, APC anti-mouse IFN-γ, and BV421 anti-mouse IL-17 A. (2) For DNT (CD3+CD4−CD8−) and Treg (CD4+CD25+FOXP3+) cells: zombie NIR (), BV750 anti-mouse CD45, BV605 anti-mouse CD3, BB400 anti-mouse CD4, FITC anti-mouse CD8, APC anti-mouseCD25, and PE anti-mouse Foxp3. (3) For B cell (CD45+CD19+CD3−), B1 cell (CD19+CD5+), and plasma cell (CD3−CD19−CD138+): zombie NIR, BV750 anti-mouse CD45, BV605 anti-mouse CD3, PE anti-mouse CD138 and APC anti-mouse CD5. All antibodies were purchased from BD Pharmingen. For Th1 and Th17 cell detection, the cells were stimulated with a leukocyte activation cocktail (BD PharmingenTM550583, USA) at 37 °C for 6–8 h. For intracellular cytokine or intranuclear cytokine staining, the cells were fixed and permeabilized with a Cytofix/Cytoperm Soln kit (BD Pharmingen) or Transcription Factor Buffer Set (BD Pharmingen) according to the manufacturer’s protocol. Data were acquired by flow cytometry (CytekNorthern Lights™, USA) and analyzed with FlowJo software (Tree Star, USA).
Real-time polymerase chain reaction (RT-PCR)RNA was extracted from kidney tissues using Trizol (invitrogen, USA). For cDNA synthesis, reverse transcription was performed from 1 μg of total RNA using the Evo M-MLV RT Mix Kit with gDNA Clean for qPCR Ver.2 (Accurate Biology, China). Quantitative real-time PCR assays were performed using the SYBR Green Premix Pro Taq HS Qpcr Kit (Accurate Biology, China) and the StepOnePlus Real-Time PCR Systems (Roche, USA). The relative expression of each gene was determined and normalized to the expression of housekeeping gene glyceraldehyde 3-phosphate dehydrogenase (GAPDH) by using the 2–ΔΔCt method. Gene-specific primers (Tsingke Biotechnology, China) are listed in Supplemental Table 1.
ELISASerum anti–double stranded DNA IgG antibody (anti-dsDNA IgG Ab) was measured by using the mouse anti-dsDNA IgG (Cusabio, China) ELISA Kit. Cytokine levels in the serum were assayed by using mouse IL-2, mouse IFN-γ, mouse IL-17 A, and mouse TGF-β1 ELISA Kit (Elabscience, China) according to the manufacturer’s instructions.
Western blot analysisMice kidney total proteins were extracted by using a mixture of protease inhibitor, phosphatase inhibitor, and Radio Immunoprecipitation Assay (PIPA) lysate buffer (Jiangsu Cowin Biotech, China). Anti-STAT3 (1:1000, ab68153, Abcam), Anti-phosphorylated-STAT3 (1:4000, ab76315, Abcam), Anti-IL-17 A (1:1000, ab302922, Abcam), and Anti-GAPDH (1:6000, ab8245, Abcam) antibodies were used to probe the blots according to standard procedures. Immuno-reactive bands were detected by enhanced chemiluminescence (ECL) technique and visualized using ChemiDoc™ Touch Imaging System (Tanon). The intensity of the blots was quantified by densitometry using Image J software.
Statistical analysisAll values are expressed as the mean ± standard deviation (SD). We assessed data for normal distribution and similar variance between groups. Statistical analyses were performed by One-way ANOVA for multiple comparisons with Dunnett’s multiple comparisons test on posttests. For survival analysis, the log-rank test was used to compare survival curves. We used GraphPad Prism version 8.3 (GraphPad Software, CA) for statistical analysis. P value < 0.05 was considered to be statistically significant.
Comments (0)