Patients and tissue collection
Dental pulp tissue samples were obtained from third molars extracted from 18–24-year-old patients at the Department of Stomatology. All experimental protocols were approved by Medical Ethics committee of NanFang Hospital of Southern Medical University (NFEC-202302-K5-01). A total of 10 healthy tooth samples and 10 carious tooth samples were collected for the subsequent experiment. The patient information is presented in Table 1. The exclusion criteria included hematologic disorders, cardiovascular and respiratory diseases, diabetes, systemic inflammation or non-plaque-induced oral inflammation, immunosuppressive chemotherapy, and current pregnancy or lactation.
Table 1 Participant detailsIsolation of primary hDPSCs
Dental pulp tissue samples were obtained from third molars extracted from 18–24-year-old patients at the Department of Stomatology of NanFang Hospital of Southern Medical University. All experimental protocols were approved by Medical Ethics committee of NanFang Hospital of Southern Medical University (NFEC-202302-K5-01). The collected dental pulp tissues were then cut into 1–2 mm tissue blocks and incubated with 1 mg/ml type I collagenase (C8140-100, solarbio) for 15 min. The tissue blocks were placed in cell culture flasks for cultivation, and the isolated cells were identified. The isolated hDPSCs were cultured in Dulbecco’s Modified Eagle Medium (DMEM) supplemented with 10% fetal bovine serum (FBS) (Gibco, Grand Island, NY, USA) and 100 U/mL penicillin/streptomycin (HyClone, NY, USA), and maintained at 37 °C in a humidified atmosphere containing 95% air and 5% CO2. Cells were filtered through a 70 μm filter (BD Falcon, Franklin Lakes, NJ) to obtain a single-cell suspension. The single-cell suspension was seeded at a density of 1 × 10⁴ cells/well in a 6-well plate. Single-cell-derived colonies were obtained using limiting dilution technique. The cells were identified by flow cytometry (Becton Dickinson, Tokyo, Japan) using stem cell surface markers (CD44, CD90, CD45, CD34). The specific methods followed the previous research [29].
Odontogenic induction
In the differentiated group, hDPSCs were cultured in odontogenic differentiation medium containing 50 mg/mL ascorbic acid (255564-100G, Sigma-Aldrich), 100 nmol/L dexamethasone (D4902, Sigma-Aldrich), and 10 mmol/L β-glycerophosphate (G9422, Sigma-Aldrich) for 14 days in 6-well plates. hDPSCs in the undifferentiated group were cultured in DMEM with 10% FBS and no additional supplements. Samples can be collected for subsequent experiments and analysis after 14 days of odontogenic differentiation induction of hDPSCs. The specific methods followed the previous research [29].
Rapid-amplification of cDNA ends (RACE)
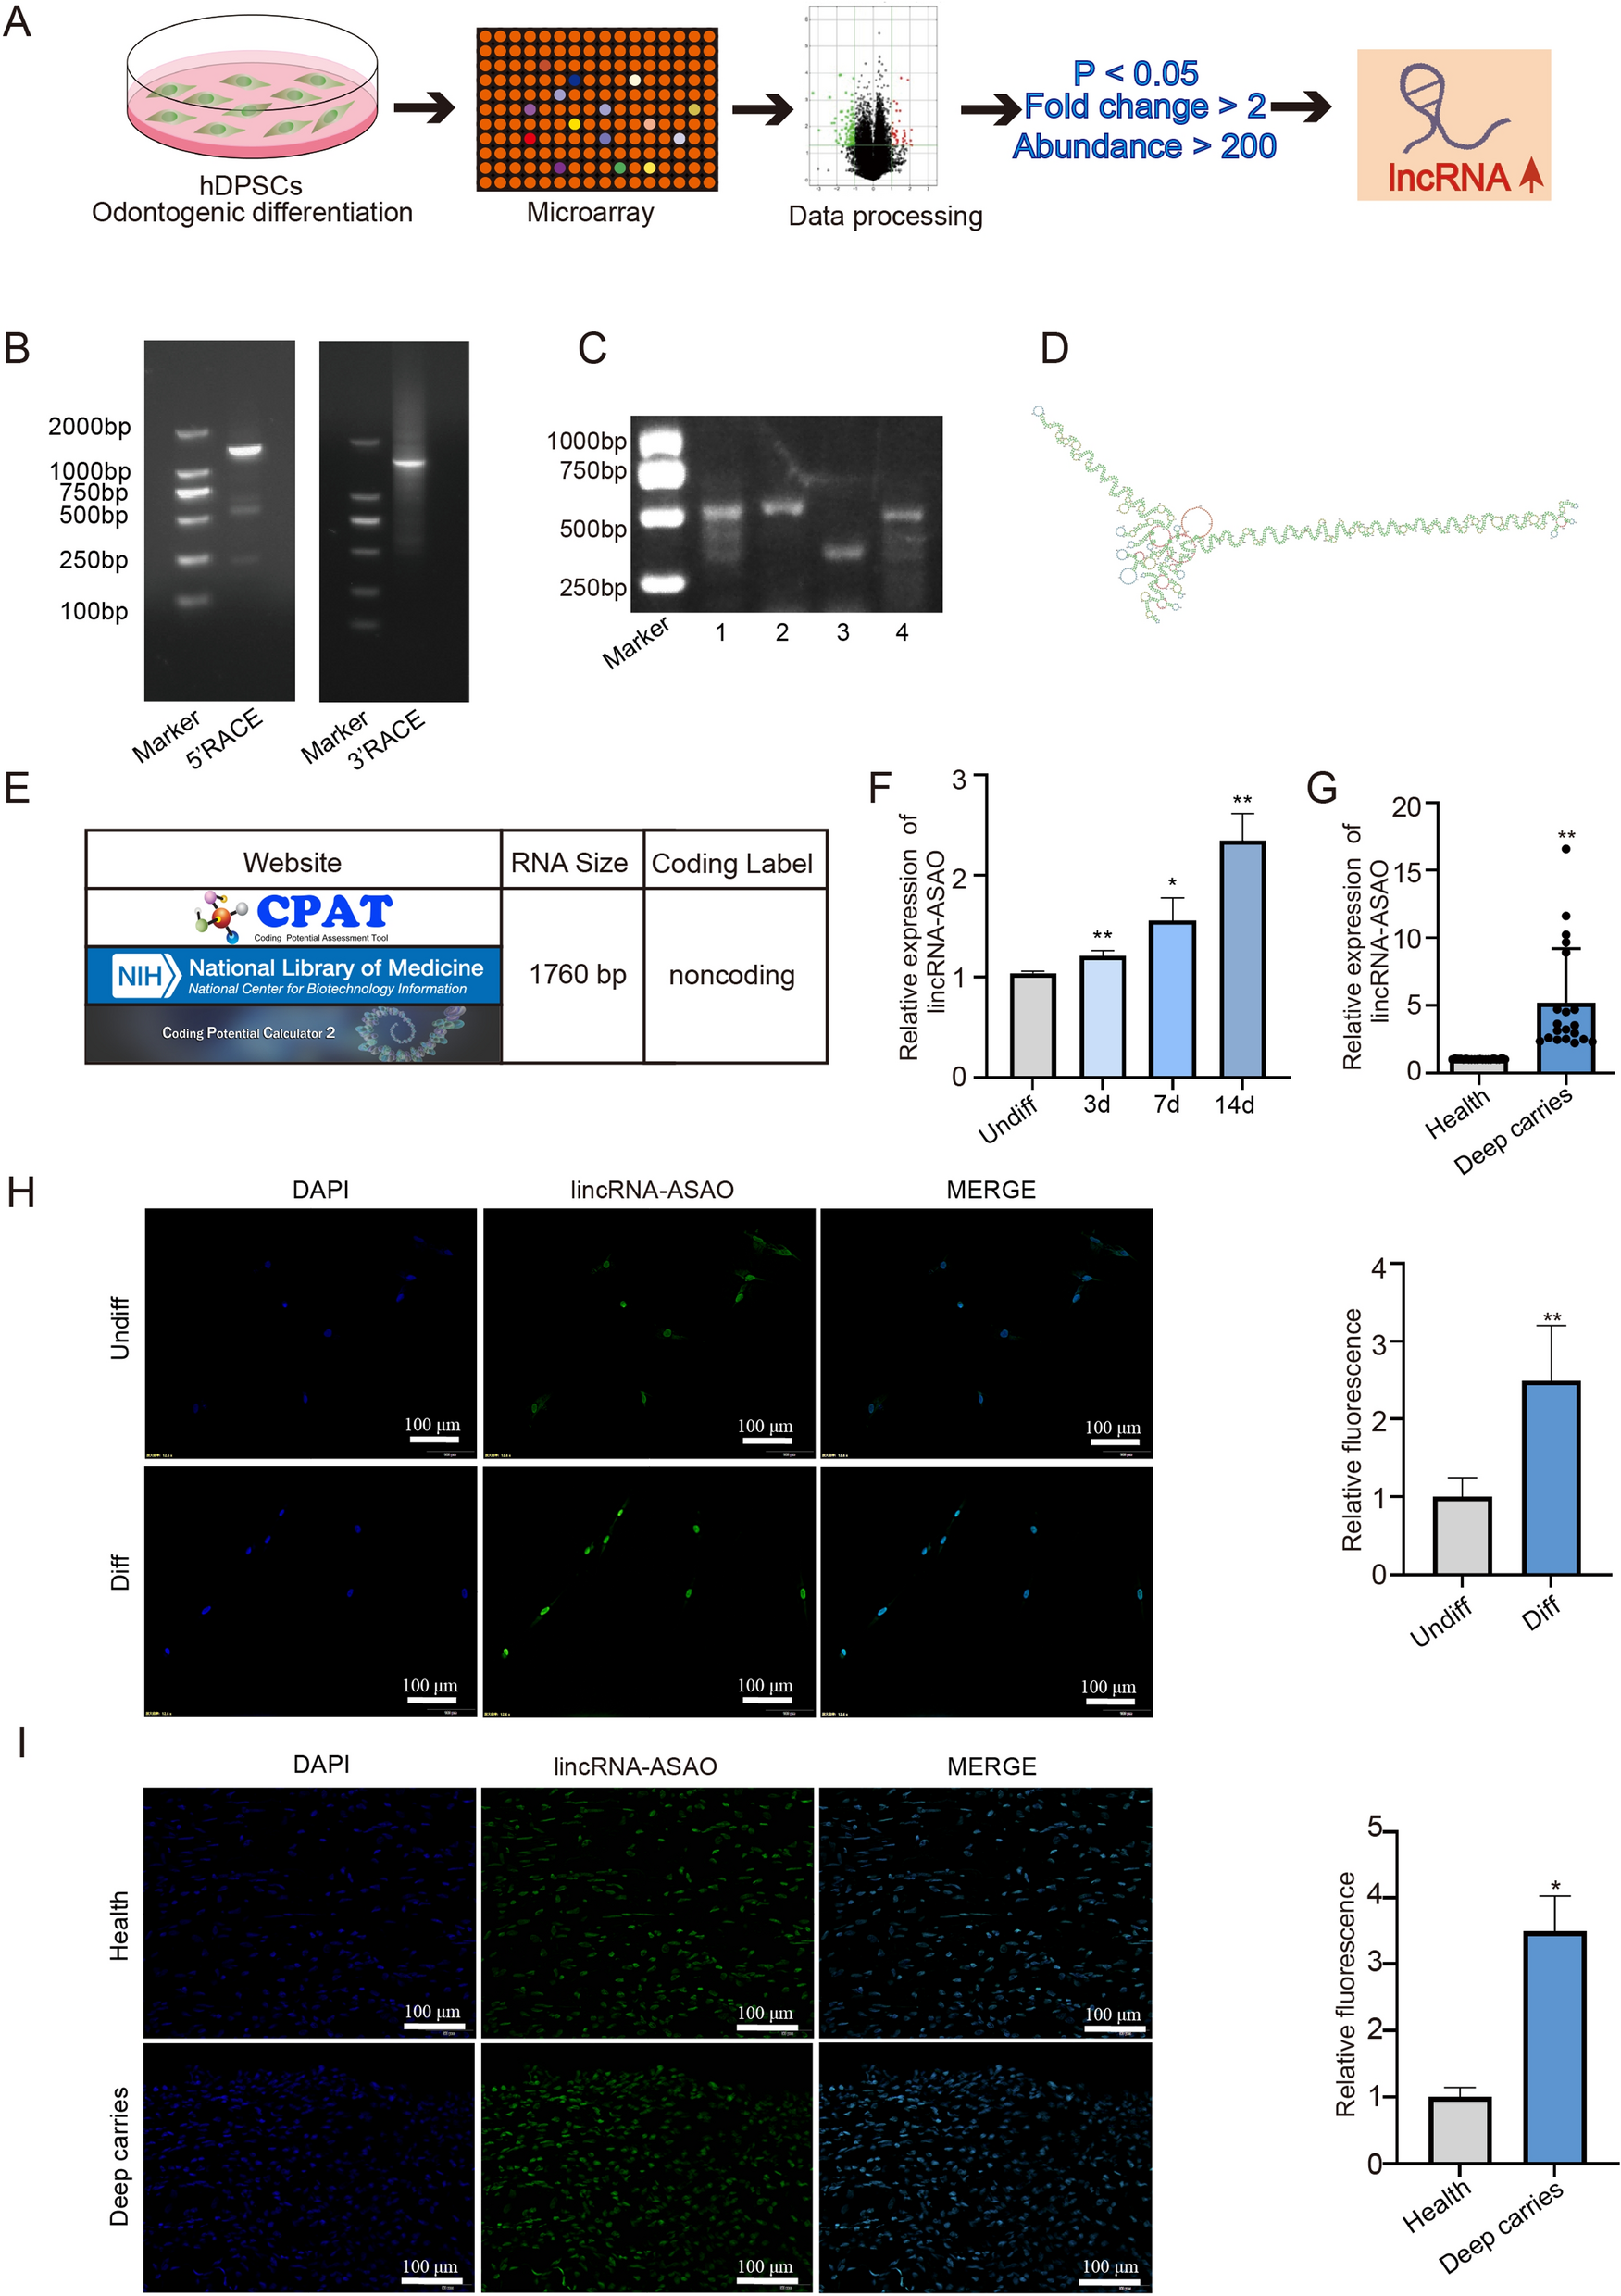
To obtain the full-length cDNA sequence, the RACE 5′/3′ Kit (Takara, 634858) was used for RACE. In brief, 1 μg of freshly isolated RNA from hDPSCs was used to generate the first-strand cDNA according to the experimental steps. The primer design was performed with Tm between 60 °C and 70 °C. The polymerase chain reaction (PCR) products were used for nested PCR to verify the 5′ and 3′ ends. The PCR products were extracted and purified from agarose gels before sequencing. After obtaining the full-length sequence, RNA samples from hDPSCs were collected and PCR was performed using four specific primers. The PCR products were separated by 1% agarose gel electrophoresis.
Lentivirus transduction
The overexpression plasmids of lincRNA-ASAO, Polypyrimidine Tract Binding Protein 1 (PTBP1 or hnRNPI), and the negative control group were designed and constructed by OBiO Technology (Shanghai, China). The vector components used for overexpressing lincRNA-ASAO included pASLenti-pA-MCS-CMV-EF1-mCherry-P2A-BSR-WPRE, while those used for overexpressing PTBP1 included pSLenti-SFH-EGFP-P2A-Puro-CMV-3xFLAG-WPRE. According to the manufacturer’s instructions, hDPSCs at passages 3–5 were seeded in cell culture flasks and transfected with the corresponding lentiviral vectors to generate stable cell lines for subsequent experiments. The transfection efficiency was validated by quantitative real-time quantitative PCR (qRT–PCR) and western blotting.
Short hairpin RNA (shRNA) oligos
The lincRNA-ASAO, PTBP1, and negative control group shRNA lentiviral vectors were designed and constructed by Genewell Company (Shenzhen, China). The vector components used for inhibiting lincRNA-ASAO included pCLenti-U6-shRNA-CMV-EGFP-F2A-BSR-WPRE, while those used to inhibit PTBP1 included pCLenti-U6-shRNA-CMV-mCherry-F2A-Neo-WPRE. The 3rd–5th generation hDPSCs were seeded in T25 flasks, transduced with the virus, and established as stable cell lines for subsequent experiments. The transfection efficiency was validated using qRT–PCR and western blotting.
RNA extraction and reverse transcription
The total RNA was extracted from the dental pulp tissue or hDPSCs using TRIzol reagent (Invitrogen, Life Technologies) according to the manufacturer’s protocol. The concentration and quality of RNA were measured using a NanoDrop ND-2000 spectrophotometer (ThermoFisher Scientific, Waltham, MA, USA). For cDNA synthesis, 1000 ng of total RNA was reverse transcribed using the PrimeScript RT Kit (TaKaRa, Shiga, Japan) according to the manufacturer’s instructions.
qRT–PCR
According to the manufacturer’s instructions, total RNA was extracted from tissues using the EZ-press RNA Purification Kit (ezbioscience, USA) and quantified using the NanoDrop ND-1000 spectrophotometer (Thermo Scientific, USA). qRT–PCR was performed on a Roche LightCycler®480 using the Color SYBR Green qPCR Master Mix ROX2 (ezbioscience, USA). Each reaction contained 5 µL of 2 × Color Green qPCR Master Mix, 0.2 µL of forward primer, 0.2 µL of reverse primer, 2.6 µL of RNase Free ddH2O, and 2 µL of reverse transcription product. The relative gene expression level was calculated using the 2-ΔΔCt method, and all experiments were repeated three times. The gene-specific primer sequences are listed in Table 2.
Table 2 The primer sequence used in qRT-PCRWestern blotting
Cellular total protein was extracted using protein lysis buffer. A 10% SDS-PAGE gel was prepared, and equal amounts of protein samples were loaded onto the gel. The separated proteins were then transferred to a PVDF membrane (Millipore Corporation, Billerica, MA, USA) with a pore size of 0.22 μm. Non-specific binding sites on the membrane were blocked with 5% milk at room temperature for 1 h. The membrane was then incubated overnight at 4 °C with the following antibodies: glyceraldehyde-3-phosphate dehydrogenase (GAPDH) (Proteintech, 10,494–1-AP), dentin sialophosphoprotein (DSPP) (Bioword, BS71212), and dentin matrix protein 1 (DMP-1) (Affinity, DF8825, RRID: AB_2842022). The membrane was then incubated with appropriate secondary antibodies at room temperature for 1 h, before exposing using Immobilon Western Chemiluminescent HRP Substrate (Millipore Corporation, Billerica, MA, USA). The protein bands were quantitatively analyzed using ImageJ software or other suitable image analysis tools.
ALP staining
On the seventh day of hDPSC culture, alkaline phosphatase (ALP) activity staining was performed using the NBT/BCIP staining kit (Beyotime Biotech, Shanghai, China). Cells were washed three times with phosphate buffered saline (PBS) and fixed with 4% paraformaldehyde for 15 min. After washing, hDPSCs were stained using the NBT/BCIP staining kit (Beyotime Biotech, Shanghai, China). The results for each group were photographed under an inverted microscope.
Alizarin Red S (ARS) staining
On the seventh day of hDPSC culture, calcium nodule staining was performed using ARS staining solution. The cells were washed three times with PBS and fixed with 4% paraformaldehyde for 15 min. After washing, the cells were stained with ARS staining solution. The results for each group were photographed under an inverted microscope.
Rat dental pulp regeneration model construction
hDPSCs were transfected with lentivirus and divided into LV-NC group and LV-lincRNA-ASAO group. hDPSCs were prepared to 1.0*105 cells/ml in PBS. The cells were divided into PBS group, hDPSCs group, LV-NC group and LV-lincRNA-ASAO group. Each group contained five rats. Male SD rats aged 5–6 weeks weighing 150–180 g. All SD rats were raised in an SPF-level animal breeding center. Due to the small size of the experiment, a lottery was used for allocation. Each rat had an equal chance of being assigned to either group. The animal protocol was prepared before the study, and this protocol was registered in the hospital animal ethic committee (IACUC-LAC-20220712–004).
2.5% of tribromoethyl alcohol anesthesia, the left side of the maxillary first molar exposed pulp. The pulp tissue was cleaned, rinsed with normal saline and placed into cells. Then, iRoot BP and glass ionomer were used for pulp capping. Rats that died during the procedure were excluded, and the number of rats in each group was increased to five by the inclusion of new rats. Four weeks later, the rats were anesthetized with an overdose of tribromoethyl alcohol and sacrificed by neck amputation. The tissue samples from the left maxilla are used for subsequent staining. The procedures of animal experiments were compliant with the ARRIVE guidelines.
Masson staining
Place the paraffin sections in xylene to remove the wax. Gradually hydrate the sections through an ethanol gradient. Stain according to the instructions in the Mason’s reagent kit. Rinse with distilled water to remove excess color. Dehydrate the sections through an ethanol gradient. Finally, immerse the sections in xylene for clearing. Cover the sections with a mounting medium and prepare for observation.
IHC staining
Paraffin sections were deparaffinized in xylene solution, then hydrated in a progressively decreasing concentration of alcohol solution, and finally rinsed with distilled water. Antigen repair was performed using sodium citrate buffer. The sections were treated using a milk blocking solution. The sections were incubated with the primary DSPP antibody (bs-10316R, Bioss) for 24 h at 4° C. Sections were treated with 3% hydrogen peroxide for 30 min. Unbound primary antibodies were removed by washing sections with TBS. The sections were incubated with a secondary antibody (PV-1022, Bioss). Unbound secondary antibodies were removed by washing sections with PBS. The addition of the chromogenic substrate DAB produced a color reaction. The nuclei were stained using hematoxylin. Dehydration was performed with a concentration gradient of ethanol, followed by clearing with xylene, and finally the plates were sealed with neutral resin. The staining results were observed under a microscope, and image analysis and data recording were performed.
HE staining
Paraffin-embedded sections were deparaffinized with xylene and then hydrated through a gradient concentration of ethanol. This was followed by hematoxylin staining followed by eosin staining. After staining, sections were cleared, sealed, and then examined under a microscope.
RNA sequencing
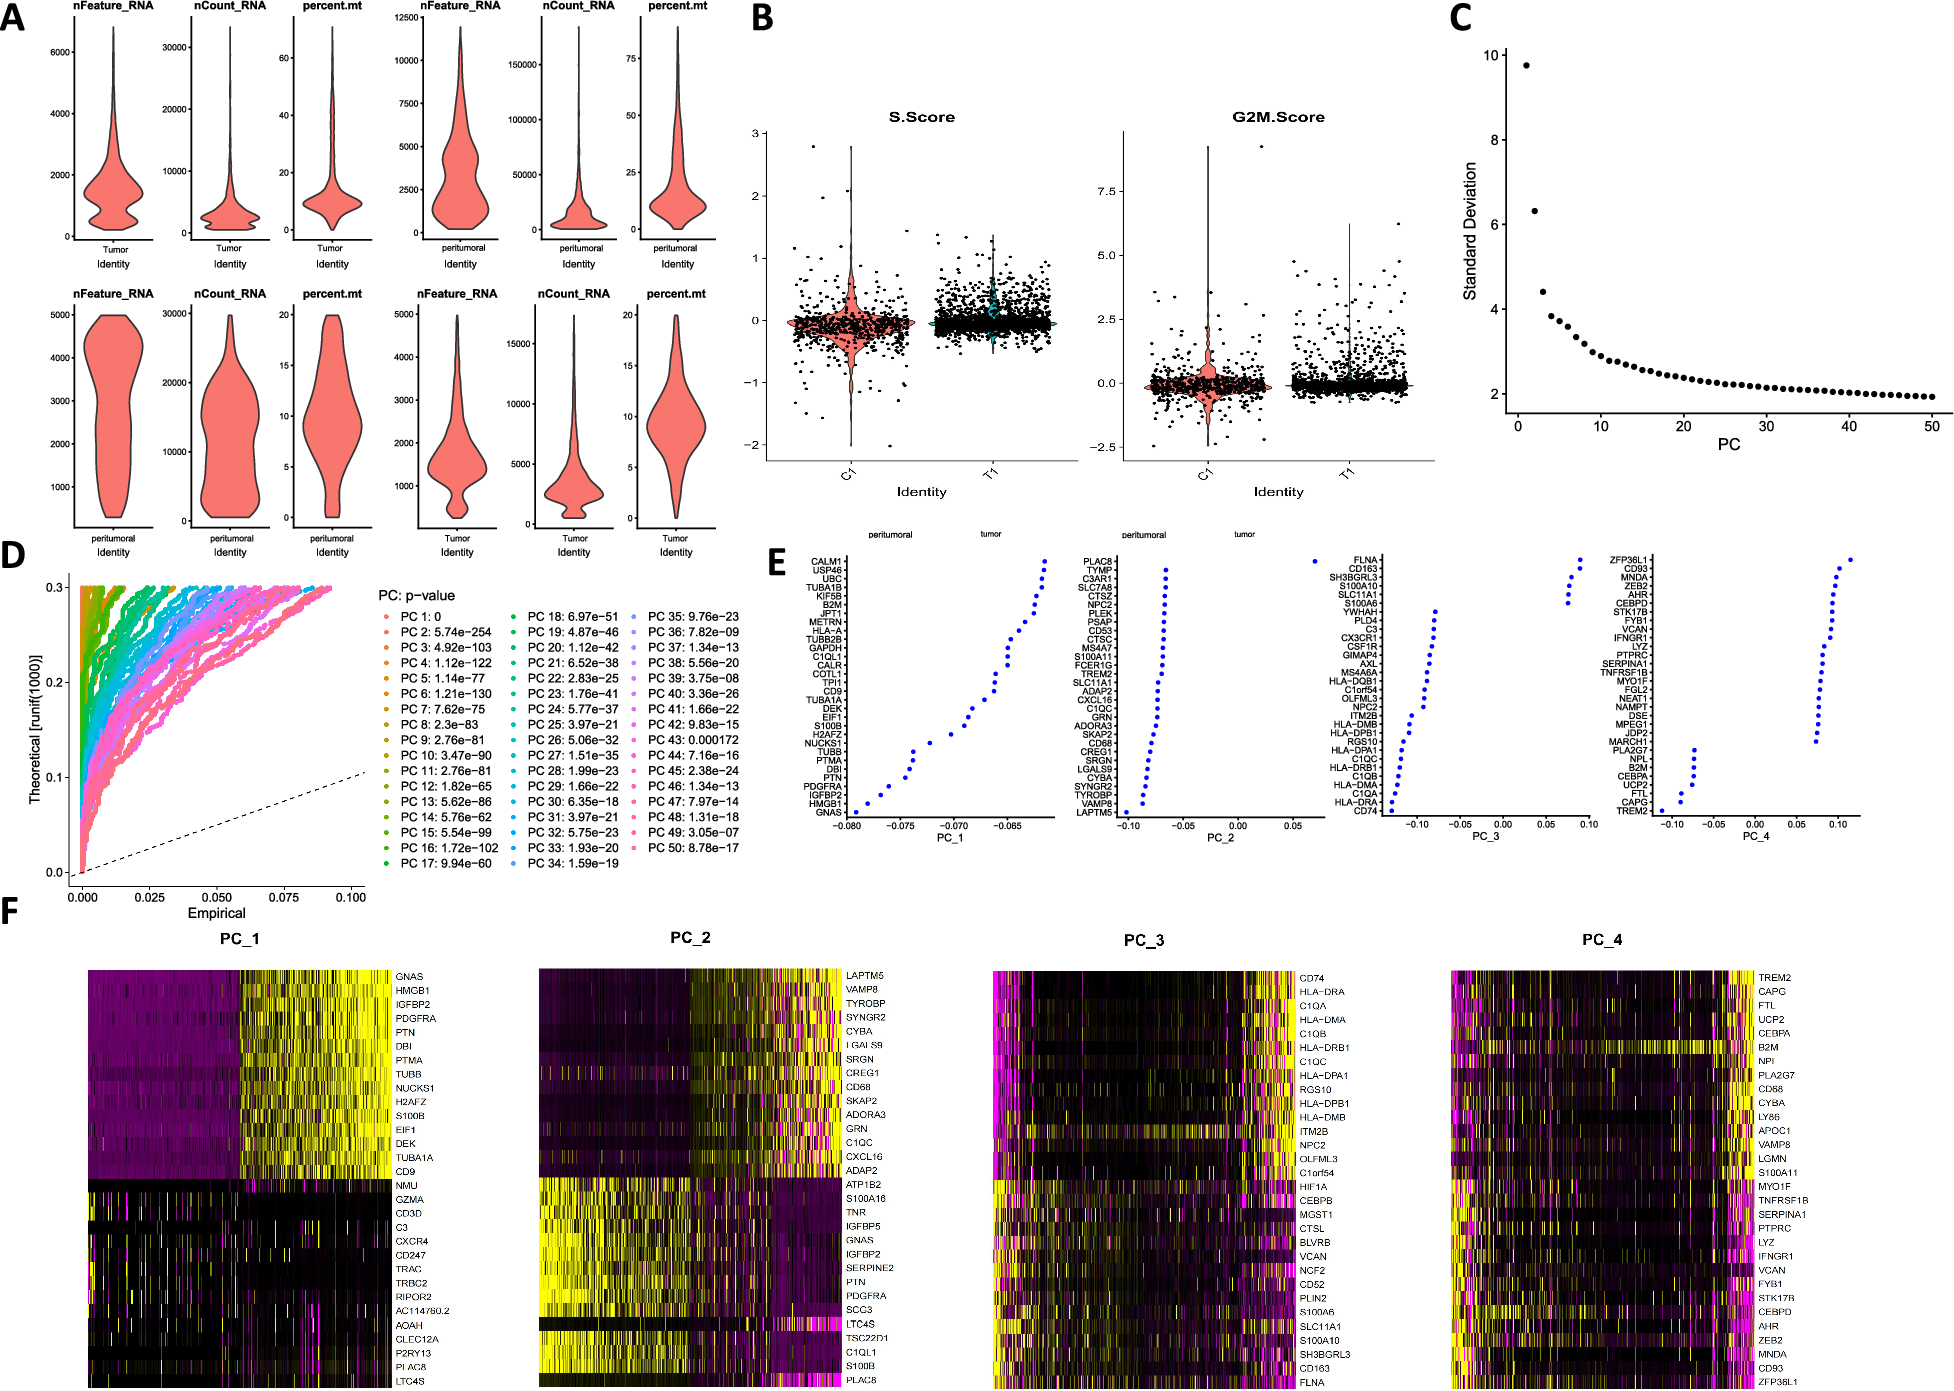
After inducing stable hDPSC cell lines overexpressing lincRNA-ASAO, PTBP1, and their negative control for 14 days toward odontoblast-like cells, total transcriptome RNA was collected and sent to Ribobio Company (Guangzhou, China) for sequencing. Total RNA was extracted from hDPSCs using TRIzol reagent (15,596,018, Invitrogen). RNA quality was assessed using agarose gel electrophoresis, with samples having an RNA integrity number (RIN) > 7.0 selected for subsequent analysis. PolyA-seq technology was used to capture mRNA with 3’ polyA tails in eukaryotes, detecting transcripts containing polyA tails. Sequencing was performed using Illumina NovaSeq 6000 with 150 bp paired-end reads. The raw sequencing data was quality assessed using FastQC and aligned to the reference genome with HISAT2. Differential expression analysis was performed using edgeR, with differentially expressed genes selected based on |log2(FoldChange)|> 1 and p < 0.05. Functional annotation and pathway analysis were performed using clusterProfiler, with a significance threshold of P < 0.05, to identify enriched Gene Ontology (GO) terms and KEGG pathways for differentially expressed genes.
rMATs analysis
The RNA-Seq alignment results were processed using the rMATs software to perform differential splicing analysis. Specifically, rMATs calculates changes in various splicing events, including Skipped exon, Mutually exclusive exon, Alternative 5’ splice site, Alternative 3’ splice site, and Retained intron, using BAM files and annotation files. Differential splicing analysis employed a standard statistical model, with a threshold of p < 0.05 to filter out significantly different splicing events for further analysis of their biological significance.
Fluorescence in situ hybridization (FISH)
Cell climbing slice samples were collected and fixed on glass slides. The samples were preprocessed according to the instructions (F12201, Genepharma) to enable the DNA to bind with the probes. We next prepared FITC-labeled lincRNA-ASAO probes complementary to the target lincRNA-ASAO sequence to be detected. The probes were incubated with the samples. After completing the hybridization of the probes and samples, the climbing slice was applied to subsequent IF experiments.
Immunofluorescence (IF)
IF experiments were conducted on cell climbing slices that underwent FISH. The slides were incubated with PTBP1 antibody (E4I3Q, Cell Signaling Technology) to bind to the intracellular PTBP1 protein, before washing away unbound antibodies and other impurities. CY3 fluorescent-labeled secondary antibody (ab6939, Abcam) was added to bind to the primary antibody, before washing away unbound secondary antibodies. The samples were observed using a fluorescence microscope, and fluorescence signals were detected at appropriate wavelengths.
RNA pull-down
An RNA pull-down KIT (Bes5102, China) was used for RPD detection according to the manufacturer’s instructions. The biotin-labeled lincRNA-ASAO probe and its antisense chain probe (BersinBio, China) were designed. Cell lysates from hDPSCs were collected and used in subsequent experiments after thorough lysis. The biotin-labeled probes were incubated with streptavidin-coated magnetic beads at room temperature for 25 min to form probe-bead complexes, which were then incubated with cell extracts at room temperature for 2 h to allow sufficient binding. The beads were washed five times in lysis buffer. Protein elution buffer was used to elute the proteins bound to the beads at 37 °C for 2 h. The separated protein samples on sodium dodecyl sulfate–polyacrylamide gel electrophoresis (SDS-PAGE) were selected for bands with differences and sent to allwegene (Beijing, China) for mass spectrometry analysis.
RNA immunoprecipitation (RIP) assay
According to the manufacturer’s instructions, the RNA immunoprecipitation (RIP) KIT (Bes5101, China) was used for RIP detection. Cell lysates prepared in buffer containing RNase inhibitor and protease inhibitor were precleared with PTBP1 antibody-coupled beads at 4 °C overnight. After washing with RIP wash buffer, the immunocomplexes bound to the beads were used for RNA isolation.
Photoactivatable-ribonucleoside-enhanced crosslinking and immunoprecipitation (PAR-CLIP)
By using the property of protein and RNA to undergo covalent cross-linking under 365 nm UV light, we screened specific binding sites between protein PTBP1 and lincRNA-ASAO/ALPL pre-mRNA. According to the manufacturer’s protocol (BersinBioTM CLIP-qPCR Ki, Bes3014-1), the immunoprecipitation of the PTBP1-RNA binding complex was performed to obtain digested (with proteinase K, DNaseI, RNase T1) RNA, followed by RNA 3’ end adapter ligation and primer design for detecting the enrichment efficiency of RNA-binding protein sites.
Agarose gel electrophoresis
After obtaining RNA samples, reverse transcription was performed and specific primers were designed for PCR amplification (P112-01, Vazyme) to obtain DNA products. A 3% agarose gel was prepared and loaded into the electrophoresis chamber, before loading the sample mixtures into the gel wells. Gel electrophoresis was run at a constant voltage of 120 V for 30 min to allow DNA fragments to migrate according to their sizes. The gel was stained with a nucleic acid dye to visualize DNA bands. A UV gel imaging system was used to observe the DNA band patterns on the gel and estimate the sizes of the target DNA fragments based on the migration distance and standard sample sizes (Table 3).
Table 3 The primer sequence used in RT-PCRStatistical analysis
Statistical analysis was performed using GraphPad Prism 9 to assess the differences between the groups. Statistical analysis of differences was conducted using a two-tailed Student’s t-test, with a P-value < 0.05 considered statistically significant.


Comments (0)