Preparation of samples for single-cell transcriptomics and high-throughput transcriptomics sequencing
Male C57BL/6 mice (strain: 219, Beijing Vital River Laboratory Animal Technology Co., Ltd., Beijing, China), aged six weeks, were reared under standard pathogen-free conditions. Before cell inoculation, the mice underwent acclimatization and health checks. A suspension of 5 × 10⁶ GL261 cells (bio-105911, Beijing BioBow Biotechnology Co., Ltd., Beijing, China) in 0.2 mL was subcutaneously injected into the dorsal skin of the mice. Tumor growth was regularly measured using calipers, and the mice were humanely euthanized according to ethical guidelines when the experiment ended, or tumor volume reached 100 mm3. Tumor and adjacent tissues were harvested for single-cell transcriptomics and high-throughput transcriptomics sequencing.
Single-cell sequencing data analysis
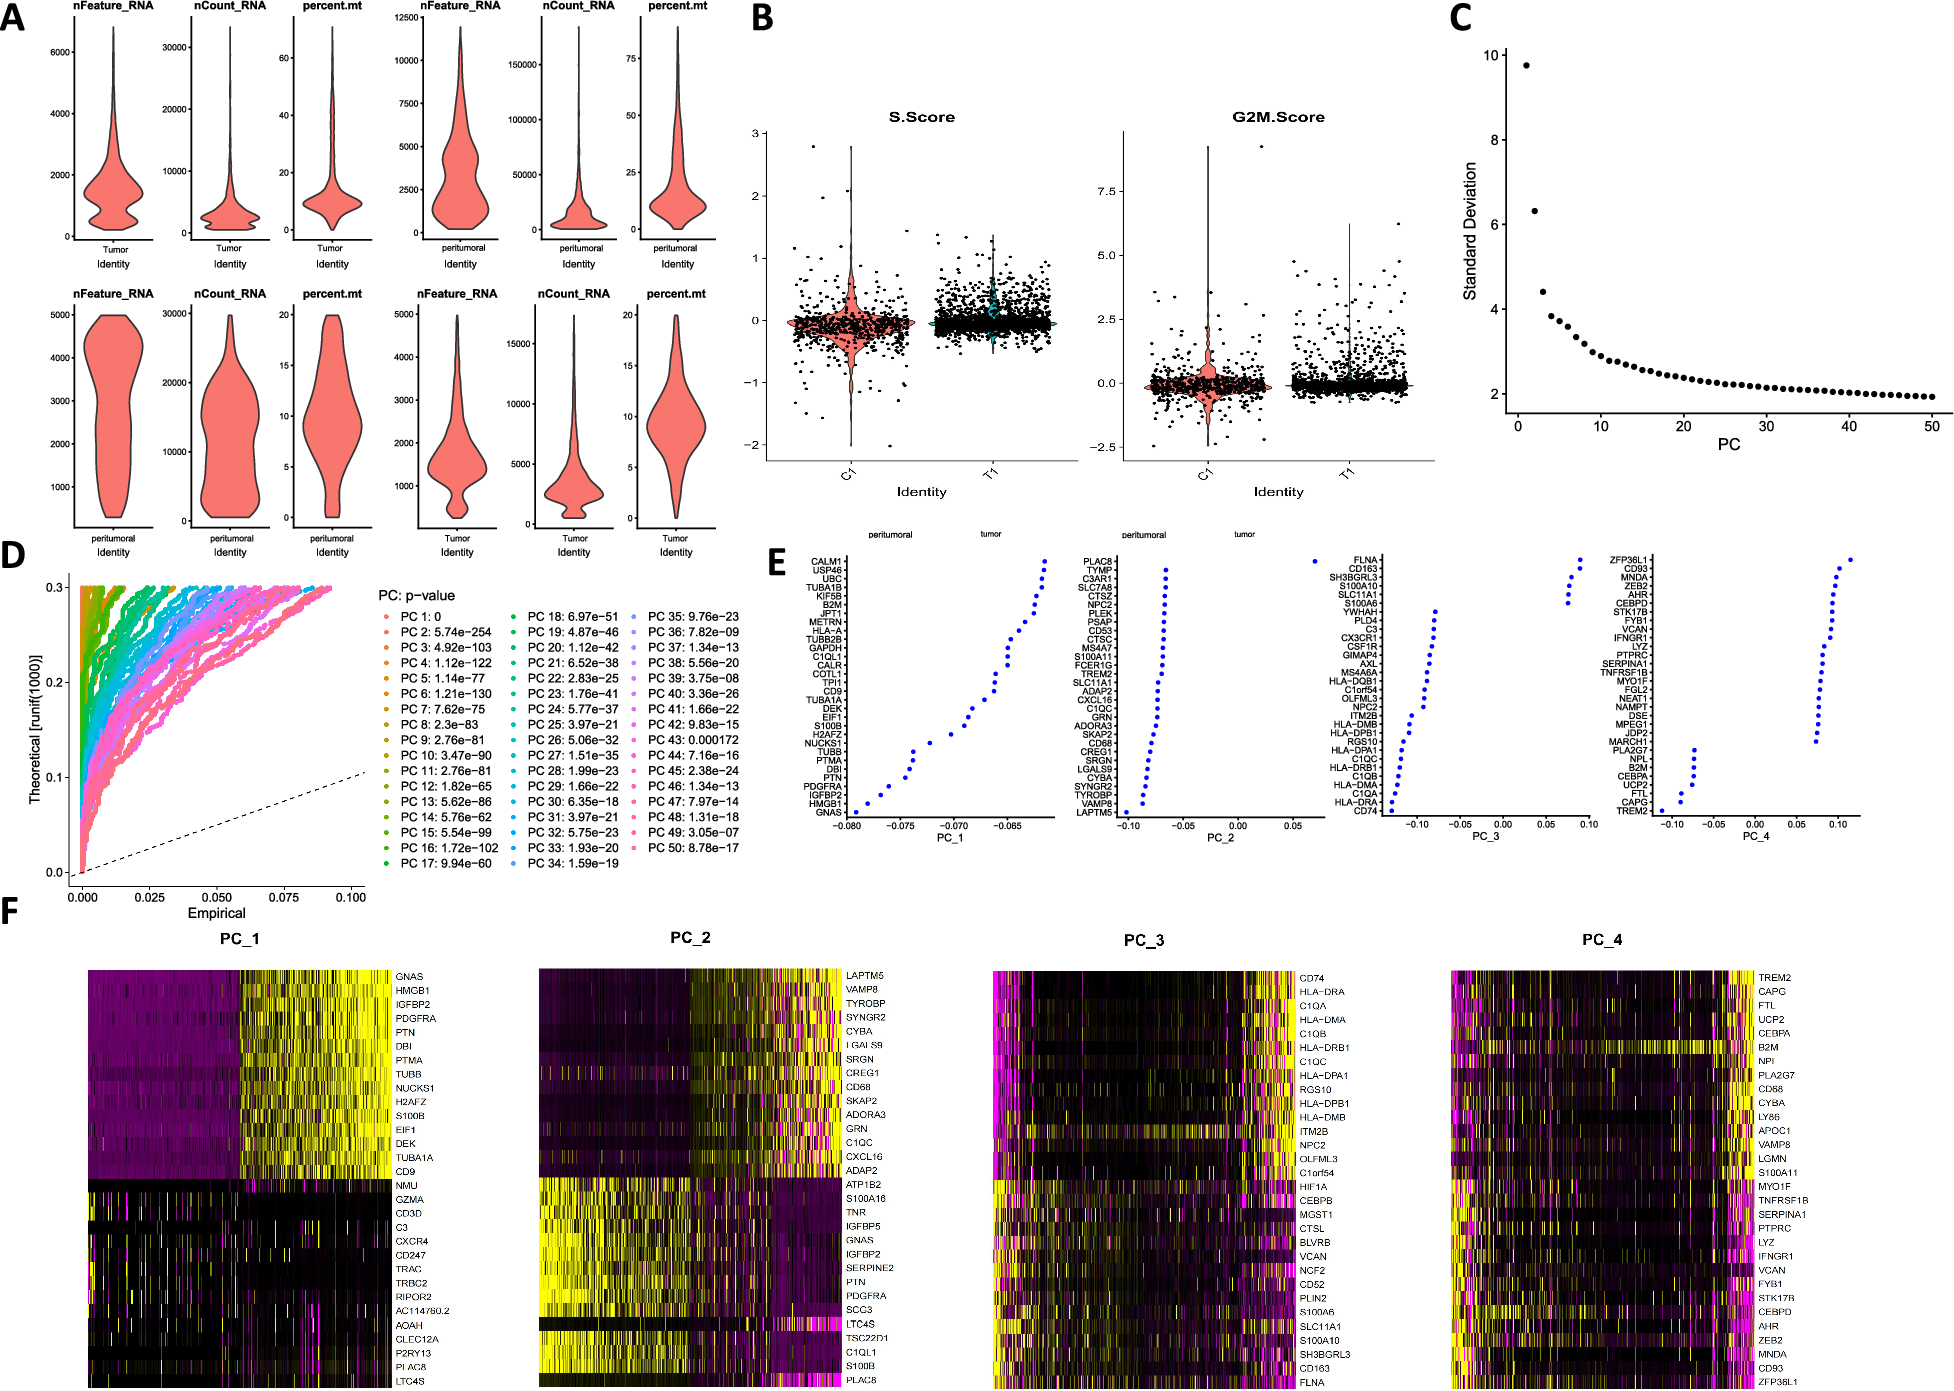
Tumor and adjacent non-tumor tissues from mouse models were selected for single-cell RNA sequencing (scRNA-seq). The analysis was conducted using the “Seurat” package in R software. Quality control steps were applied with filtering thresholds set as follows: nFeature_RNA > 500, nCount_RNA > 1000, nCount_RNA < 20,000, and percent.mt < 10. Canonical Correlation Analysis (CCA) was employed to eliminate batch effects, and data normalization was performed using the LogNormalize function. Principal Component Analysis (PCA) was subsequently conducted, and significant principal components were selected for t-SNE clustering analysis. The “SingleR” package was utilized to identify marker genes for each cell cluster, with the MouseRNAseqData function providing reference datasets for cell annotation. Statistical methods, including t-tests, were applied to compare the quantities and proportions of different cell types in cancerous and adjacent normal tissues. The results were visualized using the “ggplot2” package [48, 49].
Transcriptome sequencing analysis
Transcriptome sequencing was performed on tumor and adjacent tissues from three glioblastoma mouse models. Differential analysis was carried out using the “limma” package in R, with |logFC|> 1 and P < 0.05 as selection criteria for differentially expressed genes (DEGs). Volcano plots were generated using the “ggplot2” package in R, and heatmaps of differential gene expression were created with the “heatmap” package [50, 51].
Differential gene function enrichment analysis
Candidate target genes were subjected to Gene Ontology (GO), KEGG, and Reactome enrichment analyses using the “ClusterProfiler” package in R, with a significance threshold of P < 0.05. GO analysis included Biological Process (BP), Molecular Function (MF), and Cellular Component (CC), providing insights into the cellular functions and signaling pathways influenced by these genes [52].
LASSO regression analysis
LASSO regression, a mathematical modeling technique, was used to establish quantitative relationships between dependent and independent variables. The “glmnet()” function in R Studio software was applied to load the candidate gene matrix. Under the condition α = 1, an appropriate λ value was selected, and ten-fold cross-validation was conducted for internal validation to identify the optimal model [53].
Support vector machine-recursive feature elimination (SVM-RFE) analysis
The “e1071” and “caret” packages in R software were used to implement the Recursive Feature Elimination (RFE) algorithm for optimized gene selection. Gene expression data served as features, while clinical sample characteristics were treated as categorical variables. Support Vector Machine (SVM) with a linear kernel was utilized for prediction, and the RFE algorithm identified the best-performing gene features [54].
Construction of the random forest model
A random forest model was constructed using the “randomForest” function in R. Gene feature importance was assessed by calculating the “Mean Decrease Gini” in the decision tree. The top 30 genes were selected from a pool of 106 candidate genes based on this ranking [55].
Venn analysis
Venn analysis was conducted using the Draw Venn Diagram tool to obtain candidate genes [56].
Culturing glioblastoma cells and isolating tumor stem cells
Experiments utilized T98G (CRL-1690, ATCC, USA) and U251 (CC-Y5102, Shanghai Enzyme Research Biological Technology Co., Ltd., Shanghai, China) glioblastoma cell lines. Cells were cultured in high-glucose DMEM medium (11,965,118, Thermo Fisher Scientific, Waltham, MA, USA) supplemented with 10% fetal bovine serum (26,140,079, Thermo Fisher Scientific, Waltham, MA, USA) and 1% penicillin–streptomycin (100 U/mL penicillin and 100 μg/mL streptomycin). Once cells reached 80% confluency, tumor stem cells were isolated using flow cytometry (BD FACS Aria III, BD Biosciences, USA) with CD133-PE antibody (ab252128, Abcam, UK) and CD15-FITC antibody (ab18272, Abcam, UK).
Isolation and characterization of EVs
EVs were isolated from sorted tumor stem cells using a gradient centrifugation method with an ultracentrifuge (Optima XPN-100, Beckman Coulter, USA). Initially, the cell culture supernatant was centrifuged at 5000 g for 10 min to remove cell debris. The supernatant was then subjected to ultracentrifugation at 100,000 g to collect EVs. The morphology of the EVs was analyzed using transmission electron microscopy (JEM-1400Flash, JEOL, Japan), while their size distribution was determined using a nanoparticle tracking analysis system (NTA, NanoSight NS300, Malvern Panalytical, UK).
Diluted samples (1:20) were loaded onto Formvar-coated copper grids (5 µL). Grids were incubated for 20 min, followed by fixation with 2% paraformaldehyde for 5 min. The samples were washed with PBS, then fixed with 1% glutaraldehyde for 5 min, rinsed with Milli-Q water, and stained with 1.5% uranyl acetate for 4 min. Images were captured using a Gatan OneView 4 K camera operating at 200 kV, installed on a Jem-2100Plus (Jeol) microscope.
Dil staining
Before Dil staining, EVs were co-incubated with THP-1 cells (CC-Y1519, Shanghai Enzyme Research Biotechnology Co., Ltd., Shanghai, China). THP-1 cells were cultured in RPMI 1640 medium (L210KJ, Shanghai Enzyme Research Biotechnology Co., Ltd., Shanghai, China) supplemented with 10% fetal bovine serum and 1% penicillin–streptomycin at 37 °C in 5% CO2. Differentiation of THP-1 cells into macrophages was induced with 100 nM PMA (Sigma-Aldrich, USA) for 48 h. After 24 h of co-incubation, a Dil fluorescent tracer (Thermo Fisher Scientific, USA) was added to label EVs. A 1 mg/mL Dil solution was incubated with the EV-THP-1 cell culture at 37 °C for 30 min, followed by PBS washes to remove unbound dye. Microscopic observation and image acquisition were conducted using confocal laser scanning microscopy (Leica TCS SP8, Wetzlar, Germany). The experiment was repeated three times, with results validated through statistical analysis [57].
RT-qPCR
Cellular total RNA was extracted using Trizol reagent (15,596,026, Invitrogen, Carlsbad, CA, USA), and the concentration and purity of the extracted total RNA were assessed using a Nanodrop 2000 spectrophotometer (1011U, Nanodrop, USA). The RNA was reverse transcribed into cDNA following the instructions of the PrimeScript RT reagent Kit (RR047A, Takara, Japan) under the conditions of 42 °C for 30–50 min, followed by 85 °C for 5 s. Subsequently, qRT-PCR analysis was performed using the Fast SYBR Green PCR kit (RR820A, Takara, Japan) on an ABI PRISM 7300 RT-PCR system (Applied Biosystems). The reaction conditions included an initial denaturation at 95 °C for 5 min, followed by 40 cycles of denaturation at 95 °C for 30 s, annealing at 57 °C for 30 s, and extension at 72 °C for 30 s. Three technical replicates were set for each sample. GAPDH served as the internal control, and the relative gene expression was analyzed using the 2−ΔΔCt method, where ΔΔCt = (average Ct value of the target gene in the experimental group—average Ct value of the housekeeping gene in the experimental group)—(average Ct value of the target gene in the control group—average Ct value of the housekeeping gene in the control group) [58]. Each experiment was replicated three times. Primer sequences are listed in Table S1.
Western blot
Total protein was extracted using RIPA lysis buffer (P0013B, Beyotime, Shanghai, China) supplemented with 1% phenylmethanesulfonyl fluoride (PMSF), following the manufacturer’s protocol. Protein concentration was quantified with a BCA protein assay kit (P0011, Beyotime, Shanghai, China) and adjusted to 1 μg/μL. Samples were denatured at 100 °C for 10 min and stored at − 80 °C.
Proteins were separated on 8–12% SDS-PAGE gels at a constant voltage of 80–120 V for 2 h and transferred to PVDF membranes (1,620,177, Bio-Rad, USA) using a constant current of 250 mA for 90 min. Membranes were blocked in 1xTBST containing 5% skimmed milk at room temperature for 1 h, followed by incubation with primary antibodies overnight at 4 °C (antibody details in Table S2). Secondary antibody incubation with HRP-conjugated goat anti-rabbit or anti-mouse IgG (1:5000) was performed for 1 h. Protein bands were visualized using ECL reagents (1,705,062, Bio-Rad, USA) on an Image Quant LAS 4000C system (GE Healthcare, USA). Band intensities were quantified by comparing target proteins to β-actin controls, with experiments repeated three times [59].
Immunofluorescence staining
Cells were rinsed with cold PBS and fixed with 4% paraformaldehyde for 15–30 min. Subsequently, cells were permeabilized with 0.1% Triton (L885651, Macklin, Shanghai, China) for 15 min to penetrate the cell membrane. After two washes with PBS, cells were incubated in PBS containing 15% FBS overnight at 4 °C for 4 min. Clusterin (ab69644, diluted 1:200, Abcam, USA), CD206 (MA5-16,871, diluted 1:200, ThermoFisher), CD163 (ab182422, 1:200, abcam, USA), CD80 (ab254579, 1:200, abcam, USA), CD86 (ab239075, 1:100, abcam, USA) were added and incubated at 37 °C for 60 min. PBS wash was carried out for 5 min, repeated three times. Cells were then incubated with goat anti-rabbit IgG (H + L) (65–6111, ThermoFisher) and donkey anti-mouse IgG (H + L) (A21202, ThermoFisher) for 1 h at 37 °C, followed by 60 min avoiding light, and washed with PBS for 3 min, repeated three times. DAPI staining was performed for 10 min, followed by three washes with PBS. Finally, samples were mounted with a 20 μL mounting medium and immediately observed under a fluorescence microscope [60].
Construction and validation of temozolomide-resistant glioblastoma cell line
A temozolomide-resistant cell model was established using the T98G glioblastoma cell line. Initially, cells were seeded in 6-well plates coated with cell adhesion protein (176,740, ThermoFisher) and cultured for six months with increasing concentrations of temozolomide (PHR1437, Sigma-Aldrich, USA) ranging from 5 to 200 µM. The concentration of temozolomide was increased by 32.5 µM every four weeks. Once cells were able to proliferate at 200 µM temozolomide, the stable resistant cell line was established. The resistance phenotype was maintained by culturing cells in 200 µM temozolomide. At each concentration, cells were passaged when their survival density reached 80–90%. The culture medium containing temozolomide was replaced every 2–3 days [61].
Constructing lentivirus
Lentivirus packaging services were provided by Sangon Biotech (Shanghai, China). The pHAGE-puro series plasmid, along with auxiliary plasmids pSPAX2 and pMD2.G, and the pSuper-retro-puro series plasmid with auxiliary plasmids gag/pol and VSVG were co-transfected into 293 T cells (CRL-3216, ATCC, USA). Following 48 h of cell culture, the supernatant was collected, filtered through a 0.45 μm filter, and the concentrated virus was harvested by centrifugation. After 72 h, the supernatant was collected, concentrated by centrifugation, and a mixture of the two viruses was prepared and titrated. The lentiviral silencing sequences are shown in Table S3, and the silencing efficiency was validated in the T98G cell line, as illustrated in Fig. S1. Subsequently, the sequence with the most favorable silencing effect (Sh-Clusterin-2) was selected for experimentation [62].
For cell transfection, the working titer of the lentivirus was maintained at 5 × 10⁶ TU/mL, with a consistent incubation time of 48 h.
Co-culture of T98GR and THP-1 cells
Both cell types and appropriate media were prepared for co-culture. A Transwell chamber with a pore size of 0.4 µm was used, placing T98GR cells in the upper chamber and THP-1 cells in the lower chamber. Both cell types were seeded at a 1:1 ratio. THP-1 cells were seeded on the bottom of the culture dish below the Transwell insert, and T98GR cells were seeded on the membrane of the Transwell insert. Co-culture was performed with regular medium changes.
MTT assay
The MTT assay is utilized to analyze cell viability and determine the 50% inhibitory concentration (IC50). A total of 0.3 × 10⁴ cells were seeded in each well of a 96-well plate and incubated overnight. Subsequently, the cells were treated with various doses of MPA for 48 h. Following this, 10 μL of MTT solution (5 mg/mL in PBS, 11,465,007,001, Merck) was added to each well and incubated at 37 degrees Celsius for 4 h. The formazan crystals formed were then dissolved in 150 μL of dimethyl sulfoxide (DMSO; Sigma-Aldrich, St. Louis, Missouri, USA). Absorbance was measured at a wavelength of 550 nm [63].
CCK-8
Cells in a state of good growth were seeded in a 96-well plate at a density of 8 × 10³ cells per well and incubated in a culture chamber. At specific time points during the culture period (24 h, 48 h, and 72 h), 10 μL of CCK-8 solution (96,992, Sigma-Aldrich, USA) was added to each well. After incubation at 37 ℃ in a humidified incubator for 1 h, the absorbance of each sample was measured at 450 nm using the Epoch microplate spectrophotometer (Bio-Tek, Winooski, VT, USA). Each group was set up with 6 replicates, and the experiment was repeated 3 times [64, 65].
Transwell experiment
Following different treatments for 24 h, a Transwell invasion assay was conducted. The Transwell inserts with an 8 μm pore size were coated with 50 μL of basement membrane matrix (354,234, BD Biosciences, USA) and incubated at 37 °C for 30 min to allow gel solidification. The inserts were then rinsed with culture medium without FBS, and the cells were diluted to a concentration of 2.5 × 10⁴ cells/mL in an FBS-free medium. Subsequently, 100 μL of the cell suspension was added to each insert chamber, while 500 μL of medium containing 10% FBS was added to the lower chamber. After 24 h, the inserts were removed, the cells in the upper chamber were removed with a cotton swab, and the remaining cells were fixed with 4% PFA at room temperature for 30 min. Following fixation, cells were stained with 0.1% crystal violet for 30 min. Five random areas were selected, images were captured under an inverted microscope (IXplore Pro, Olympus, Japan), cell counting was performed, and the experiment was repeated three times. For the cell migration assay, no basement membrane matrix was added, while the remaining steps were identical to the invasion assay [66].
Experimental tumor transplantation in mice
Drawing upon the literature [67] and following the 3Rs principle (replace, reduce, refine), twenty-four CD34+ healthy 6-week-old humanized huHSC-(M-NSG) mice (NM-NSG-017) were obtained from Shanghai Southern Model Biotechnology Co., Ltd. (Shanghai, China) and housed in SPF-grade animal facilities at a humidity of 60–65% and a temperature of 22–25 ℃. The mice were acclimated for one week before the experiment, and their health status was assessed prior to the experiment. All animal procedures were approved by the Institutional Animal Care and Use Committee.
Prior to tumor cell injection, mice were anesthetized with intraperitoneal administration of 1–2% isoflurane (in oxygen) using a precision vaporizer to ensure adequate sedation and minimize discomfort. Anesthesia depth was monitored based on the absence of a pedal withdrawal reflex. Following anesthesia induction, the mice were placed in a sterile environment for the subcutaneous injection of tumor cells. Post-injection, the mice were monitored until they regained full consciousness. Minor weight loss and transient lethargy after EV injections were observed but resolved within 24 h; no unexpected adverse events occurred. The mice were randomly divided into four groups, each consisting of six mice. The groups were designated as follows:
(1)
PBS Group: T98G cells were subcutaneously injected, followed by daily oral administration of 50 mg/kg temozolomide and intravenous injection of PBS every three days.
(2)
EV Group: T98G cells were subcutaneously injected, followed by daily oral administration of 50 mg/kg temozolomide and intravesicular treatment every three days.
(3)
sh-NC + EV Group: Temozolomide-resistant T98G cells were subcutaneously injected, followed by intravenous injection of EVs collected from tumor stem cells transfected with sh-NC after two weeks. Subsequently, daily oral administration of 50 mg/kg temozolomide was performed, along with EV treatment administered intravenously every three days.
(4)
sh-Clusterin-EV Group: Temozolomide-resistant T98G cells were subcutaneously injected, followed by intravenous injection of EVs collected from tumor stem cells transfected with sh-Clusterin after two weeks. Subsequently, daily oral administration of 50 mg/kg temozolomide was performed, along with EV treatment administered intravenously every three days.
Specifically, drug-resistant T98G cells (5 × 10⁶/0.2 mL) were injected subcutaneously into the back of Rag1−/− mice. The width (W) and length (L) of the tumors in nude mice of each group were measured weekly using a caliper to monitor tumor growth. The tumor volume (V) was calculated using the formula V = (W2 × L)/2. When the tumor volume reached approximately 100 mm3, EVs isolated from tumor stem cells (200 µg per dose) were administered via tail vein injection every three days. For the PBS group, an equivalent volume of PBS was injected via the tail vein every three days as a control. After 40 days, mice were euthanized following ethical guidelines. Prior to euthanasia, animals were anesthetized using 5% isoflurane in oxygen. Cervical dislocation was then performed by placing the mouse on a firm surface, gently restraining the head with one hand, and quickly pulling the tail downward with the other hand to dislocate the cervical spine, ensuring a rapid and painless process. Tumor tissues were then collected.
Tumors were dissected and weighed, with the tissue divided into two portions: one was fixed in 4% paraformaldehyde for staining, and the other was frozen in liquid nitrogen and stored at − 80 °C for subsequent experimental analysis [68, 69].
Hematoxylin and eosin staining
Tissue sections were first stained in a container containing a solution of hematoxylin (Sigma-Aldrich, USA) for 5 min to stain the cell nuclei. Subsequently, rapid destaining was performed in a container containing 1% acidic alcohol, followed by staining in eosin solution (Sigma-Aldrich, USA) for 3 min to stain the cytoplasm and intercellular matrix. Post-staining, the sections were dehydrated twice in 95% alcohol, cleared, and mounted with neutral resin. Morphological images were observed and captured using an optical microscope (Leica Microsystems, Germany). Image analysis was conducted using ImageJ software (NIH, USA, version 1.52a) for quantitative assessment of nuclear and cytoplasmic features. All procedures were conducted at room temperature, ensuring rinsing of excess dye with distilled water after each step. At least three sections were prepared under each experimental condition and the procedures were repeated three times to ensure result reproducibility.
Immunohistochemical staining
The paraffin embedding process began by cooling molten paraffin on ice or in a 4 °C refrigerator before embedding tissue slices. Paraffin-embedded slices were air-dried overnight and baked at 60 °C for 20 min. The slices were immersed in xylene twice for 10 min each, followed by dehydration in absolute alcohol twice for 5 min. Hydration was performed sequentially in 95 and 70% alcohol for 10 min each, followed by a 5 min wash in distilled water. Antigen retrieval was conducted by microwaving slices in citrate buffer (pH 6.0) at high power for 1 min and 20 s, then cooling to room temperature and washing with PBS three times for 3 min each. Endogenous enzymes were inactivated with 3% H₂O₂ for 10 min at room temperature, followed by PBS washes.
Slides were blocked with normal goat serum (E510009, GenePharma) at room temperature for 20 min, then incubated overnight at 4 °C with primary antibodies for clusterin (ab92548), CD206 (ab64693), and CD80 (ab134120) (Abcam). After washing, slides were treated with biotinylated goat anti-mouse/rabbit IgG polymer (pv6000/pv9000, Zhongsheng Golden Bridge) for 30 min and stained using a DAB chromogenic reagent kit (ZLI-9018, Zhongsheng Golden Bridge). Staining was observed and photographed under a microscope [70].
For the analysis of antibody-positive areas in IHC images, TIFF image files were opened in ImageJ and converted to 8-bit grayscale images. Representative samples of minimum, maximum, and intermediate staining intensities were displayed to establish optimal threshold values. The threshold was determined to accurately reflect staining patterns under all experimental conditions and kept consistent across all images in the cohort. Black-and-white images of selected regions of interest were then generated, and the “Analyze Particles” function was used to quantify the percentage of stained area. At least six views from each sample region were analyzed and averaged [71].
Statistical analysis methods
All data were processed using GraphPad Prism 8.0. Continuous data were presented as mean ± standard deviation (Mean ± SD). Multiple statistical analysis methods were employed in this study to process and interpret data effectively. The comparison between the two groups was conducted using an unpaired t-test, while the comparison among multiple groups was performed utilizing one-way analysis of variance (ANOVA). Homogeneity of variance was assessed using the Levene test. If the variances were homogeneous, pairwise comparisons were conducted using Dunnett’s t and LSD-t tests. In cases of inhomogeneous variances, Dunnett’s T3 test was applied. Spearman or Pearson analysis was employed to examine the correlation between genes and the content of immune cells. A significance level of P < 0.05 indicated statistical significance in the comparison between two groups.
This study has been conducted and reported in accordance with the ARRIVE guidelines 2.0


Comments (0)