
Remember me


Briefly, 5 mg of 2c and 50 mg of PLGA (75:25) were dissolved in 3 ml of organic solvent mixture [Dichloromethane (DCM): Acetone:: 4:1 v/v]. This solution was emulsified with 1.5 ml of 2.5% aqueous PVA by homogenizing at 20,000 rpm for 3 min using a high-speed homogenizer (IKA Laboratory Equipment, Model T10B, Ultra-Turrax, Staufen, Germany). The emulsion thus obtained was further emulsified with 75 ml of 1.5% aqueous PVA solution by homogenizing at 20,000 rpm for about 10 min to get a w/o/w type double emulsion [15]. Size reduction of the emulsion droplets was carried out by sonication in a bath-sonicator for 30 min. The final double emulsion was then stirred overnight on a magnetic stirrer at room temperature for the removal of organic solvents and the subsequent formation of polymeric nanoparticles. The nanoparticles were then separated from the dispersion by centrifugation: once at 5000 rpm for 10 min, followed by centrifugation of the supernatant at 16,000 rpm for 45 min. Separated nanoparticles were washed twice with double distilled water to remove excess PVA attached to them and finally lyophilized in a freeze dryer (Laboratory Freeze Dryer, Instrumentation India, Kolkata, India) to get dry powder.
Conjugation of aptamer on the surface of nanoparticles2cNP was first suspended in a 5 mg/mL concentration in deionized water and then agitated with 200 mM of EDC and 100 mM of NHS for 30 min at 25 °C. The resulting 2cNP with activated COOH groups was then washed with DNase-RNase free water to remove excess EDC/NHS [16, 17]. A portion of 0.5 mg/mL of aptamer solution was allowed to denature–renature by keeping it at 85 °C for 10 min, followed by cooling in an ice-water bath for 10 min. The activated 2cNP dispersion was then mixed with the denatured–renatured aptamer and allowed to react for at least 6 h with slow rotation. The covalently linked Apt-2cNP was finally rinsed with deionized water [18].
Confirmation of aptamer conjugation by agarose gel electrophoresis and XPS analysisConfirming the successful conjugation of aptamers to nanoparticles is a crucial step in aptamer-based drug carriers. The aptamer conjugation on 2cNP nanoparticles was confirmed by agarose gel electrophoresis. Samples were loaded inside the well of the gel in the following sequence: DNA marker, 2cNP, free aptamer, Apt-2cNP. Ethidium bromide (0.5 mg/mL) was added to visualize nucleic acids. The electrophoresis was carried out at 50 V for 160 min.
XPS is a surface-sensitive analytical technique that quantifies the elemental composition and chemical state of a material’s surface by analyzing the kinetic energy and binding energy of emitted photoelectrons. X-ray photoelectron spectroscopy (XPS) analysis was carried out for 2c, 2cNP, and Apt-2cNP in an Omicron Multiprobe Electron Spectroscopy System using a monochromated X-ray of 200 eV emitting from an AI Kα type source gun [20].
Analysis of nanoparticle morphologyThe analysis of nanoparticles’ morphology, encompassing their shape, size, and structure, holds significant importance across diverse fields such as materials science, catalysis, and biotechnology. Field Emission Scanning Electron Microscopy (FESEM) stands out as a widely utilized and potent technique for this purpose. The morphology of dry nanoparticles after aptamer conjugation was observed using field emission scanning electron microscopy. An appropriate amount of Apt-2cNP was mounted on carbon tape, attached with a metal stub, and coated with gold using a sputter coater (around 4 nm layer thickness), and observed under a field emission scanning electron microscope (JEOL JSM-7600F, Japan) at 20,000 × magnification. Atomic Force Microscopy (AFM) serves as a potent tool for examining nanoparticle morphology, offering high-resolution topographical details and precise measurements of particle size, shape, and distribution. Atomic force microscopy was utilized to observe the surface morphology of aptamer-conjugated nanoparticles in wet conditions. Dry nanoparticle powder (Apt-2cNP) was dispersed in MilliQ water at a concentration of 100 μg/ml with the help of brief sonication and vortexing. The suspension of nanoparticles was then filtered with a 0.22 μm filter to eliminate any preformed large particles. 5 μl of this filtered dispersion was placed on a freshly cleaved mica sheet and allowed to air dry at room temperature. After evaporating water, the thin clear layer formed on the mica sheet was examined under an AFM instrument (5500 Agilent Technologies, Santa Clara, CA, USA) in search of nanoparticles. The scanning was carried out under ambient conditions in tapping mode using a silicon nitride probe having a resonance frequency and a force constant of 150–350 kHz and 0.4 N/m, respectively. The images were captured over a 9 μm × 9 μm and were analyzed with the help of Agilent Pico View software (version 1.12). Cryo-Transmission Electron Microscopy (Cryo-TEM) emerges as another powerful method for scrutinizing the morphology of nanoparticles in their natural state, furnishing detailed structural data at high resolutions without the necessity of staining or desiccating the sample [20, 21]. The internal structure of Apt-2cNP was analyzed using cryo-transmission electron microscopy. Apt-2cNP was dispersed in MilliQ water to attain approximately a 50 μg/ml concentration, and 5 μl from this solution was mounted on a 300 mesh carbon-coated copper grid (previously glow discharged to minimize charge interaction). Then, it was plunge-frozen in liquid ethane, and excess liquid was removed with specially designed filter paper using a Vitrobot instrument (FEI Company, USA). The copper grid was then transferred to a cryoholder and observed in a Technai POLARA (FEI Company, Oregon, USA) electron microscope, empowered by a 300 kV field emission gun (FEG). Images were captured in a 4 k × 4 k charge-coupled device (CCD) camera.
Determination of drug loading (%) and entrapment efficiency (%)The drug (2c) was extracted from 2 mg of Apt-2cNP to determine the drug loading by dissolving in 2 ml of a solvent mixture of acetonitrile: water:: 85:15 (v/v) using an incubator shaker for 4 h [16]. The insoluble fraction of nanoparticles was separated by cold centrifugation at 16,000 rpm for 15 min, and the clear supernatant was collected for spectrophotometric analysis at the corresponding λmax of 340 nm. The concentration of the drug was calculated from a prepared calibration curve.
Drug loading was estimated using the following equation:
$$\,\text(\text) =\frac}}\times 100.$$
(1)
Entrapment efficiency was calculated using the following equation:
$$\,}=\frac(\text) ()}(\text) ()}\times 100.$$
(2)
In vitro drug release studyThe evaluation of in vitro drug release is essential for assessing the efficacy of nanoparticle-based drug delivery systems and comprehending their drug release kinetics. These studies yield valuable insights into the rate and extent of drug release from nanoparticles under controlled conditions, thus facilitating predictions regarding their in vivo behavior.
Drug release behavior from Apt-2cNP was studied in phosphate-buffer saline (PBS), in PBS containing 0.5% β-cyclodextrin (β-CD), and in sodium acetate buffer of pH 5.5. 2 ml of Apt-2cNP suspension (1 mg/ml) in respective buffer was placed in an Eppendorf tube and was agitated in an incubator shaker (Somax Incubator Shaker; ShenjhenPango Electronic Co. Ltd., Shenzhen, China) at 37 °C [13, 22]. 1 ml of suspension was withdrawn from this vial at different time intervals (0.5 h, 1 h, 2 h, 4 h, 6 h, 8 h, 10 h, 12 h, 24 h, 48 h, 72 h, 168 h, 336 h, 504 h, 672 h, 840 h, 1008 h, 1128 h, 1344 h, 1512 h), centrifuged and the supernatants were analyzed for drug content using UV–visible spectroscopy. The pellet obtained on each centrifugation was redispersed by adding 1 ml of fresh PBS (containing 0.5% β-cyclodextrin) for every withdrawal. A cumulative % drug release vs time curve was generated using a calibration curve. The kinetics of drug release from Apt-2cNP were studied following different kinetic models such as zero order, first order, Higuchi, Hixon-Crowell, and Korsmeyer-Peppas models.
Molecular docking analysisMolecular docking analysis is a computational technique used in structural bioinformatics and molecular modeling to predict the preferred orientation and binding affinity of a small molecule (ligand) when bound to a target macromolecule (receptor), such as a protein or nucleic acid. This method plays a crucial role in drug discovery, lead optimization, and understanding molecular interactions at the atomic level. The X-ray crystallographic structures of topoisomerase-I and topoisomerase-II enzymes were downloaded from the RCSB website, and their pdb codes are 1A36 and 2RGR, respectively [21, 22]. The energy-minimized structures of BA and 2c were obtained from Density functional theory (DFT) calculations with B3LYP functional and 6–311 g basis sets using Gaussian 09W [23]. The same method was used for the molecular electrostatic potential map calculations. These structures were utilized in the docking calculations. The Genetic-Lamarckian algorithm was used for the docking calculations with the help of AutoDock4.2 [24] using a 60 × 60 × 60 grid box. Chimera 1.10.2 [25] was used for the visualization of docking results.
To conduct the molecular docking investigation, we chose the receptor as the epithelial cell adhesion molecule to which the aptamer can bind precisely in silico. In this study, “in-silico” predictions give an understanding of the binding capability of the compound (2c) to the topoisomerase proteins. The H-bond formation and the hydrophobic interaction ability of betulinic acid derivative (2c) suggest its preferentially binding with TIase-II over BA (a well-known TIase-II inhibitor). The predictions support the factual findings of the manuscript. We have found that 2c inhibited the function of topoisomerase II enzymes (TOP2A and TOP 2B), leading to DNA chain-break and cell cycle arrest, inducing cancer cell death.
The crystal structure of the EpCAM, 4MZV, was received from the RCSB protein data bank, and the DNA aptamer structure was generated in the Discovery studio visualizer 2021 by inserting the 71 bp DNA sequence and converting it to PDB format. Initially, the receptor was prepared by removing water molecules and replacing them with polar hydrogen atoms and charges. The ligand molecule was then prepared for docking analysis utilizing Discovery Studio Visualizer 2021. Further interactions between the aptamer and EPCAM were investigated using the HDOCK blind docking service (http://hdock.phys.hust.edu.cn/) [26]. In the docking procedure, the initial step was to provide inputs for the receptor and ligand. The docking score assesses the quality of a projected protein-nucleotide binding mechanism. The docking study was carried out using the Discovery Studio 2021 Client Program. The interactions were depicted with the help of Biovia Discovery Studio 2021 [27].
MTT assayThe MTT assay measures toxicity response against a treatment to a cell, and cell viability. It is widely employed in various fields, including cell biology, cancer research, and drug development studies. The cytotoxic effect of free drug (2c), 2cNP, and Apt-2cNP in colorectal cancer cell lines was evaluated on HT-29 and HCT-116 cell lines. After 48 h of incubation, the experimental procedure and quantitative data analysis were conducted using the previously reported method [7]. The detailed methodology is described in the supplementary file.
In vitro cellular uptake studyAn in vitro cellular uptake study evaluates the cellular internalization and accumulation of various molecules, nanoparticles, or other materials under controlled laboratory conditions. Cellular uptake of Cy5 conjugated nanoparticles was quantified by flow cytometer (BD LSR Fortessa, BD Biosciences) using the channel for Cy5 (Excitation/ Emission 645 nm/664 nm). The data was analyzed using FACS Diva software [28]. Additionally, the cells were observed under a confocal laser microscope (Olympus FluoView FV10i, Olympus) using the filters for Cy5 (Excitation/ Emission 645 nm/664 nm) and DAPI (Excitation /Emission 359 nm/461 nm) [29, 30].
Apoptosis assayAn apoptosis assay detects and quantifies programmed cell death (apoptosis) in cell populations. It demonstrates the cellular death process through various treatments to understand treatment efficacies in cancer cell elimination. We monitored the cell death induction mechanisms in colorectal cancer cells after treatment with 2c, 2cNP, and Apt-2cNP for 24 h and 48 h. HT-29 and HCT116 cells were seeded in 60 mm tissue culture dishes at a density of 1 × 10⁶ per dish and incubated overnight in a humidified incubator at 37 °C. After that, the cells were treated with 2c, 2cNP, and Apt-2cNP with respective IC50 concentrations for 24 h and 48 h to evaluate apoptotic cell death induction. Two parallel groups were run with media alone to provide the control and the 'unstained' group (the cells that were untreated and were not stained with any dye during analysis). After completion of treatment, the supernatant was removed, and the cells were carefully washed with PBS to remove residuals from the formulations. The cells were then detached through trypsinization and redispersed in 1 × binding buffer after washing with PBS (pH 7.4). 5 µl of Annexin V-FITC (BD Bioscience) was added to this 100 µl cell suspension and incubated for 20 min in the dark [31]. After that, the cells were diluted with an additional 400 µl binding buffer (1 ×), and 5 µl of propidium iodide solution (1 mg/ml stock) was added to the cells in a light-protected condition before acquisition in FACS. The cells were then transferred to a FACS tube and analyzed in a flow cytometer (BD LSR Fortessa, BD Bioscience) to determine the proportions of live, dead and apoptotic cells.
Determination of mitochondrial membrane depolarizationDetermining mitochondrial membrane depolarization assesses mitochondrial functional status and apoptosis induction potential or cellular stress. A loss or disruption of membrane potential is often associated with mitochondrial dysfunction and can trigger apoptotic signaling pathways. Mitochondrial membrane depolarization is a key marker of apoptosis induction. Thus, we followed the standard method for measuring mitochondrial membrane potential using FACS by fluorescence emission after JC-1 staining. Briefly, 1 × 10⁶ HCT116 and HT-29 cells were seeded in 60 mm dishes, incubated overnight in a humidified incubator, and then treated with 2c, 2cNP, and Apt-2cNP for 24 h and 48 h. Thereafter, the cells were removed from the dishes and incubated with 10 μl of 200 μM JC-1 in 1 ml complete media for 10 min at 37 °C in the dark. The media was replaced by PBS (pH 7.4) through centrifugation, and the cells were analyzed in a FACS instrument.
Cell cycle analysisCell cycle analysis evaluates cell distribution patterns in the cell cycle-phases. This analysis is crucial for understanding cellular proliferation, growth, and response to various treatments or conditions. It is widely employed in fields such as cell biology, cancer research, and drug development. Next, we performed a cell cycle analysis to estimate the percentage of cell population in different stages of cell cycles, G0/G1, S, and G2/M. HT-29 and HCT116 cells were plated in 60 mm cell culture dishes (1 × 10⁶ per dish) and allowed to grow overnight in DMEM medium at 37 °C. Then, the cells were treated with 2c, 2cNP, and Apt-2cNP (at respective IC50 concentrations) for 24 h and 48 h. After completion of incubation timing, the treatment solution was removed, and the cells were stained alive with Hoechst 33,258 (5 µg/ml final concentration) [32]. The stained cells were then analyzed in a flow cytometer (BD LSRFortessa, BD, CA, USA) to assess the population of cells at different stages of the cell cycle.
Colony formation assayThe colony formation assay, also known as the clonogenic assay, is a cell biology technique used to evaluate the ability of individual cells to undergo unlimited division and form colonies. This assay is commonly employed in cancer research, radiation biology, and drug screening studies to assess cells' proliferative potential and sensitivity to various treatments or conditions. A clonogenic assay was conducted here to evaluate the inhibitory effect of the free drug and nanoencapsulated therapies on the tumor-initiating capacity or colony formation potential of the colorectal cancer cells. About 500 cells were seeded for both the cell lines HT-29 and HCT116 in each well of a 12-well plate, followed by incubation overnight. The cells were treated with 2c, 2cNP, and Apt-2cNP every 3 days for a total of 12–14 days [33, 34] except for the control groups. After completion of drug incubation, the treated medium was withdrawn, and the cells were washed with PBS. 10% acetic acid (in methanol) was used as a fixation buffer, and colonies were stained with crystal violet solution (0.5% crystal violet in 25% methanol) and washed with PBS three times to remove excess dye. After air-drying overnight, the next day, the images of colonies were captured, and colony counting was taken. After imaging, the crystal violet stained colonies were dissolved in 10% acetic acid solution for 15 min under shaking conditions, and the absorbance of the supernatant was detected using a plate reader at 510 nm.
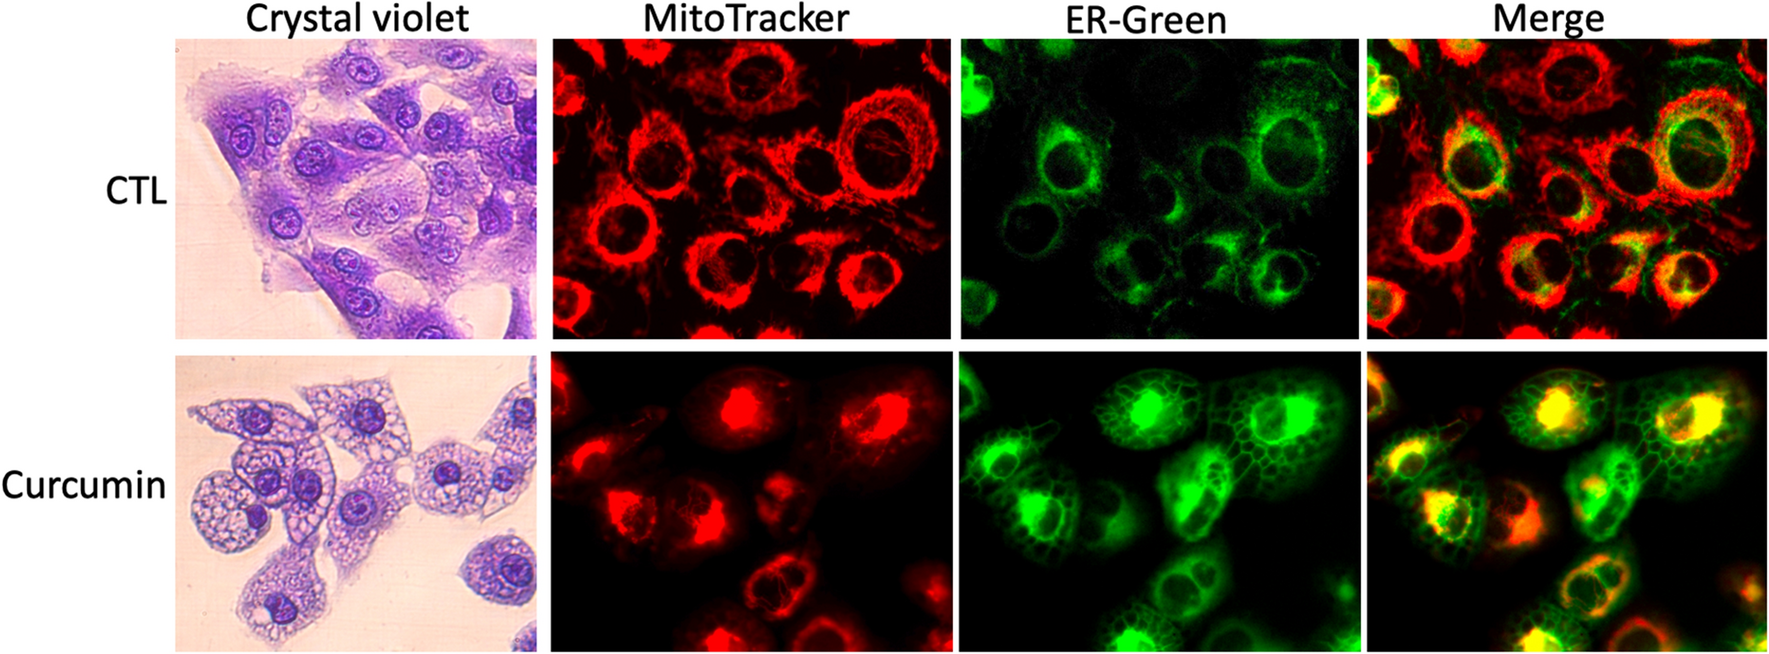
Autophagy detection by acridine orange stainingAutophagy is a cellular process in which the damaged or unnecessary components are degraded and recycled by the cell. Its detection is important in various fields, including cell biology, cancer research, and neurodegenerative disease studies. One commonly used method for detecting autophagy is acridine orange staining. Induction of autophagy in HT-29 and HCT116 cells in the different treatment groups was evaluated using acridine orange staining. Briefly, 2 × 10⁴ cells were seeded on a coverslip, placed into a 35 mm tissue culture dish, and incubated overnight in a 37 °C incubator. The cells were then treated with 2c, 2cNP, and Apt-2cNP at their respective IC50 concentrations for 24 h and 48 h. After removing the treatment media, the cells were stained with acridine orange (6 µg/ml, 3 min). The coverslips placed onto the slides were observed under a confocal laser microscope (Zeiss LSM 900) using green (excitation/emission at 500 nm/526 nm) and red (excitation/ emission at 400 nm/650 nm) filters. The dual color images were obtained by merging the images obtained from green and red filters using Zeiss proprietary software Zen Lite 2.0.
Autophagic flux detection by Cyto ID Green fluorescent probeThe detection of autophagic flux using the Cyto-ID Green fluorescent probe monitors autophagy, a cellular process of cytoplasmic component degradation and recycling. The technique visualizes and quantifies autophagic vacuoles, which are crucial components of the autophagic pathway. Briefly, 1 × 10⁶ HT-29 and HCT116 cells were seeded in each well of 6-well cell culture plates and incubated overnight at 37 °C incubator. Thereafter, the cells were treated with 2c, 2cNP Apt-2cNP (at its IC50 concentration) for 24 h and 48 h. After completion of treatment, the media was removed, followed by washing with PBS. The cells were stained with the Cyto ID Green fluorescent probe (Enzo Life Sciences, Farmingdale, NY,USA), following the manufacturer's guidelines [35]. Finally, the stained cells were analyzed using a flow cytometer (BD LSR Fortessa, BD Bioscience) to estimate autophagic flux formation quantitatively.
Hemolysis studyHemolytic activity of a formulation indicates the safety issue for its intravenous use. Low hemolytic value supports the formulation to be safe while in blood. To test the hemocompatibility of the BA analogue, 2c, and its different nanoformulations (2cNP and Apt-2cNP) at various concentrations, blood was collected from male Swiss albino mice and placed in heparinized tubes and centrifuged at 4 °C for 5 min at 1000g. The erythrocytes were then washed three times with PBS, pH 7.4. The cells were suspended at a concentration of 2% in PBS, pH 7.4. A 96-well plate was prepared with 190 µL of the cell suspension in each well. 2cNP and Apt-2cNP nanoparticles were added to each well in varying concentrations of 2c, ranging from 10 to 100 µM. After incubating for two hours at 37 °C with gentle stirring, the un-lysed erythrocytes were separated by centrifugation at 10,000g for 5 min. The percentage of hemolysis was determined by measuring the optical density (OD) of the supernatant at 570 nm and using the procedure to compute the absorbance factor of a sample that was 100% hemolytic [36, 37].
$$\text()=\frac-\text_0}_-\text_0} \times 100.$$
Abs, Abs0, and Abs100 represent the absorbance of samples, a solution with 0% and a solution with 100% hemolysis, respectively.
Analysis of gene expression by qPCRGene expression analysis by quantitative real-time polymerase chain reaction (qPCR) is widely used in molecular biology and genetics research. qPCR allows the detection and quantification of specific RNA transcripts, providing insights into the expression levels of genes under various conditions or in different cell types or tissues. The expression of several genes related to apoptosis, autophagy, DNA synthesis, and inflammatory pathways were analyzed after treatment with 2c, 2cNP, and Apt-2cNP to understand the molecular mechanism behind their cytotoxic effects and to determine differences between aptamer-conjugated and unconjugated nanoparticles. Total RNA from CRC cancer tissue before and after treatment was isolated after completion of treatment time using TRIzol, following the manufacturer’s protocol. The RNA was checked for quality by measuring the A230/280 ratio and quantified in a NanoDrop instrument. Then, cDNAs were prepared using RevertAid First Strand cDNA synthesis kit (ThermoFisher) followed by amplified using SYBR Green Master Mix (BioRad) in a thermal cycler (Veriti 96-well, Applied Biosystems, Massachusetts, USA). Relative transcript abundance values obtained from the instrument were plotted in bar diagrams. A total of 12 genes (caspase 3, Bcl-2, Bcl-XL, Bax, Atg5, LC3B, Beclin, p62, NF-κB, APC, p53, and TOP2) were analyzed for each sample. Sequences of the primers used (both forward primer and reverse primer) for each gene are in Supplementary Table T2.
Evaluation of inflammatory response in tumor microenvironmentColorectal tissues were isolated from the CRC-bearing mice before and after treatment with 2c, 2cNP, and Apt-2cNP, followed by washing with ice-cold PBS. Colons were then minced into small pieces and agitated with predigestion buffer (HBSS, 10 mM HEPES, 5 mM EDTA, 1 mM DTT, 5% FBS) for 20 min in a 37 °C incubator-shaker. The single cells suspension from the colonic tissues was prepared using a 100 µm cell strainer. The remaining tissue pieces collected from the cell strainer were then cut into finer fragments and treated with digestion solution (HBSS, 10 mM EDTA, 0.5 mg/ml collagenase D, 3 mg/ml dispase II and 5% FBS) in a 37 °C incubator-shaker for 30 min. The dissociated cells from the tissues were collected again through a 100 µm cell strainer. All the single-cell suspensions were pooled together and centrifuged using Percoll gradient. The lymphocytes were suspended in 4 ml of 40% Percoll solution and layered over 12 ml of 80% Percoll solution. Centrifugation was then carried out without a break at 1000 g for 20 min. The T cells were collected from the liquid interphase and resuspended in PBS or RPMI 1640 medium for further experiments.
To analyze cytokine levels (TNFα, IFNγ, and IL-10) and all other ELISA assays, sandwich ELISA kits were used. 100 μl of cell culture supernatant were incubated in each ELISA plate well for 2.5 h at room temperature (RT). Incubation was done with 100 μL of biotin antibody (60 min at RT) followed by 100 μL of streptavidin solution (60 min at RT). Each step was performed following gentle washing of the wells with PBS. 100 μl of TMB one-step substrate reagent was added to each well and incubated for 30 min at RT. The reading was monitored using a multi-plate reader and then compared with the standard curve for actual measurement of the cytokine level.
Flow cytometric analysis of immune cells in CRC murine tissue samplesThe tumor microenvironment (TME) in colorectal cancer (CRC) is characterized by a complex interplay of various immune cells that can promote or inhibit tumor growth. Understanding the roles and interactions of these immune cells is crucial for developing effective immunotherapies. Different mice groups were sacrificed after treatment, and colorectal cells were harvested. The single-cell suspension of the cells is done by overnight enzymatic degradation and passing through cell strainers. The cells were washed with phosphate buffer saline (PBS) and centrifuged at 1000 rpm for 10 min at 4 °C, and the supernatant was discarded. The cell pellet was then resuspended in 2 ml RBC lysis buffer to get rid of the RBC in the solution and then incubated for 5 min at RT. The cells were then centrifuged for 10 min at 4 °C at 1000 rpm, and the pellet was resuspended in PBS for washing. The washing was repeated two times. The cells were finally resuspended in 2% FBS in PBS. The cells were first blocked by incubating with anti-CD16/CD32 and washed two times with PBS.
The cells were then aliquoted and incubated with different fluorochrome-conjugated antibody combinations from Biolegend unless otherwise mentioned, following the manufacturer’s protocol for antibody dilution, incubation duration, and washing steps. For intracellular staining, fixation was done by using 4% paraformaldehyde, followed by the permeabilization of the cells with the 0.1–0.3% Triton™ X-100 and two times washing with PBS.
Additionally, we monitored autophagosomes in single-cell suspension of epithelial cells from CRC mice tumor tissue using fluorescent probe Cyto-ID Green staining by flow cytometric analysis. Fluorescence signals from the labeled cells were acquired using the FACS machine and analyzed using FlowJo software.
Analysis of protein expression by Western blottingWestern blotting is a widely used analytical technique in molecular biology and biochemistry to detect and quantify specific proteins in a complex mixture of proteins from cell or tissue extracts. Treated (with 2c, 2cNP, and Apt-2cNP) and untreated (control) HT-29 and HCT-116 cells were lysed using RIPA lysis buffer (Sigma Aldrich, USA). Each sample was then centrifuged at 16,000g for 20 min, and the clear supernatant was collected. Protein content in the supernatant was determined using a Bradford reagent. 20 μg protein/lane was loaded on an SDS-PAGE gel (10%), followed by electro-transferred onto a PVDF membrane. The membrane was blocked by 5% skimmed milk in Tris-buffered-saline-tween (TBST) solution (20 mM Tris–HCl, pH 7.4, 150 mM NaCl, 0.02% Tween 20) for 1 h followed by probing with primary antibodies (Topoisomerase-II/Beta-actin) for overnight at 4 °C. After washing 3 times with TBST, the membranes were incubated with secondary antibody for 1 h. Finally, the membrane was washed again 3 times with TBST and visualized by chemiluminescence kit using a Gel Doc [38].
In vivo colonic distribution of nanoparticles in CRC-bearing Swiss albino miceThe evaluation of in vivo colonic distribution of nanoparticles in colorectal cancer (CRC)-bearing Swiss albino mice is a critical study that can provide valuable insights into the potential of nanoparticle-based drug delivery systems for targeted therapy against colorectal cancer. We injected Cy-5 dye-loaded 2cNP and Apt-2cNP into CRC-bearing Swiss albino mice through the tail vein (25 mg/kg) and sacrificed the animals after 24 h and 48 h. The colons were isolated from the animals, fixed with 4% formaldehyde solution, and sectioned with a microtome of their paraffin blocks. The sections (approximate thickness 5 µm) were mounted on microscopic slides. Then, the sections were stained with DAPI (300 nm) to detect the nucleus. The colon sections were then observed under a confocal laser microscope (Olympus Fluoview 10i, Olympus) using the channels of Cy5 (Excitation/Emission 645 nm/ 664 nm) and DAPI (Excitation/ Emission 359 nm/ 461 nm.
In vivo antitumor efficacy of free drug and nanoparticles with the histopathological observationsEvaluating in vivo antitumor efficacy with histopathological observations is essential to preclinical studies in cancer research and drug development. This approach combines the assessment of tumor growth inhibition with the histological examination of tumor tissues to provide insights into the mechanisms of action and potential side effects of investigational anticancer agents. DMH-induced CRC was developed in Swiss albino mice and Sprague Dawley rats following the method described in an earlier section. After histological confirmation of CRC development, the mice were treated with 2c, 2cNP, and Apt-2cNP at 300 mg/kg intraperitoneally once a week for 9 weeks. After that, the animals were sacrificed, and their colons were isolated and sectioned for microscopic slides, followed by histological analysis carried out through H&E staining and Ki67 immunohistochemistry assay. H&E staining was additionally carried out for the liver and kidneys, which were also isolated from normal mice, CRC-bearing mice, and CRC-bearing mice after treatment with 2c, 2cNP, and Apt-2cNP. Ki67-positive and -negative cells were counted in microscopic images taken after staining using QuPath-0.3.2 software.
Pharmacokinetic evaluationPharmacokinetic evaluation informs the time course of drug absorption, distribution, metabolism, and elimination (ADME) within the body. It is a crucial aspect of drug development and is vital in understanding how a drug behaves in vivo. 2c, 2cNP, and Apt-2cNP were injected separately into CRC-bearing mice through intravenous injection (dose: 25 mg/kg). Blood samples were withdrawn at 4 h, 8 h, 10 h, 12 h, 24 h, 48 h, 72 h, and 96 h post-injection, and plasma concentrations of 2c for all samples were determined using LC–MS following a previously described method [39]. A plasma concentration vs time curve was generated using GraphPad Prism (version 5.0). Cmax and Tmax were determined directly from the curve. AUC, AUMC, and AUC0–∞ were calculated using the trapezoidal method. t1/2, MRT, and clearance values were calculated using standard formulas.
In vivo biodistribution in CRC-bearing Sprague Dawley (SD) ratsIn vivo biodistribution studies in CRC-bearing Sprague Dawley (SD) rats are critical for understanding therapeutic agents' pharmacokinetics and tissue distribution, which can inform their efficacy and safety profiles. These studies involve tracking the distribution of a drug or therapeutic compound throughout the body after administration. The in vivo biodistribution study was carried out in CRC-bearing SD rats (n = 5). 2cNP and Apt-2cNP were radiolabeled with 99mTc following the previously described method [40]. The radiolabeled nanoparticles were injected through the tail vein in experimental animals. The animals were hydrated well with intraperitoneal administration of normal saline (0.9%) prior to administering the intravenous injection. The radioactivity injected into the rat was 14–18 MBq/Kg body weight. 1 h, 2 h, and 5 h after injection, the animals were sacrificed, and different organs (liver, kidney, colon, lung, heart, stomach, muscle) and blood and urine samples were collected in pre-weighed counting vials. The radioactivity present in each organ and fluid sample was measured using a gamma scintillation counter (Electronics Corporation of India Limited, Hyderabad, India). The data were calculated as percent injected dose per g (% ID per g) of tissue or organ following the equation (Eq. 3).
$$=\frac \times 100.$$
(3)
Gamma scintigraphic imaging using 99mTc radiolabeled Apt-2cNPGamma scintigraphic imaging using 99mTc (Technetium-99m) radiolabeled nanoparticles is a powerful technique for visualizing the biodistribution and accumulation of nanoparticles in vivo [41]. This method combines the advantages of nanoparticle-based drug delivery with the sensitivity and resolution of gamma scintigraphy, allowing for detailed tracking of the nanoparticles in a living organism. Scintigraphic imaging was carried out in CRC-bearing SD rats to visualize the in vivo distribution of 2cNP and Apt-2cNP after intravenous injection. 2cNP and Apt-2cNP were radiolabeled using 99mTc following the method as described earlier [7, 42]. The radiolabeled nanoparticles were injected into CRC-bearing SD rats through the tail vein (containing 15–20 MBq/Kg body weight), and the radio images were captured at 1 h, 2 h, and 5 h post-injection in a gamma-scintigraphy camera (GE Infinia, GE Healthcare, India).
Statistical analysisEach of the experiments, except as otherwise stated, was executed at least three times, and the corresponding data provided the mean value along with the standard deviation of the means. Statistical analysis was performed using Student’s t-test, one-way ANOVA followed by Tukey’s post hoc test, and two-way ANOVA analysis, which was tested by Bonferoni’s post-test. Images, bar diagrams, and graphical representations were generated using Graph Pad Prism software, Gimp 2.10.30, ImageJ, Flow Jo, AutoDock 4.2, and Origin 2021. Schematic representation was created using Biorender.com. Probability value, p < 0.05, was considered as the statistical level of significance.
Comments (0)