
Remember me
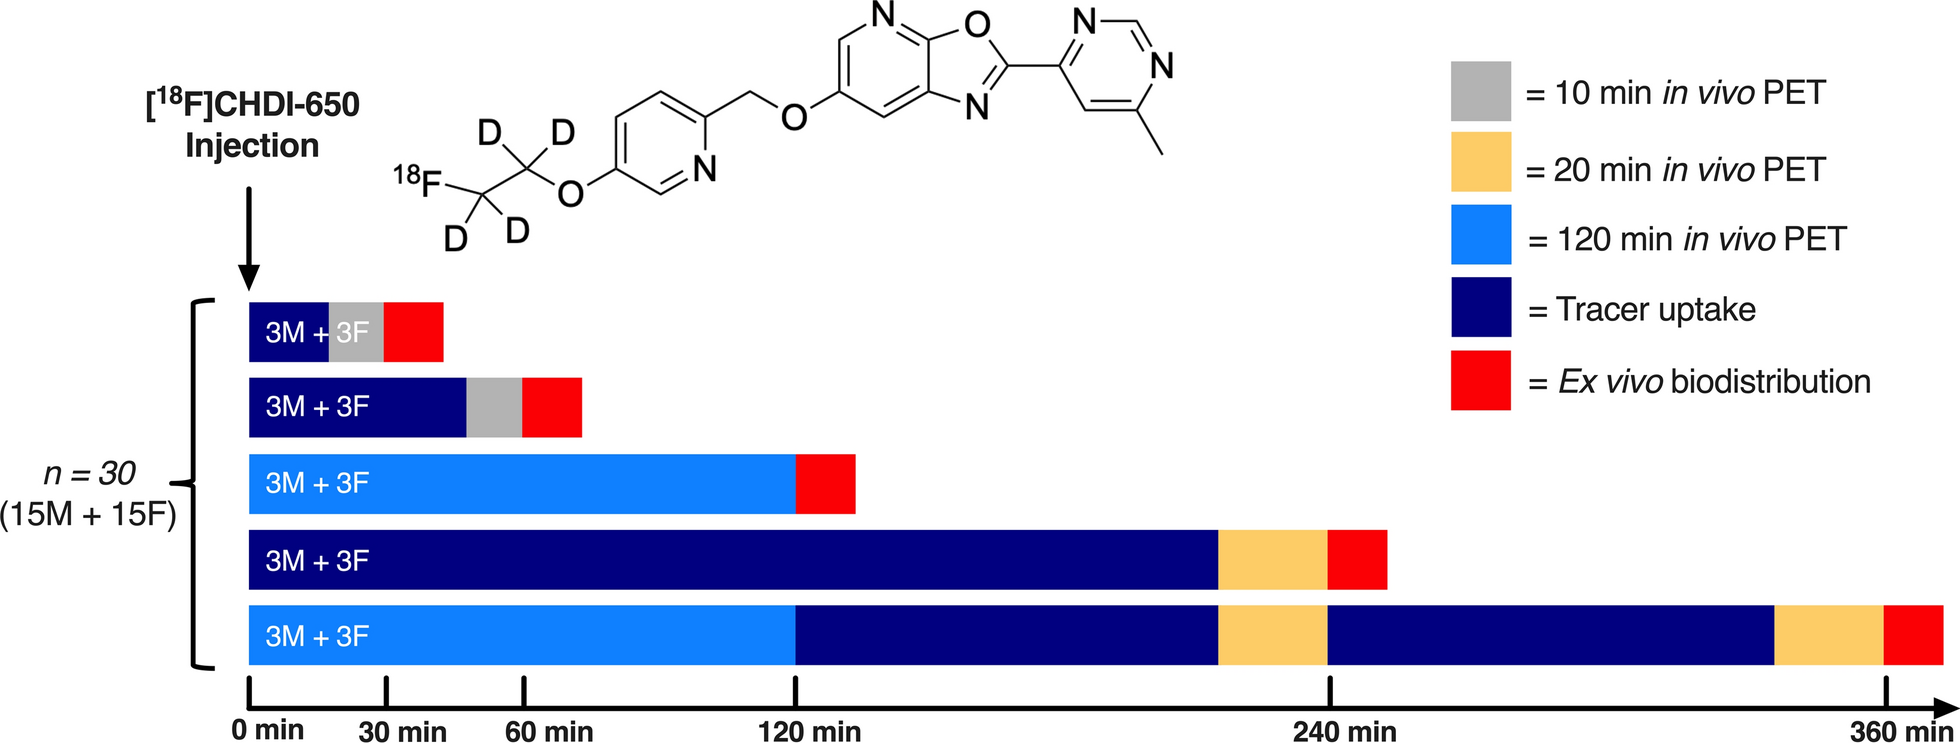

The experimental workflow of this study is illustrated in Fig. 1.
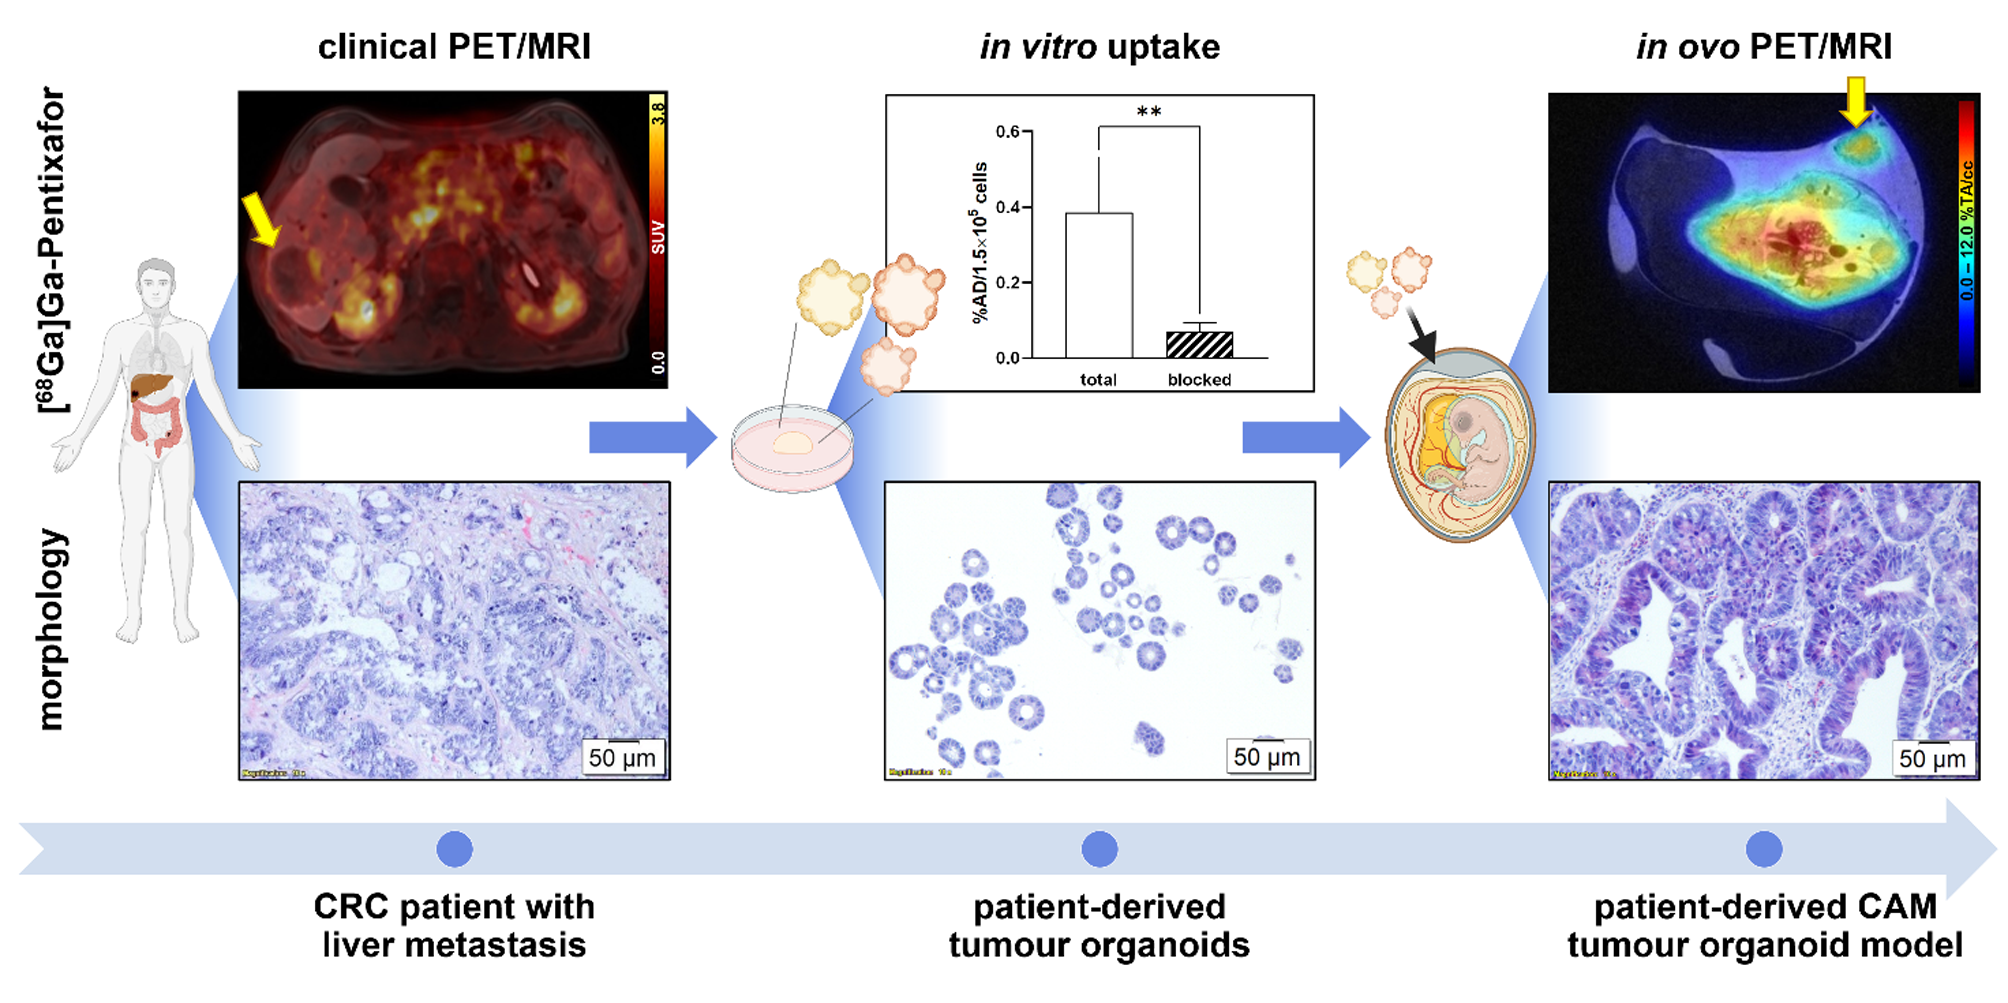
Fig. 1
Experimental workflow of the study. Created with BioRender.com
Radiolabelling2-deoxy-2-[18F]fluoro-D-glucose (2-[18F]FDG) and [68Ga]Ga-Pentixafor were prepared for routine diagnostics following standard procedures using fully automated cassette-based synthesisers (FASTlab™; GE Healthcare, Uppsala, Sweden, and SCINTOMICS Molecular; Applied Theranostics Technologies GmbH, Fürstenfeldbruck, Germany) [46]. Quality control was performed according to the European Pharmacopoeia. To meet the higher molar activity and activity concentration required for preclinical experiments, the radiosynthesis of [68Ga]Ga-Pentixafor was modified for in ovo experiments and performed as published previously [42].
Patient and clinical PET/MRIA 78-year-old male patient, diagnosed with metastasised CRC in the liver, had previously undergone neoadjuvant therapy with FOLFIRI (FOL – folinic acid, F – 5-fluorouracil, IRI – irinotecan) and Bevacizumab. PET/magnetic resonance imaging (MRI) examinations were conducted using a Siemens Biograph mMR PET/MRI system (Siemens Healthineers, Erlangen, Germany), covering the body from the vertex to the upper thigh. Imaging using [68Ga]Ga-Pentixafor and 2-[18F]FDG was performed on two consecutive days. [68Ga]Ga-Pentixafor PET was acquired 40 min post-injection (p.i.) of 158 MBq. 2-[18F]FDG imaging was performed 105 min after intravenous administration of 198 MBq. The MRI protocol included among others a T1-weighted, two-point Dixon, 3D volume-interpolated breath-hold (VIBE) sequence as published previously [46] using contrast agent Primovist® (0.1 mL/kg body weight; Bayer AG, Berlin, Germany). Data were viewed and analysed using Hermes Hybrid Viewer (Hermes Medical Solutions, Stockholm, Sweden). The maximum standardised uptake values (SUVmax) were determined to assess the tracer uptake in the main liver metastasis. One week after the PET/MR scans, a partial hepatectomy was conducted by a surgeon. Biopsy results have shown viable tumour formations along the periphery (10%) and a necrotic core.
PDOs isolation and in vitro culturingPDOs were isolated from a vital, 2-[18F]FDG-avid, marginal part of liver metastasis that expressed CXCR4. Freshly resected tumour samples were cut into small pieces using scalpels and digested for 30 min at 37 °C in Cell Recovery Solution (Corning, NY, USA) containing Rho-associated protein kinase (ROCK) inhibitor (Y-27632; MedChemExpress, Monmouth Junction, NJ, USA). The suspension was again mechanically disrupted with scalpels and pipetting. The digested tumour tissue was pressed through a cell strainer (70 μm) and washed with phosphate-buffered saline (PBS). The cells were embedded into an extracellular matrix (ECM) (growth factor reduced Geltrex™; Gibco™, Thermo Fisher Scientific Inc., Waltham, MA, USA) and covered with factor-rich organoid ENAS (E – epidermal growth factor, N – Noggin, A – A83-01, S – SB202190) medium as detailed by others [47, 48]. PDOs were maintained in a humidified incubator at 37 °C with an atmosphere of 95% air and 5% CO2 and cultured in 6-well plates in droplets of 30 µL ECM (approx. 1 × 10³ cells/1 µL seeded) overlayed with ENAS medium for 2–4 weeks in order to obtain the required cell amounts for in ovo or in vitro experiments. PDOs were split 1–3 times a week (approx. 2 h) using TrypLE™ Express (Gibco™, Thermo Fisher Scientific Inc., Waltham, MA, USA) and the medium was exchanged every second to third day.
Generation of the CAM-PDX modelThe incubation and handling of fertilised chicken eggs were performed as previously published [42]. Eggs were incubated at 37 °C and 65% relative humidity, starting on embryo development day (EDD) 1. On EDD3, a small hole was created, which was enlarged on EDD5. Two days prior to inoculation, 1 × 10⁵ PDOs were mixed with 30 µL growth factor reduced Geltrex™ and seeded into a cell culture dish. After slight laceration of the CAM using a cotton swab, a silicone O-ring (MVQ material, 6 × 0.5 mm; Arcus, Hamburg, Germany) was positioned at the junction of two CAM vessels. Using a disinfected spatula, the PDO-ECM plugs were inoculated onto the chick embryonic CAM on EDD9. All experimental procedures were completed by EDD18. Tumours were either preserved for further histopathological evaluation or the grafts were re-cultured to generate post-ovo PDO lines (n = 3). Tumour volumes (V) were calculated using the formula for ellipsoid shape V = 4/3 × π × ((l × w × h)/8) with l = length, w = width, h = height [36].
Histopathological characterisationThe harvested xenografts, PDOs, and the patient’s biopsy tissue were fixed in paraformaldehyde and embedded in paraffin. 2-µm-thick xenograft sections were subjected to haematoxylin-eosin (H&E) staining (n = 9), periodic acid-Schiff (PAS) staining (n = 3), or immunohistochemical (IHC) analyses (n ≥ 3 per marker) following standard procedures. IHC for Ki67 and Cytokeratin (CK) AE1/AE3 was automatically performed using an auto-stainer (VENTANA BenchMark ULTRA; Roche Tissue Diagnostics, Oro Valley, AZ, USA), while staining against CXCR4 was performed manually. Complementary histopathological analysis of PDOs and the patient’s liver metastasis was performed n = 1 for each staining. An additional IHC was performed for CAM-PDX samples for Desmin and cleaved Caspase 3 (CC3). The following antibodies were employed for IHC: antibody against CC3 (n = 5; 1:2000, clone 5A1E, no.: #9664; Cell Signaling Technology, Danvers, MA, USA), CXCR4 (n = 5; 1:400, clone UMB2, no.: ab12824; Abcam, Cambridge, UK), CK clone AE1/AE3 (n = 3; 1:100, no.: M3515; Dako, Agilent, Santa Clara, CA, USA), Desmin (n = 4; 1:100, clone 33, no.: M0760; Dako, Agilent, Santa Clara, CA, USA) and Ki67 (n = 3; ready-to-use, clone: 30 − 9, no.: 790–4286; Roche Tissue Diagnostics, Oro Valley, AZ, USA).
CAM-PDX re-culturingThe xenografts were harvested and processed either fresh or on the following day after storage in ENAS medium at 4 °C. Corresponding to the PDOs isolation procedure, xenografts were dissected into small pieces with scalpels and digested in ROCK-inhibitor-containing Cell Recovery Solution at 37 °C for 30 min. After further mechanical disruption, the digested xenograft tissue was pressed through a 70 μm cell strainer and washed with PBS. The cells were embedded in ECM and covered with ENAS medium. The post-ovo PDO lines were cultured according to the PDO culture procedures described above.
In vitro [68Ga]Ga-Pentixafor uptake in PDOsSeven days prior to the experiment, 3.5 × 10⁵ cells per PDO line were seeded (1 × 10⁴ cells/1 µL growth factor reduced Geltrex™). ENAS medium was exchanged every other day. On the experimental day, cells were recovered from the ECM using Cell Recovery Solution (40 min, 150 rpm, on ice). After centrifugation and washing with Dulbecco’s phosphate-buffered saline (DPBS), PDO pellets were resuspended in the ENAS medium. The PDO suspension was aliquoted into Protein LoBind® Tubes (Eppendorf SE, Hamburg, Germany). For assessing [68Ga]Ga-Pentixafor binding specificity, CXCR4 antagonist I AMD3100 (Calbiochem®, Merck KGaA, Darmstadt, Germany) (1 µM final concentration; blocked uptake) or ultra-pure water (vehicle control; total uptake) were added to each tube, followed by 7 pmol [68Ga]Ga-Pentixafor (138 ± 24 kBq, 14 nM final concentration). Three tubes were prepared as a reference to determine the applied dose (AD). Three additional tubes were treated analogously to evaluate the unspecific binding to tube plastic. Cells (and control tubes) were incubated with the radiotracer for 2 h at 37 °C with gentle shaking (300 rpm). Two additional tubes were counted to estimate cell numbers. After incubation, cells were centrifuged, and the supernatant was collected (supernatant fraction). The PDOs were washed twice with ice-cold DPBS to obtain the wash fraction. Medium was added to the PDO pellet (cell fraction) and all fractions and references were gamma counted (2480 Wizzard2®; PerkinElmer, Waltham, MA, USA). Cell uptake was calculated as the percentage of applied dose per 1.5 × 10⁵ cells (%AD/1.5 × 105 cells). The experiments (n = 5) were performed in triplicates with the PDOs before inoculation onto the CAM (pre-ovo) and compared to three different post-ovo PDO lines (n = 2–3 per post-ovo line, data grouped).
Ex vivo gamma countingA dose of 2.80 ± 0.9 MBq 2-[18F]FDG (n = 3) or 8.35 ± 10.2 MBq [68Ga]Ga-Pentixafor (≥ 96% radiochemical purity; 1.53 ± 1.6 nmol; n = 3 baseline, n = 3 blocking) was injected on EDD16 or EDD17 into a CAM vessel as published previously [42]. The eggs of the [68Ga]Ga-Pentixafor blocking group were additionally co-injected with 315 µg AMD3100 (in 50 µL; approx. 15 mg/kg body weight when assuming an embryo weight of 21 g [49]). Subsequently, the eggs were incubated at 37 °C for 48 min to allow for the distribution of the radiotracer. Prior to decapitation (62 min p.i.) and tumour removal, anaesthesia was induced with isoflurane (6 min, 3% in 2 L air/min). Samples were weighed and gamma counted (Hidex Automatic Gamma Counter, Mainz, Germany) and radiotracer uptake was calculated as the percentage of injected dose (ID) per gram (%ID/g).
Preclinical PET/MRIIn addition to the ex vivo assessment of xenograft uptake, PET/MRI was performed as previously published [42] to visualise radiotracer uptake in a separate group of eggs (n = 1–3 per group). PET was measured simultaneously with MR using a preclinical MRI scanner (BioSpec® 94/30 with 9.4 Tesla; Bruker Biospin, Ettlingen, Germany) with a dedicated PET insert (model Si 168; Bruker Biospin, Ettlingen, Germany) and an 86 mm PET-compatible coil (model T20202V3; Bruker Biospin, Ettlingen, Germany). Paravision 360 V3.2 software (Bruker Biospin, Ettlingen, Germany) was used for data acquisition.
7.14 ± 5.0 MBq [68Ga]Ga-Pentixafor (≥ 97% radiochemical purity, 1.38 ± 0.8 nmol) was injected into a CAM vessel on EDD16 (baseline, n = 3) and EDD17 (blocking, n = 1), followed by 10.02 MBq 2-[18F]FDG on EDD18 (n = 1). Blocking was performed as described for ex vivo analysis. The eggs were incubated at 37 °C to allow the radiotracer to distribute and embryos were subsequently anaesthetised with 3% isoflurane in 2 L air/min for 6 min before the scan start. Anaesthesia was maintained throughout the whole duration of the scan (2% isoflurane). Static PET scan (15 min) was started 60 min p.i. For the generation of attenuation maps, a 3D T1-weighted iso-voxel fast low-angle shot (FLASH) sequence covering the whole egg in isotropic resolution was acquired. T2-weighted rapid acquisition with relaxation enhancement (TurboRARE) sequences (axial, coronal) were acquired as an anatomical reference. Sequence details can be found elsewhere [42]. PET data were corrected for scatter, deadtime, and random coincidences, and attenuation correction for the egg, cradle, and MR coil was applied. List-mode data were reconstructed using the maximum-likelihood expectation-maximisation algorithm (18 iterations, 0.5 × 0.5 × 0.5 mm pixel size, 180 × 180 × 300 matrix size). Image datasets were analysed using the PMOD software version 3.807 (PMOD Technologies, Zürich, Switzerland). Xenografts were delineated based on the PET information and the delineation was controlled with anatomical MR information. A sphere was placed around the whole egg to extract the total injected activity (TA) to determine the percentage of total activity per cm3 (%TA/cc).
StatisticsStatistical analyses and graph preparations were performed using GraphPad Prism software version 8.2.1 (GraphPad Software, Inc., San Diego, CA, USA). Data were tested for normal distribution and paired or unpaired t-test was used for group comparison as indicated. A p-value < 0.05 was set as the significance threshold. The reported values represent mean ± standard deviation (SD).
Comments (0)