Subjects and procedures
The study was performed at the Turku PET Centre. Recruitment took place at the Turku University Hospital Neurocenter between Feb 2019 and Jun 2022. Inclusion criteria for all MS patients included a confirmed diagnosis according to the 2017 McDonald criteria and a written informed consent. Additional requirements were at least one Gd + lesion of at least 0.5 cm in diameter, and a clinical diagnosis of secondary progression for the RMS and PMS cohorts, respectively. Key exclusion criteria included pregnancy, claustrophobia, and other significant central nervous system pathology besides MS. All MS patients underwent baseline neurological assessments, magnetic resonance imaging (MRI) and [11C]SMW139 PET. Age matched healthy control subjects (HCs) were imaged for comparison. The study protocol was approved by the Ethics Committee of the Hospital District of Southwest Finland. The study was conducted according to the principles of the Declaration of Helsinki.
[11C]SMW139 production and PET
Irradiations were performed with a TR-19 (ACSI, Richmond, Canada) cyclotron to produce the carbon-11 radioisotope according to previously described procedures [8]. The complete synthesis procedure of [11C]SMW139 at the Radiopharmaceutical Chemistry Laboratory of Turku PET Centre is described in the supplementary material of Aarnio et al. 2022 [24].
A ninety-minute dynamic PET scan was acquired for each subject with a high-resolution research tomograph (HRRT; Siemens Medical Solutions, Knoxville, TN, USA). The mean (SD) injected specific activity and mass of [11C]SMW139 were 95 (88) MBq/nmol and 2.7 (1.7) µg, respectively. The mean (SD) injected dose of radioactivity was 402 (12.2) MBq, 404 (13.5) MBq and 404 (10.7) MBq in the RMS, PMS and HC groups, respectively. List mode data was histogrammed into 21 timeframes (3 × 5s, 3 × 10s, 4 × 60s, 2 × 150s, 2 × 300s, 7 × 600s) and reconstructed using an OP-OSEM3D algorithm with 16 subsets and 10 iterations and with point spread function modelling [26] to reduce the partial volume effect. Reconstructed images were post-processed with a 2.5 mm FWHM (full width at half maximum) Gaussian filter.
Arterial blood sampling and PET modelling
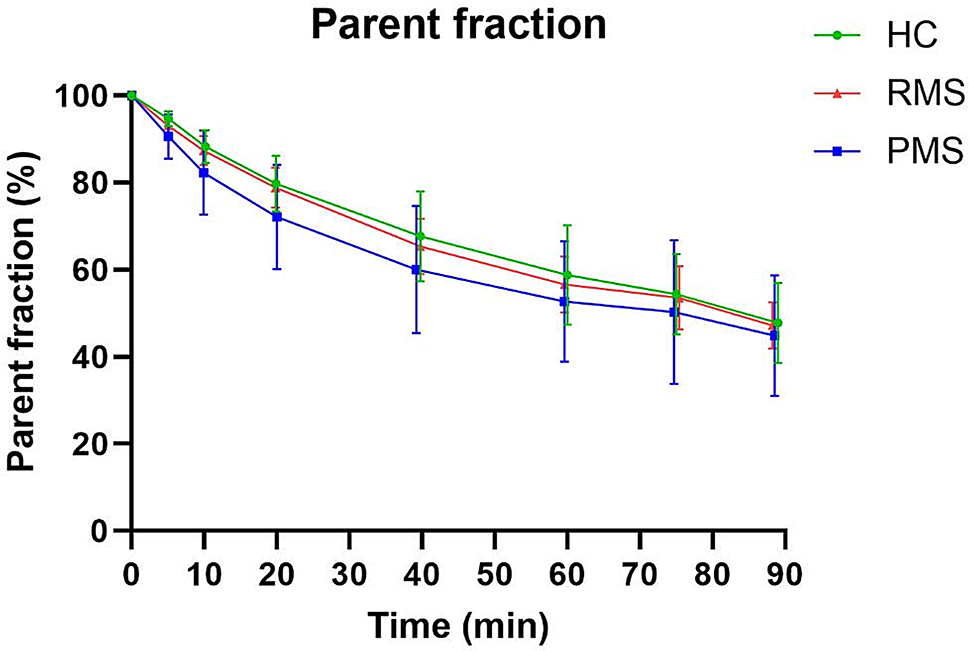
A hematocrit sample was drawn within 1 h before PET imaging. An automated blood pump (ABSS, Allogg AB, Mariefred, Sweden) running at 60 rpm (6 mL/min) was used to obtain a continuous arterial blood time activity curve (TAC) from 0 to 5 min p.i., and manual arterial blood sampling ensued at 5, 10, 20, 40, 60, 75 and 90 min p.i. Arterial plasma activity were then converted to whole blood with individual plasma-to-blood ratio curves. Next, input curves for PET modelling were estimated by fitting the parent fraction with a monoexponential function f(x) = (A-B)e− Cx + B, where A = 1, B > = 0, C > 0, and multiplied with the arterial plasma data to obtain metabolite corrected arterial input TACs. The resulting curves were subtracted from the uncorrected plasma input curves to obtain the TACs corresponding to the radioactive metabolites in plasma. The differences in appearance times of radioactivity between PET and plasma, whole blood and metabolite TACs were corrected by first estimating the delay of the arterial plasma input TAC, which produced the best fit of two-tissue compartment model to whole brain TAC, and then shifting all other input TACs accordingly. Cerebral blood volume was fixed to 5% in all tested models.
The 1TDI model was fitted with five parameters (VB, K1P, K2P, K1M, K2M; P = parent, M = metabolite). The distribution volume of [11C]SMW139 was estimated with the ratio of rate constants of the intact parent tracer between the plasma compartment and the combined tissue compartment; K1P/K2P (VTDI). Additionally, tracer binding was quantified with the total volume of distribution VT2T of a reversible 2TCM, where the model was fitted with five parameters (VB, K1, K2, K3, K4) and where VT2T = K1/K2(1 + K3/K4). The modelling was carried out with in house software (fitk2di and fitk4; http://www.turkupetcentre.net/programs/doc/).
Parent fraction and plasma protein binding of the parent tracer and its radiometabolites
Arterial blood samples were drawn at 0, 5, 10, 20, 40, 60 and 90 min p.i. and the plasma was separated by centrifugation (4 °C, 2118 g, 5 min). The plasma proteins were precipitated by adding 700 µL of acetonitrile to 500 µL of plasma, vortexing and centrifuging (3370 g, 3 min). The protein free supernatant was analyzed with high-performance liquid chromatography (HPLC) using a method described in the supplementary material of Brumberg et al. [25] to obtain fractions of intact [11C]SMW139 and its radioactive metabolites for correcting the plasma TAC. A radioactive standard was prepared by spiking the time point 0 plasma supernatant with [11C]SMW139 in order to analyze the correct peak of the chromatograms to correspond to the parent.
Parent and radiometabolite binding to plasma proteins was analyzed for a subset of subjects from blood samples drawn prior to [11C]SMW139 injection and from 20 min p.i. From the time point 0 plasma drawn for in vitro protein binding analysis, 1 mL was frozen for later duplicate analysis. The in vitro plasma and in vivo 20 min parent fraction analysis plasma samples were used to analyze parent and radiometabolite plasma protein binding with separate ultrafiltration membrane corrections.
MRI and PET image processing and analysis
A 3T MRI (Philips Ingenia/Philips Ingenuity, Best, The Netherlands) was acquired for all study participants with T1, T2, FLAIR, 3DT1, and gadolinium-enhanced T1. The dynamic PET images were smoothed, realigned, and co-registered using statistical parametric mapping (SPM12; Wellcome Trust Center for Neuroimaging, London, UK) according to a previously described procedure [6]. The images were resliced to match the 1-mm3 voxel size of the MRI images.
The Lesion Segmentation Toolbox (LST) [27] was used in SPM to create FLAIR masks, which were manually edited to correspond to chronic T1 lesions to create T1 masks following a previously described procedure [8]. Perilesional masks were created by dilating the lesion mask by 3 mm, and then subtracting the core image from the dilated image. Separate masks were created for the Gd + lesions. NAWM masks were created for each subject by subtracting edited FLAIR lesion masks from segmented white matter. Finally, T1 images were filled with the T1 masks by employing the lesion filling tool of LST in SPM. The filled T1 image was used to segment whole-brain volume (BV) and volumes of different brain areas with FreeSurfer (https://surfer.nmr.mgh.harvard.edu/) for PET assessments.
Statistical analysis
The statistical analysis was performed with SPSS 28.0 (IBM Corp., Armonk, NY, USA). Figures were created with Prism 10.1.2 (GraphPad software Inc. La Jolla, CA, USA). Group level means of VT estimates across different brain areas were compared between MS patients and HCs, and between PMS and RMS with Student’s t-test. Among MS patients, Group level means of VT estimates were compared between the T1 lesion masks, the 3 mm perilesional rim masks, and the NAWM masks with paired t-tests. Normality of the data was confirmed with the Shapiro-Wilk test. Linear correlations between VT estimates, lesion volume, BV, thalamus volume, and demographic variables were measured with the Pearson correlation coefficient. The effects of disease duration and BV on VTDI were estimated with multiple linear regression. All tests were two-tailed, and the alpha was set to 0.05 for all analyses with no correction for multiple comparisons.


Comments (0)