
Remember me


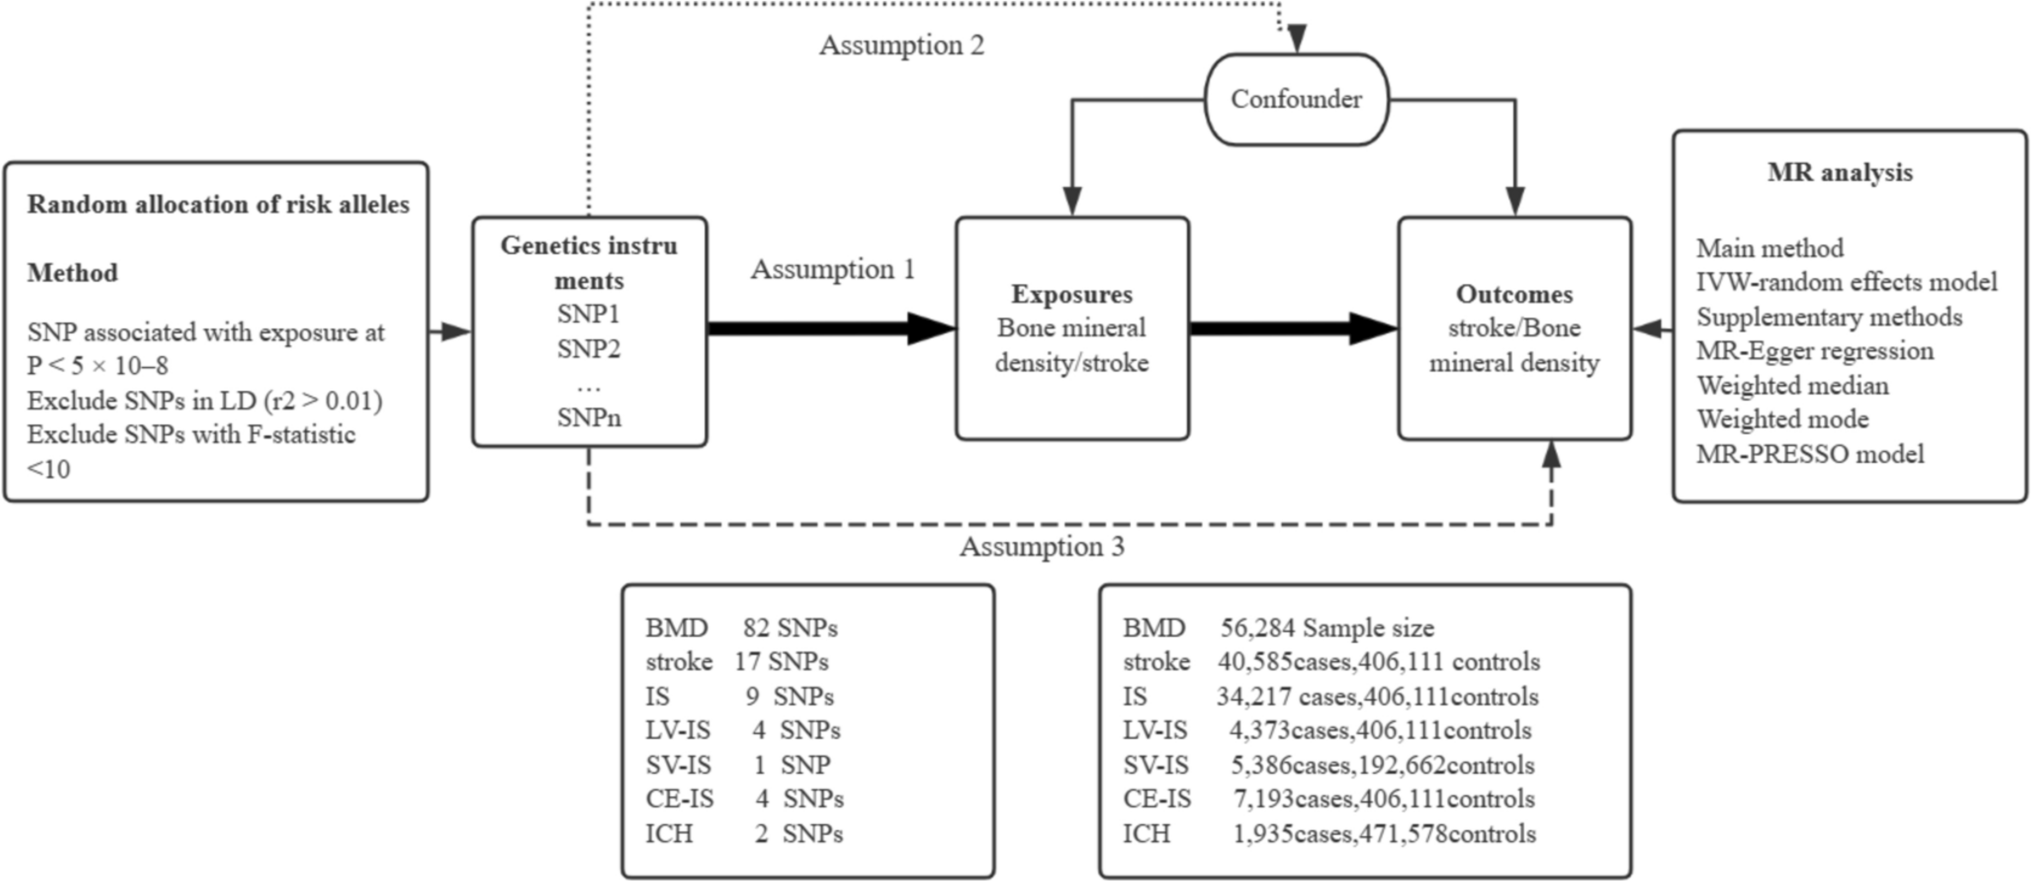
In our study, after taking into account the independence and LD of genetic variants,we used 82 independent SNPs as instrumental variables (IVs) for bone mineral density (BMD) (Table 2, Fig. 2). The MR analysis results indicated no significant relationship between genetically predicted BMD and overall stroke or its subtypes. The primary IVW results showed no significant association between BMD and stroke [IVW odds ratio (OR): 1.005, 95% confidence interval (CI): 0.963 ~ 1.050, P = 0.81], BMD and IS (OR: 1.031, 95% CI: 0.978 ~ 1.088, P = 0.26), LV-IS (OR: 1.032, 95% CI: 0.927 ~ 1.150, P = 0.57), SV-IS (OR: 0.994, 95% CI: 0.905 ~ 1.092, P = 0.90), CE-IS (OR: 1.032, 95% CI: 0.939 ~ 1.133, P = 0.52), and ICH (OR: 0.922, 95% CI: 0.808 ~ 1.053, P = 0.23). Similar results were observed with MR-Egger regression and median-based estimators (weighted median and weighted mode) (Fig. 2). The horizontal pleiotropy test results indicated no directional pleiotropy (Fig. 2).
Table 2 MR Heterogeneity and Pleiotropy Analysis of the Relationship Between Bone Mineral Density and StrokeFig. 2
MR estimates from each method of assessing the causal effects of Bone Mineral Density on stroke and subtypes. Note. OR, Odds ratios; CI, confidence interval
In Cochran’s Q heterogeneity test, heterogeneity was detected in the BMD-overall stroke association (IVW = 101.04, P = 0.05; MR-Egger = 100.35, P = 0.05, Fig. 2, Table 2). Therefore, we conducted an MR-PRESSO test to further examine this relationship. The MR-PRESSO results indicated no significant outliers (Global Test P value = 0.0606). No outliers were identified, so the results for the outlier-corrected MR are set to NA. The leave-one-out sensitivity analysis results showed that no single SNP had a potential impact on the final results. Supplementary Fig. 1 describes the scatter plots, funnel plots, and leave-one-out analysis plots of BMD on overall stroke and stroke subtypes.
To further strengthen our MR assumption, we examined the traits related to our instrumental SNPs. Traits association analysis (see Supplementary Table 1) showed that rs2252865,rs2873195 in TB-BMD, are associated with psychiatric diseases and hyperlipemia, which may have some effect on the risk of overall stroke or its subtypes. Sensitivity analysis by removing the SNPs revealed similar results.(see Supplementary Fig. 3).
Effect of stroke on bone mineral densityAfter taking into account the independence and LD of genetic variants,we obtained 17, 9, 4, 1, 4, and 2 SNPs from GWAS to serve as IVs for overall stroke, IS, LV-IS, SV-IS, CE-IS, and ICH, respectively (see Fig. 3, Table 2). The MR analysis results indicated no significant relationship between genetically predicted overall stroke and its subtypes with bone mineral density (BMD). The primary IVW results showed no significant association between stroke and BMD (OR: 1.027, 95% CI: 0.947 ~ 1.114, P = 0.52), IS and BMD (OR: 0.953, 95% CI: 0.874 ~ 1.039, P = 0.27), LV-IS and BMD (OR: 0.988, 95% CI: 0.930 ~ 1.049, P = 0.68), SV-IS and BMD (OR: 1.013, 95% CI: 0.915 ~ 1.121, P = 0.81), CE-IS and BMD (OR: 0.969, 95% CI: 0.933 ~ 1.006, P = 0.10), and ICH and BMD (OR: 0.954, 95% CI: 0.847 ~ 1.074, P = 0.43). Similar results were observed with MR-Egger regression and median-based estimators (weighted median and weighted mode) (Fig. 3, Table 2). All Egger regression tests were negative (p > 0.05; Fig. 3), indicating that our MR results were not influenced by horizontal pleiotropy.
Fig. 3
MR estimates from each method of assessing the causal effects of stroke and subtypes on Bone Mineral Density. Note.OR, Odds ratios; CI, confidence interval
In the Cochran’s Q heterogeneity test, heterogeneity was detected in overall stroke, IS, and ICH. For stroke (IVW = 37.16, P = 1.99E-03; MR-Egger = 37.16, P = 1.20E-03), IS (IVW = 17.81, P = 0.02; MR-Egger = 15.95, P = 0.03), and ICH (IVW = 5.89, P = 0.02) (Fig. 3, Table 2). Therefore, we conducted an MR-PRESSO test to further examine these relationships. For overall stroke, SNPs rs3184504 and rs42039 were excluded, and for IS, SNPs rs3184504 and rs4942561 were excluded. After removing the outlier variants, we still found no causal relationship between stroke and reduced BMD (see Fig. 3, Table 2). The leave-one-out sensitivity analysis results showed that no single SNP had a potential impact on the final results. Supplementary Fig. 2 describes the scatter plots, funnel plots, and leave-one-out analysis plots of stroke and its subtypes on BMD.
To further strengthen our MR assumption, we examined the traits related to our instrumental SNPs. The results of the trait association analysis (see Supplementary Table 2) indicated that no SNPs,which may have some impact on OP.
Comments (0)