
Remember me

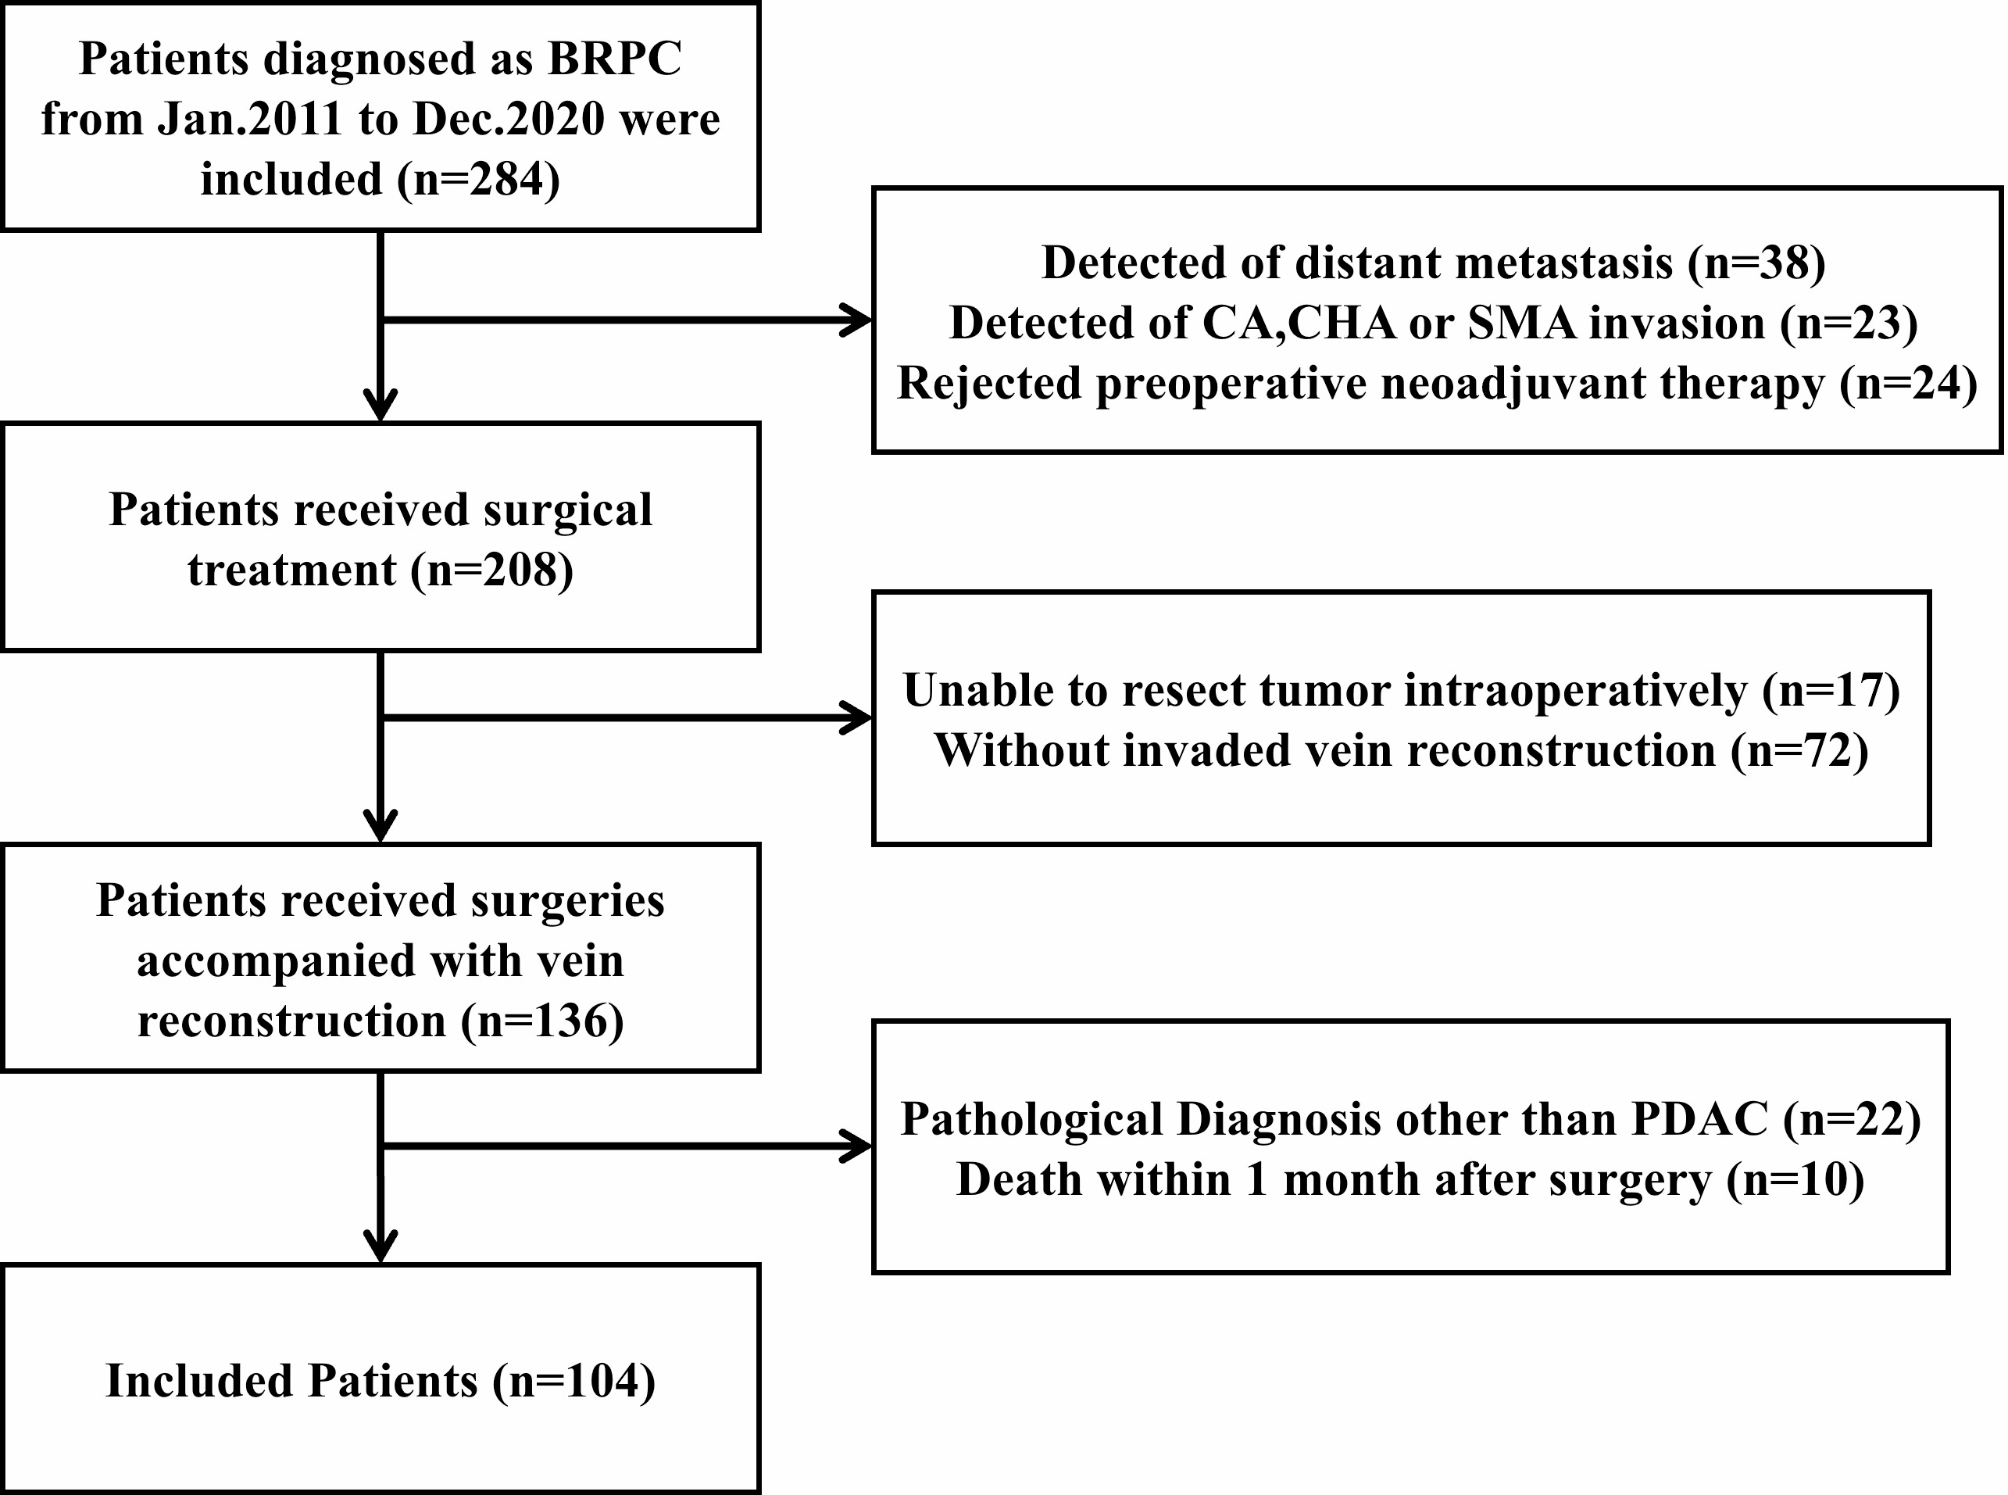
A total of 104 patients were enrolled in the study, including 49 males and 55 females with an average age of 62.2 ± 10.2 years. The median OS was 15.5 months (Fig. 3A), and the rates of 0.5-, 1-, 2- year OS were 81.7%, 57.7%, and 30.8%. The median disease-free survival (DFS) was 11 months (Fig. 3B), and the rates of 0.5-, 1-, 2- year DFS were 65.4%, 42.3%, and 19.2%.
Fig. 3
Survival curve of patients. (A) Overall survival (OS) curve of patients with BRPC. (B) Disease-free survival (DFS) curve of patients with BRPC. (C) OS curve between the long-term group and the short-term group. (D) DFS curve between the long-term group and the short-term group
Identification of risk factors related to long-term survivalBased on the OS, patients were divided into two groups: the long-term group (> 2 years, n = 32, 30.8%) and the short-term group (≤ 2 years, n = 72, 69.2%). In the long-term group and short-term group, the median OS and the rates of 1-, 2-, and 3- years OS were 38 months, 100%, 100%, 61.3%, and 10 months, 38.9%, 0%, and 0%, respectively. The DFS and the rates of 1-, 2-, 3- years DFS were 26 months, 100%, 62.5%, 34.4%, and 6 months, 16.7%, 0%, and 0%, respectively (Fig. 3C-D). Then univariate and multivariate analyses were applied to identify the risk factors related to long-term survival between the groups. In the univariate survival analysis, 7 variables, including age (P = 0.001), gender (P = 0.03), preoperative ALT (P = 0.01), tumor size (P = 0.02), vascular invasion length (P < 0.001), vascular morphological malformation (P = 0.01), and local lymphadenopathy (P = 0.004) were statistically different in the two groups (Table 1). In the multivariate survival analysis, 4 variables, including age (OR = 1.121, 95%CI: 1.049–1.199, P = 0.001), vascular invasion length (OR = 3.442, 95%CI: 1.700-6.967, P = 0.001), vascular morphological malformation (OR = 5.173, 95%CI: 1.448–18.484, P = 0.011) and local lymphadenopathy (OR = 4.444, 95%CI: 1.112–0.935, P = 0.035) were confirmed as independent risk factors for long-term survival of patients (Table 2).
Table 1 Univariate Analysis of Risk factors for BRCP patients between two groupsTable 2 Multivariate analysis of independent risk factors for BRCP patients between two groupsEstablishment and evaluation of logistic regressionAll patients in the present study were randomly divided into the training set (n = 72) and the validation set (n = 32) at a 7:3 ratio. Based on the above four variables screened by logistic multivariate analysis, the logistic regression model was established and evaluated in the training set and the validation set, respectively, and was visualized by Nomograms (Fig. 4A), and its discrimination was evaluated by the AUC value of the ROC curve. The ROC curve in the training set with AUC: 0.881 (95%CI: 0.787–0.975), and the validation set with AUC: 0.875 (95%CI: 0.750-1.000), indicated that the model had a high discrimination (Fig. 4B-C). The calibration plots, which were used to assess the nomogram performance, demonstrated an excellent correlation between observed and predicted survival in both the training and validation sets with mean absolute errors of 0.054 and 0.054, respectively (Fig. 4D-E). The apparent curves of the model fit well with the bias-corrected curves, indicating a great agreement in the training and validation set.
Fig. 4
Establishment and evaluation of logistic regression. (A) A nomogram for predicting long-term survival in BRPC patients undergoing upfront surgery. (B) The ROC curve and the AUC value evaluate the discrimination ability of the nomogram in the training set. (C) The ROC curve and the AUC value evaluate the discrimination ability of the nomogram in the validation set. (D) Calibration curves for the training set. (E) Calibration curves for the validation set
SHAP-based analysis of feature importanceNext, the SHAP value was performed to further identify the important variables that affect long-term survival postoperatively. The feature importance analysis revealed that vascular invasion length, vascular morphological malformation, age, and local lymphadenopathy were important factors affecting the long-term survival of BRPC patients following upfront surgery. As shown in Fig. 5, the figure illustrates the distribution of SHAP values for each feature, arranged in descending order according to the importance of each feature. The horizontal axis represents the SHAP value of the model, while the color of the dots indicates the magnitude of the feature value. Each point on the plot corresponds to a sample, and the horizontal axis indicates the SHAP value of a given feature across subjects, which reflects the magnitude of the SHAP value from low (yellow) to high (purple). As shown in Fig. 6, with the SHAP value as the vertical axis and the feature value as the horizontal axis, SHAP dependence plots make the values of many individuals available in one plot, facilitating an up-and-down trend of feature-attributed importance. Figure 6 shows the SHAP dependence plots for the top 4 features. The value on the horizontal axis represents the original value of a feature, whereas the value on the vertical axis represents the SHAP value of a feature across individuals. Those whose age scores of 50 exhibit higher SHAP values than those with scores of 70, indicating a higher likelihood of long-term survival prediction.
Fig. 5
The SHAP summary plot for the top 10 important features in predicting long-term survival in patients
Fig. 6
The SHAP dependence plots for the top 4 important features in predicting long-term survival in patients. (A) The SHAP dependence plots for the vascular invasion length in predicting long-term survival in patients. (B) The SHAP dependence plots for the vascular morphological malformation in predicting long-term survival in patients. (C) The SHAP dependence plots for the age in predicting long-term survival in patients. (D) The SHAP dependence plots for the local lymphadenopathy in predicting long-term survival in patients
Comparison of logistic regression with other machine learning algorithmsTo evaluate the effectiveness of various machine learning algorithms in predicting the long-term survival of BRPC patients with upfront surgery, we also constructed other different predictive models, including support vector machine, random forest, decision tree, and XGBoost. 10-fold cross-validation as a statistical method and AUC value were used to estimate the general performance of machine learning models. The calculated results showed that the support vector machine model had the worst classification effect, with an average AUC value of 0.693, and the logistic regression model had the best classification effect, with an average AUC value of 0.864 (Table 3).
Table 3 Comparison of the effectiveness of various machine learning algorithms
Comments (0)