
Remember me
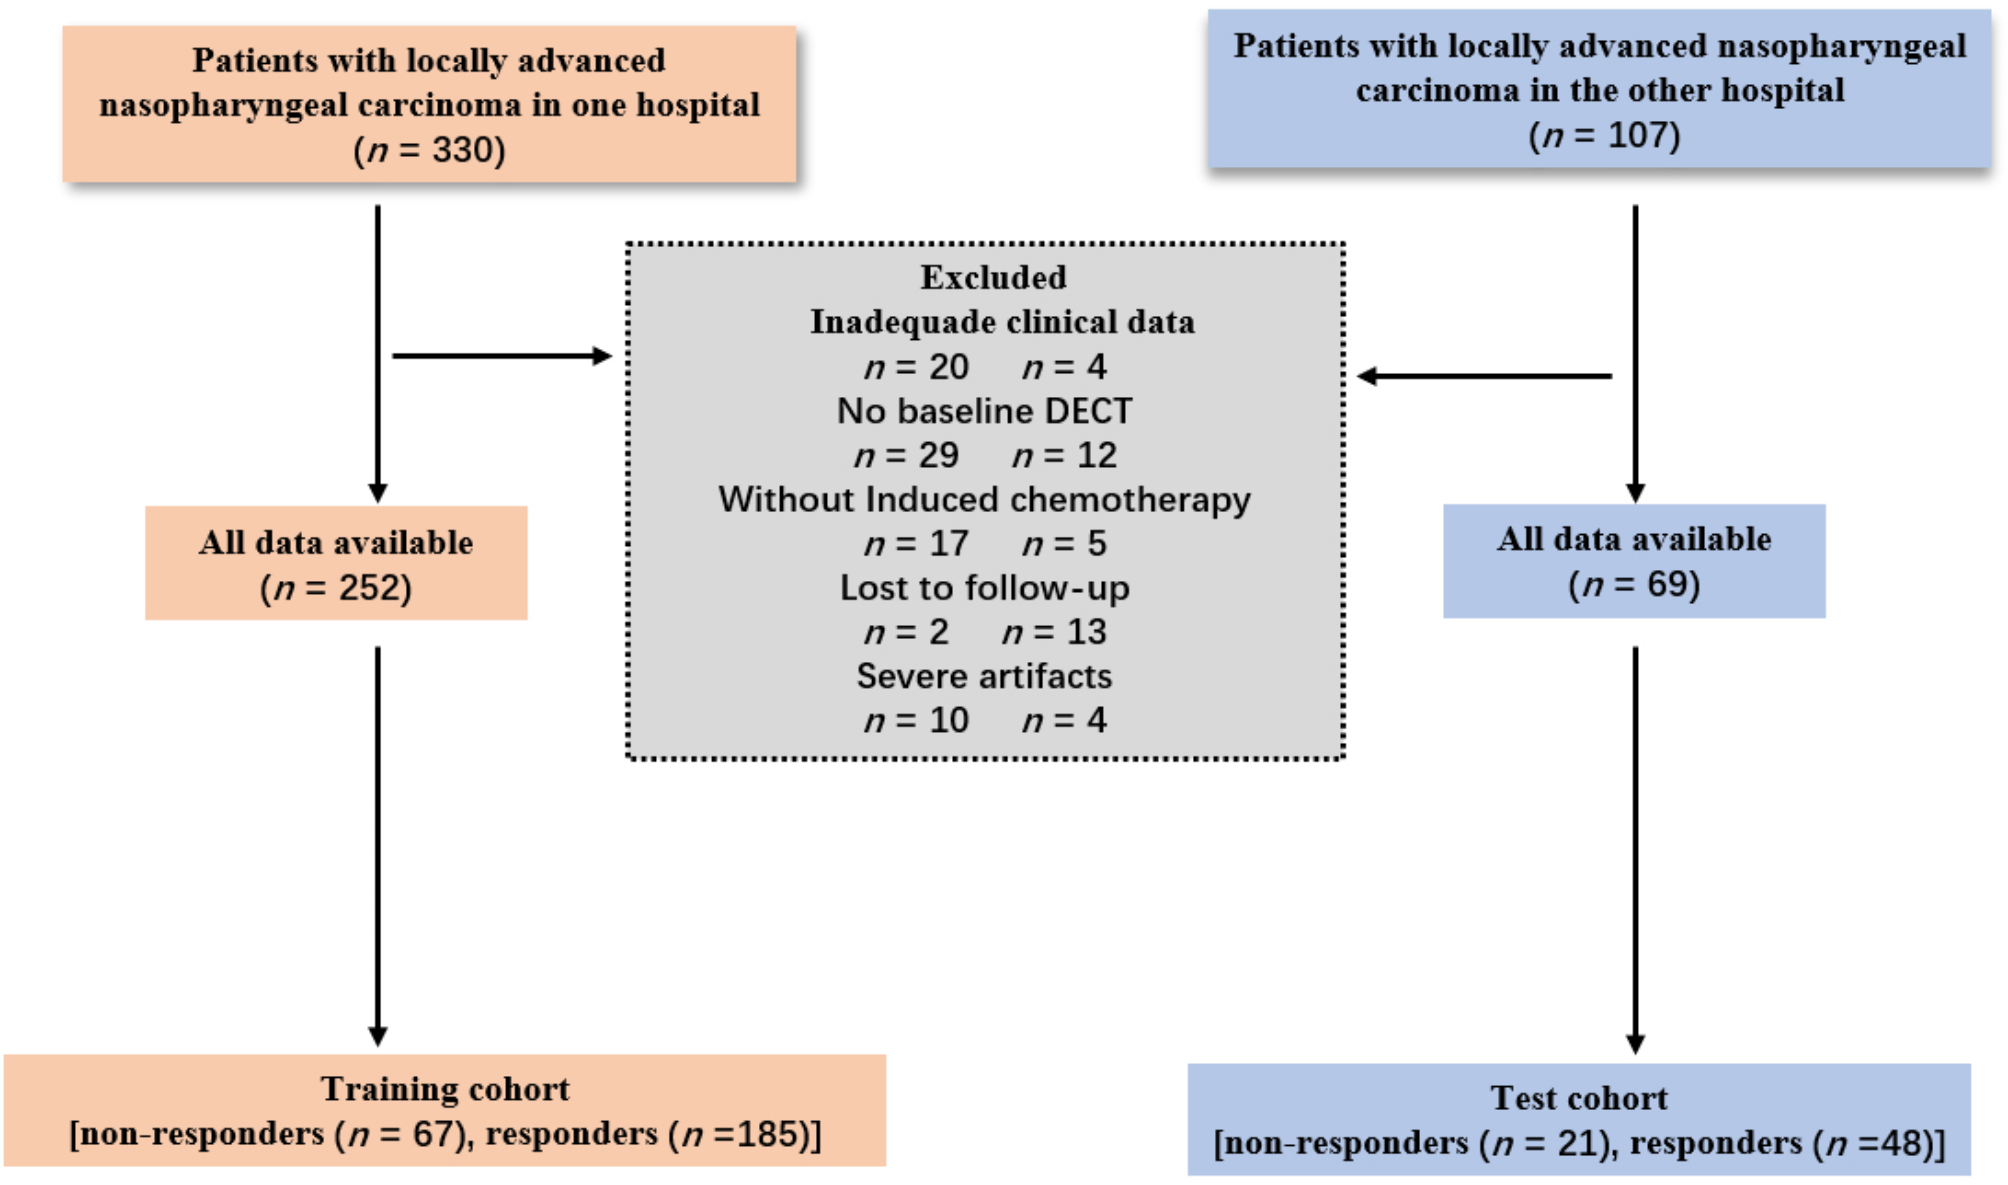

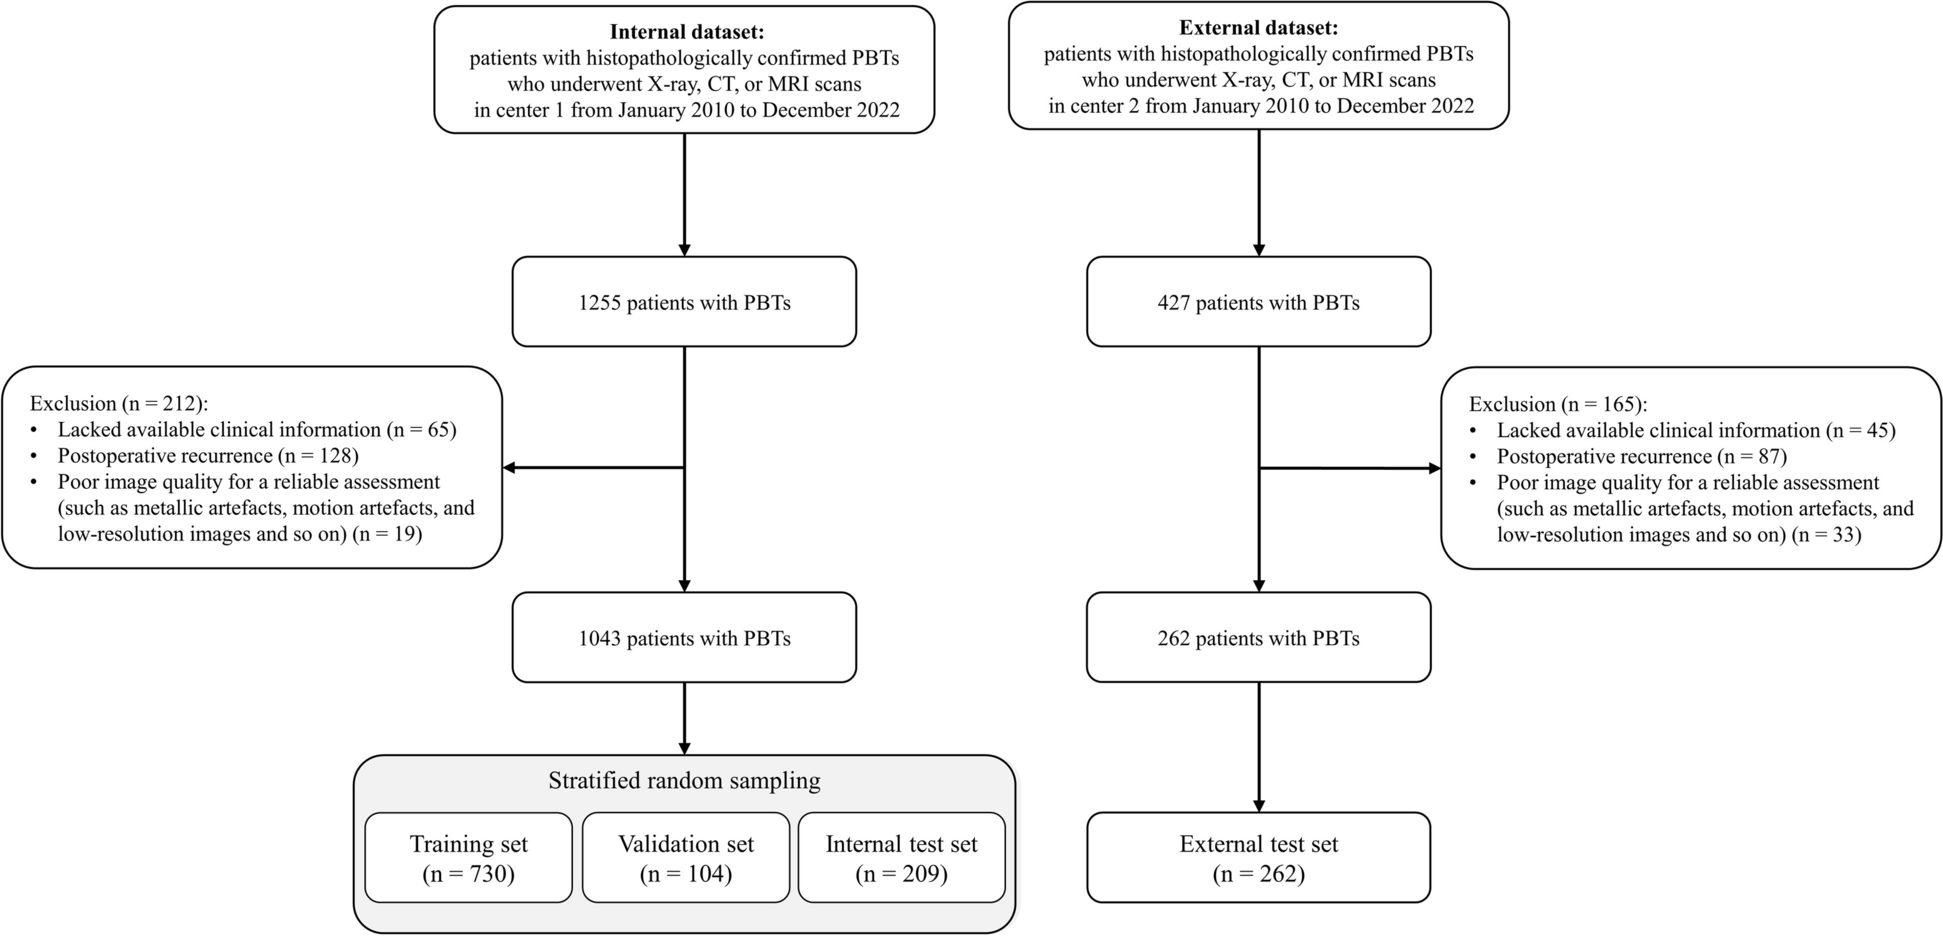
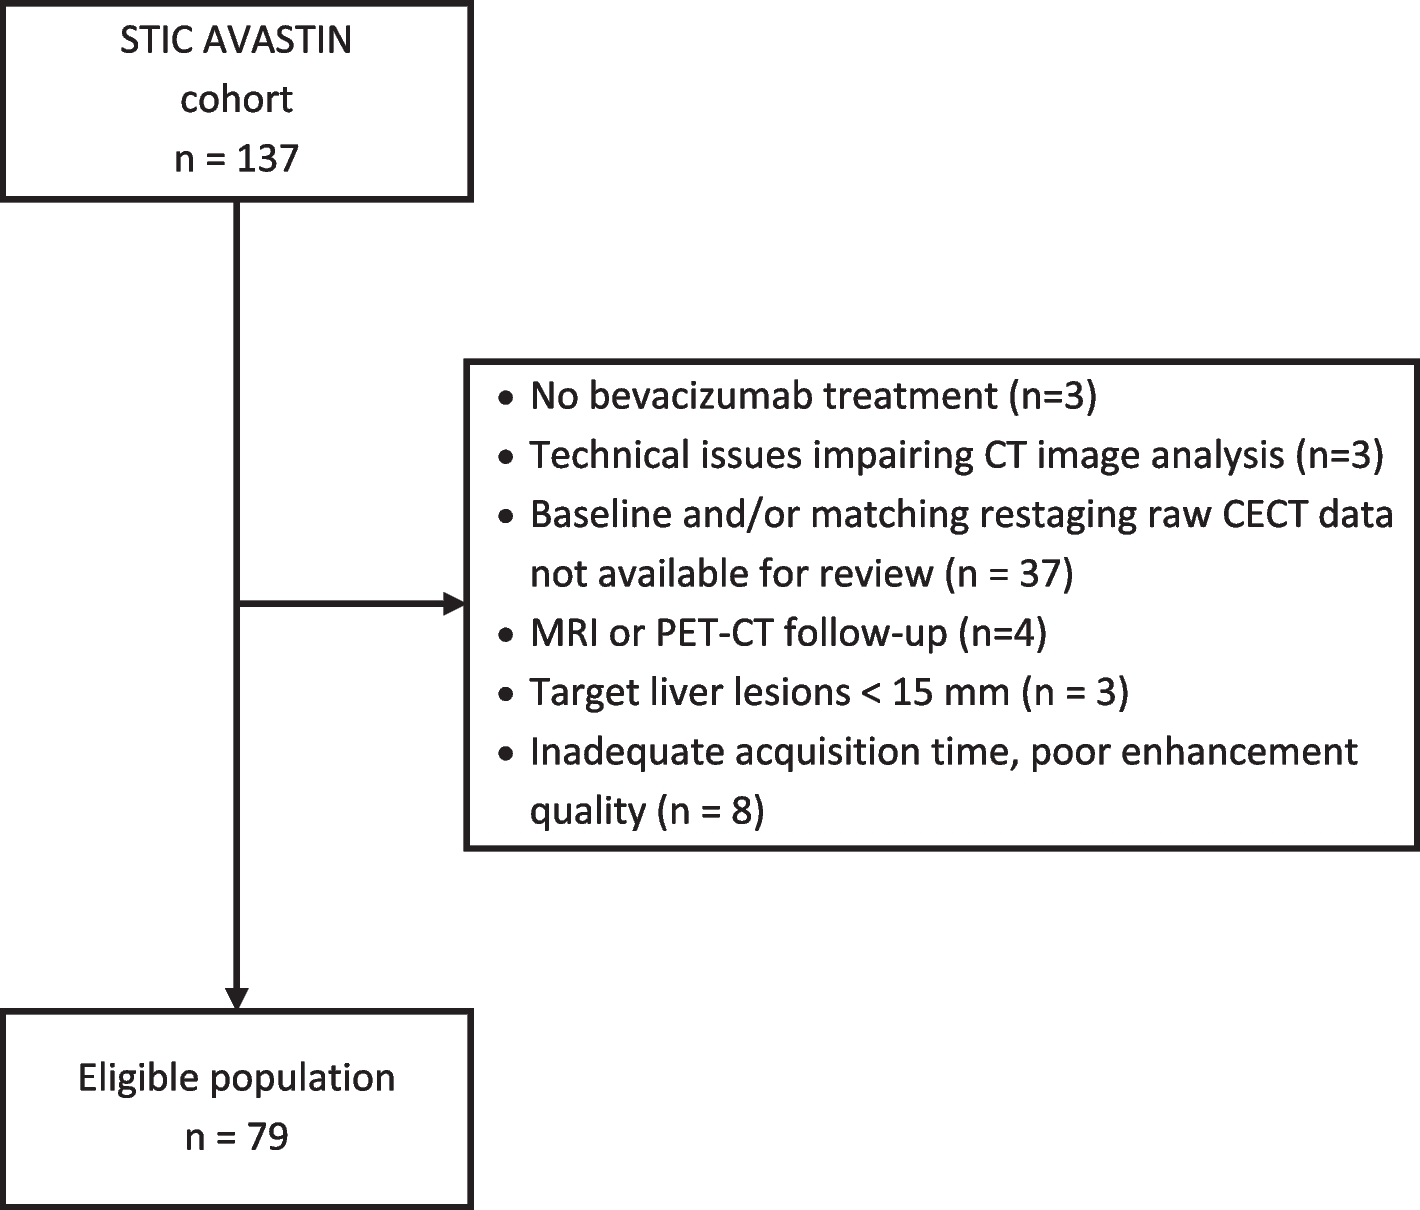
This retrospective study received approval from our institutional review board, and the requirement for patients’ informed consent was waived. We consecutively enrolled 321 individuals diagnosed with NPC (252 from center 1 and 69 from center 2) between March 2019 and November 2023. Center 1 patients constituted the training cohort, while those from center 2 formed the test cohort. As shown in Fig. 1, enrollment adhered strictly to the following inclusion criteria: (1) patients had histopathologically confirmed non-keratinizing squamous cell carcinoma, (2) patients completed pretreatment DECT, and (3) patients had stage III or IVA NPC (Eighth American Joint Committee on Cancer [AJCC] staging system) scheduled for induction chemotherapy. Patients who (1) received anti-tumor treatment before DECT, (2) lacked induction chemotherapy, (3) had inadequate image quality/data, or (4) were lost to follow-up were excluded.
Fig. 1
Flowchart of patient selection
Demographic characteristics and laboratory data were independently reviewed from the electronic medical records system of each center.
Acquisition and postprocessing of DECT imagesThe scan parameters of the two centers are detailed in the Supplementary Materials.
Two experienced radiologists from center 1 (with 7 and 12 years in head and neck radiology) independently reviewed all images while blinded to clinical and pathological data. The regions of interest (ROIs) from the largest axial slices of nasopharyngeal primary tumors encompassing the tumor contour were manually delineated. The ROIs were carefully delineated to include primary lesions and exclude areas of necrosis, cyst, and hemorrhage [12]. Then, the ROIs were automatically transferred to virtual monoenergetic images at 40 keV and 80 keV, iodine concentration maps, effective atomic number (Zeff) maps, and electron density (ED) maps. The values of these quantitative parameters were obtained in both non-contrast and venous phases.
The following quantitative parameters were calculated in the venous phase: (1) the slope of the spectral curve, where slope = (HU40 keV − HU80 keV)/40; (2) the normalized iodine concentration (NIC) value, where NIC = ICtumor/ICinternal carotid [13] (ICtumor, is the iodine concentration of the tumor; ICinternal carotid is the iodine concentration of the internal carotid at the level of the tumor); and (3) the ECVf of the tumor, where ECVf = (1 − hematocrit) × NIC × 100% [14]. The interval time between the DECT scan and hematocrit measurement was 1.0 ± 1.3 days. The radiologists mentioned previously performed measurements for all the parameters. The mean values of each parameter measured by the two radiologists were used for statistical analysis.
Treatment procedure and evaluation of the tumor response to induction chemotherapyThe interval time between the DECT scan and induction chemotherapy was 3.1 ± 1.9 days. The response to induction chemotherapy was assessed after two or three cycles of chemotherapy in both institutions. Induction chemotherapy regimens included GP (gemcitabine 1000 mg/m2, days 1 and 8; cisplatin 80 mg/m2, day 1), TPC (paclitaxel 135–175 mg/m2, day 1; cisplatin 80 mg/m2, day 1; capecitabine 1000 mg/m2 twice per day, days 1–14), TP (paclitaxel 135–175 mg/m2, day 1; cisplatin 80 mg/m2, day 1), PF (cisplatin 80 mg/m2, day 1; fluorouracil 750 mg/m2, days 1–5), TPF (paclitaxel 135–175 mg/m2, day 1; cisplatin 80 mg/m2, day 1; fluorouracil 750 mg/m2, days 1 − 5), DPF (docetaxel 75 mg/m2 and cisplatin 80 mg/m2, day 1; fluorouracil 750 mg/m2, days 1–5), DP (docetaxel 75 mg/m2 and cisplatin 80 mg/m2, day 1), and DPC (docetaxel 75 mg/m2 and cisplatin 80 mg/m2, day 1; capecitabine 1000 mg/m2 twice per day, days 1–14).
Based on the Response Evaluation Criteria in Solid Tumors (RECIST) version 1.1 [15], the treatment response of all patients was evaluated using MRI (on T2-weighted imaging with fat saturation images and contrast-enhanced T1-weighted imaging images). Following the RECIST criteria, complete responses were delineated as tumor disappearance, while partial responses were characterized by a reduction in tumor diameter of ≥ 30%. An augmentation of ≥ 20% in tumor diameter was designated as progressive disease. All other scenarios were classified as stable disease. Responders were designated as patients achieving complete or partial responses, while non-responders were considered those experiencing stable or progressive disease.
Development of predictive modelsUnivariate logistic regression analysis was used to select important clinical variables and DECT parameters to predict the response to induction chemotherapy in NPC patients. Thereafter, clinically significant features (P < 0.05) were selected to identify independent predictors of the response to induction chemotherapy by stepwise backward multivariate analysis. Independent clinical factors and DECT predictors were then used to construct the clinical model and the DECT model, respectively, through multivariate logistic regression analysis. Ultimately, the clinical-DECT nomogram was built, integrating the significant clinical and DECT predictive factors. The three models were then independently verified in the test cohort.
Evaluation of predictive modelsReceiver operating characteristic (ROC) curves were generated for each model to assess predictive performance, with the area under the ROC curve (AUC) calculated accordingly. The DeLong method was used to compare AUC values. Calibration curves were generated to assess the calibration performance of the three models, facilitating the comparison of the agreement between the observed clinical outcomes and the predictive outcomes. Subsequently, decision curve analysis was performed to evaluate the clinical usefulness of these predictive models.
Statistical analysisStatistical analysis was performed with R (version 4.3.1; R Foundation for Statistical Computing) and SPSS software (version 27.0; IBM Corporation). Continuous variables are expressed as mean and standard deviation values, and categorical variables are expressed as numbers and percentages. Student’s t test or the Wilcoxon rank-sum test was used for patients’ age, body mass index, neutrophil-to-lymphocyte ratio, platelet-to-lymphocyte ratio, systemic immune inflammation index, and platelet count. Patient sex, smoking and drinking history, T stage, N stage, AJCC stage, Epstein–Barr virus (EBV) DNA, and Ki67 status were compared using χ2 or Fisher exact tests. Both the intra- and interobserver reproducibility of the DECT parameters (ZeffNCCT, ZeffV, EDNCCT, EDV, Slope, NIC, and ECVf) were evaluated using the intraclass correlation coefficient. ROC curve analysis was used to evaluate the predictive performances of the clinical, DECT, and clinical-DECT nomogram models. Two-sided P values of < 0.05 were considered statistically significant.
Comments (0)