
Remember me

This retrospective analysis was performed of patients injected with either 1MBq/kg or 0.5MBq/kg of [18F]-FDG and scanned on the Siemens Vision Quadra as part of a clinically indicated scan. The initial acquisition times were chosen empirically based on published data using an administered activity of 3.5 MBq/kg [9]. This retrospective study was approved by a professionally convened human research ethics committee (reference number: 2023–12–1561).
The Low dose group consisted of 20 patients who were injected with 1MBq/kg of [18F]-FDG (range of 0.9–1.1MBq/kg) and were scanned for 10 min for a single ultra-extended FOV PET bed. The list-mode PET data were reconstructed with the following acquisition timing: 10, 5, 4, 3, 2, 1 and 0.5 min.
The Ultra-low dose group consisted of 20 patients who were injected with 0.5MBq/kg of [18F]-FDG (range of 0.5–0.6MBq/kg) and were scanned for 15 min for a single ultra-extended FOV PET bed. The list-mode PET data were reconstructed with the following acquisition timing: 15, 10, 6, 5, 4, 2 and 1 min.
All images were reconstructed using Siemens proprietary software, TrueX + TOF (ultraHD-PET), with a 5mm Gaussian filter, 4 iterations and 5 subsets. Each correlative CT for attenuation correction was performed using a tin filter, CAREkV and ADMIRE reconstructions to reduce the effective dose from the CT component. A coefficient of variance (COV) in liver activity was calculated using a 20mm volume of interest in the right lobe.
An upgrade on the Quadra was installed which included an Ultra-High sensitivity (UHS) reconstruction mode that increases the acceptance angle of detected events to include the entire length of the detectors. This mode is also known as MRD322. In NEMA phantom studies using this full acceptance angle increases the sensitivity by a factor of two compared to high sensitivity (HS) pre-update reconstructions [14]. We reconstructed each of the patient’s 7 image sets in both groups with the UHS reconstruction and repeated the quantitative analysis.
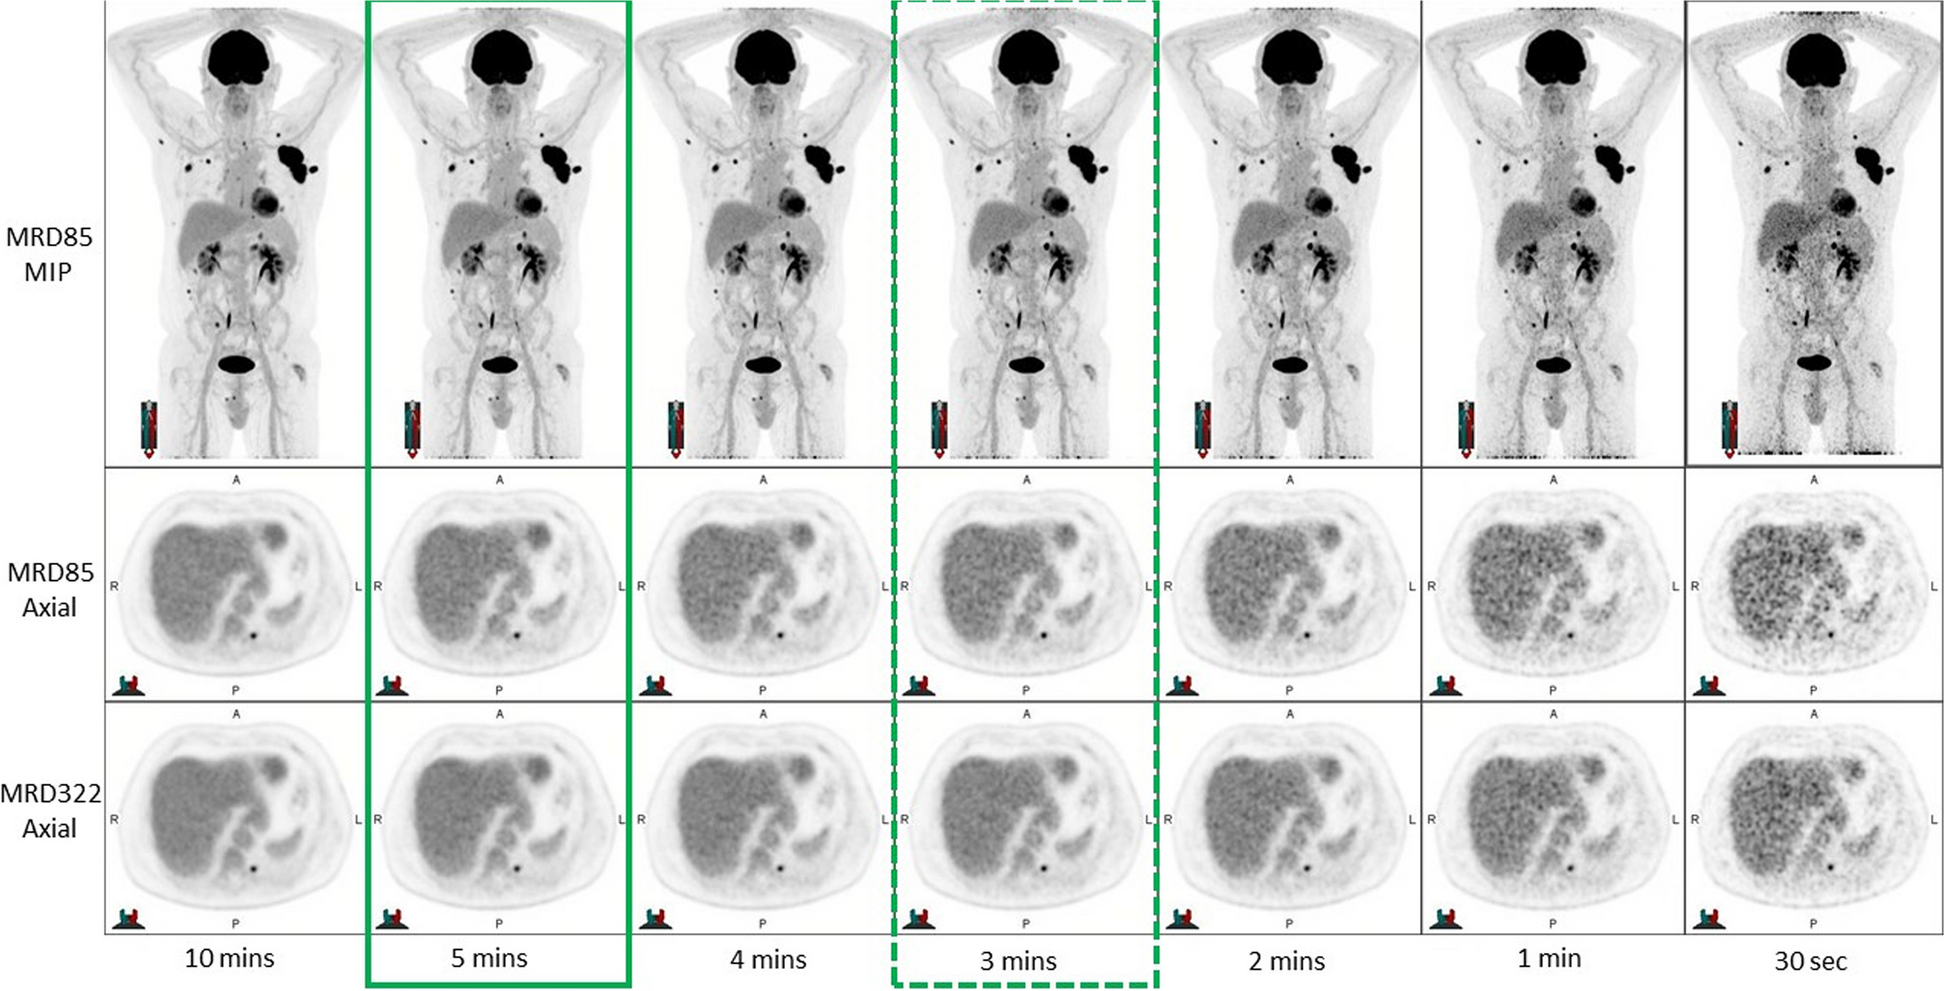
Qualitative image analysisAll image sets were independently reviewed by two Nuclear Medicine Physicians, each with more than 20 years of experience in reading PET studies, to assess: overall image quality, lesion detectability, and diagnostic reporting preference. This was performed by displaying all reconstructions from longest to shortest acquisition time in a single display for each individual patient as shown in Figs. 1 and 2 for 1 MBq/kg and 0.5 MBq/kg respectively.
Fig. 1
7 data sets for qualitative analysis – Low dose (1MBq/kg) The optimal time per frame is outlined with a solid green box and the minimal acceptable time per frame is outlined with a dotted green box based on the MRD85 reconstruction
Fig. 2
7 data sets for qualitative analysis – Ultra-low dose (0.5MBq/kg) The optimal time per frame is outlined with a solid blue box and the minimal acceptable time per frame is outlined with a dotted blue box based on the MRD85 reconstruction
For each patient, the reader was asked to nominate the following:
Minimum scan time—The minimum acceptable time was defined as the shortest scan where the images would be considered diagnostic and no clinically significant finding would be missed.
Optimal Scan time—The optimal time was defined as the acquisition time that produced high quality images where there was no significant perceived benefit in image quality from a longer acquisition, with the implicit goals of maximizing in patient comfort and departmental workflows. For each patient, the longest time per frame was considered the gold standard against which comparisons were made.
Quantitative image analysis -coefficient of variation (image noise)For both the Low Dose and Ultra-Low Dose groups, quantitative analysis was performed using MIM Encore (MIM software Inc, Version 7.2). 20mm 3D contours were placed in the liver for each individual patient with contours matched across the patient’s series of reconstructions.
From these contours, the SUVmean (standardised uptake value mean) and SUVsd (standardised uptake value standard deviation) was recorded for each reconstruction timepoint and used to calculate the coefficient of variation for the liver to indicate the level of noise in the reconstruction. The coefficient of variation (COV) is the ratio of the standard deviation to the mean.
Effective doseFor each individual patient, the effective dose from the [18F]-FDG injection and the DLP from the CT scan was calculated by the Siemens Software and recorded. The mSv effective dose from the CT was calculated by multiplying the DLP with the kfactor for torso of 0.015. These effective doses were averaged over both the 0.5MBq and 1MBq cohort to give an average total whole-body radiation dose for a hemi-body PET/CT scan.
Comments (0)