
Remember me


Adhesive selection was started with those referenced in fiber-based multimodal fMRI and neurophysiological studies [7, 17, 18, 25], as outlined in Online Supplement 1. Additional adhesives were included based on chemical class, availability, and affordability, and to introduce potentially new adhesive types for multimodal fMRI applications. Nail acrylics and household adhesives were specifically selected as accessible options to broaden the range of adhesives and to potentially introduce new adhesive types for multimodal fMRI. Clear nail acrylics, chosen for their lack of added pigments, and household glues, added due to their high accessibility, were included to address a wider variety of practical and experimental needs.
In total, we tested 31 adhesives for fiber fixation (Online Resource 1), grouping them based on conventional classifications commonly used in fields such as dentistry and orthodontics, as follows: silicone-based adhesives (sil.1–3), cement-based adhesives for medical use (cem.1–4), nail acrylics (nail.1–5), unfilled (unre.1–2) and filled dental resins (fire.1–6), bonding agents (boa.1–3), glass ionomer cements (glas.1), dental plasters (pla.1), and household acrylic adhesives (ha.1–5). A funnel approach was used to progressively eliminate adhesives with properties unfavorable to the experimental fMRI setting, with each experiment targeting specific properties. Therefore, not all adhesives were tested in every experiment.
For experiments with constrained geometry (see below), we employed 24 adhesives. For unconstrained geometry, we employed 30 adhesives. Shape tests and force measurements were performed on sil.2, glas.1, cem.1, nail.1, unre.1. The in vivo experiment used unre.1.
Sample preparation for in vitro MRIThree in vitro experiments were performed to assess susceptibility artifact formation and artifact depth caused by different adhesive properties. As sample, we used 20 mL syringes (diameter = 2 cm, length = 7.8 cm, BD Discardit™ II syringe, Becton Dickinson S.A., Fraga, Spain) filled with 1% agarose, because their curvature resembles a mouse cranium (hereafter referred to as tube). First, we evaluated the effects of magnetic field strength (7 T vs. 9.4 T) on susceptibility-induced signal deformations by applying adhesives in a standardized, constrained geometry at equal volume (see Sect. “Constrained geometry”). Second, to simulate practical application (e.g., on a mouse cranium), adhesives were applied unconstrained on tubes and examined at 9.4 T, accounting for differences in application techniques, handling characteristics (viscosity, precision of application, malleability), and curing (time and method, see Sect. "Unconstrained geometry"). Finally, to test the impact of patch shape, five adhesives were applied at equal weight (0.05 g) in two different shapes onto tubes (see Sect. "Adhesive shape comparison").
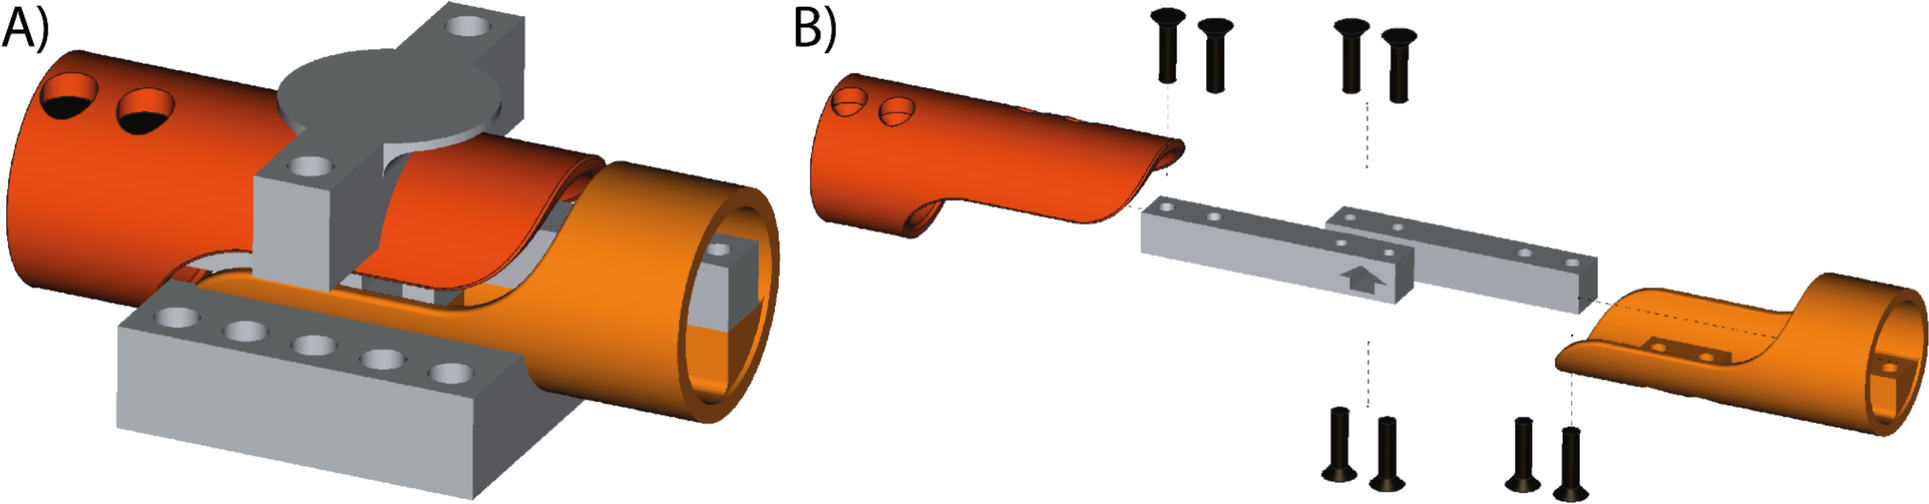
Constrained geometryTo investigate the impact of magnetic field strength 7 T vs 9.4 T on susceptibility artifact formation, samples were prepared as follows: adhesives were applied in a defined cylindrical shape (d = 7 mm; h = 3 mm) and volume (115 mm3) to cylindrical tubes. A custom-made detachable Teflon mold was used to control the shape and volume of the adhesive patches, with the patches’ centers aligned to notches on the tubes to facilitate patch identification during MRI (Fig. 1a). The mold ensured that all adhesives were applied perpendicular onto the tube. The adhesive patches stayed in shape once the Teflon mold was removed. Only for boa.2, minor shrinking of the patch was observed.
Fig. 1
Adhesive-induced susceptibility artifacts were studied with different experimental setups. a 24 adhesives that were easy to handle were applied at defined shape and volume (115 mm3) on agar-filled tubes. The tubes were marked with notches opposite to the centers of the adhesive patches to facilitate alignment with the magnet center. Scans were acquired with two slice packages, aligned contiguously at the center of the notch and adhesive. b 30 adhesives were applied in triplet patches, and the corresponding artifact depths within the tube were quantified using plot profiles from axial cross sections (see 2.4.2). c Five adhesives were applied in different shapes (spherical vs. flat) at constant weight (0.05 g) per patch
Unconstrained geometryDue to varying viscosities and handling characteristics, precise control over applied volumes was not possible, so we prioritized realistic application and natural dispersion to reflect actual use conditions. 30 adhesives were applied to agar-filled cylindrical tubes, with the amount determined by the adhesive’s viscosity to simulate practical use for fixing an experimental probe (e.g., optical fiber) to a mouse cranium.
All adhesives were applied to the horizontal tube with the applicator held at an angle. Application was usually performed in 4–6 small droplets, free of visible air entrapment, allowing them to melt and spread seamlessly. The droplets were shaped into three separate patches with varying amounts of adhesive, resulting in different heights and diameters (Fig. 1b). Patches with greater volumes exhibited a more spherical morphology, whereas smaller patches tended to be flatter. Low-viscosity adhesives were (light) cured before the subsequent application of droplets, whereas high-viscosity adhesives were applied without curing between drops.
For each adhesive, application techniques were optimized for the specific properties of each product, using either manufacturer-supplied applicators or adapted tools as needed (see below and Online Supplement 2), similar to established protocols [20]. Adhesives without built-in applicators were applied by syringe with a 20 G cannula (B. Braun SE, Melsungen, Germany) to form patches. When insufficient adhesive volume was available for syringe use, small amounts were collected on the cannula tip or on a rounded plastic stick, depending on adhesion to the applicator. Nail acrylics were applied with a manufacturer-supplied brush, producing larger drops (> 2 mm) for patch shaping. If sufficient amount of adhesive is available, application with a syringe and 20 G cannula improves precision. For two-component adhesives, mixing followed manufacturer guidelines, avoiding air inclusion. For certain high-viscosity adhesives, such as ha.2, complete removal of air inclusions proved challenging, impacting its final rating in the scoring system.
Adhesive shape comparisonTo specifically assess the impact of patch shape on the extent and depth of susceptibility artifact formation, further investigations were performed on selected adhesives previously used in ofMRI or neurophysiology experiments (sil.2, glas.1 [17, 26]), those supplied with a standardized application protocol (cem.1), and those easy to handle under experimental conditions (nail.1, unre.1). Adhesive patches (0.05 g each) were applied in two different shapes onto agar-filled tubes: One patch was spherical with a small diameter and the other patch was flatter with a relatively larger diameter (Fig. 1c). Adhesives were shaped and smoothed using the manufacturer-built applicator, the tip of a 20 G cannula or a plastic stick.
MRIIn vitroTo study the impact of adhesive properties on the formation of susceptibility artifacts, all samples were scanned with a 9.4 T small animal scanner (BioSpec 94/20, BGA12S gradient system: Gmax = 720 mT/m, slew rate = 5000 T/m/s, ParaVision 6.0.1, Bruker BioSpin, Ettlingen, Germany). Additionally, to investigate the effect of field strength on susceptibility artifacts, the samples with constrained geometry were also scanned with a 7.0 T small animal scanner (BioSpec 70/20, BGA12S: Gmax = 663 mT/m, slew rate = 4360 T/m/s, ParaVision 360v3.2, Bruker BioSpin). On both scanners, quadrature volume resonators (Bruker BioSpin) were used. Following adjustments, the sample position at the center of each scanner was determined in tri-pilot scans (fast low-angle shot (FLASH): TE = 4 ms, TR = 100 ms, flip angle = 30°, FOV = 40 × 40 mm2, 128 × 128 matrix, 2 mm slice thickness). Adhesive patches (identified via notches, Fig. 1a) were positioned in the center of the respective magnet and a local shim adjustment was performed under every patch, based on a B0 map (mapshim, Bruker BioSpin; 50% linewidth < 10 Hz for a 5 × 5 × 5 mm3 spectroscopy voxel). Finally, the extent of signal deformations associated with the adhesive patches was visualized using a multislice 2D gradient-echo EPI (GE-EPI) sequence. The sequence parameters reflected standard fMRI conditions [27, 28] and were as follows: TE = 18 ms; TR = 1 s; flip angle = 60°; FOV = 35 × 35 mm2; 100 × 100 matrix; 0.5 mm slice thickness with partial Fourier transform = 1.15 in phase-encoding direction; bandwidth = 277,777.8 Hz.
The samples with constrained geometry were recorded with two contiguous slice packages with 23 slices each to cover the entire extent of the patch and susceptibility artifacts while staying within the defined TR. The slice packages were placed around the center of each adhesive patch (Fig. 1a). All other experiments were performed only at 9.4 T. Signal deformations were determined from the same 2D GE-EPI sequence, however, here, only one stack of 23 axial slices was recorded per adhesive. The effects of adhesive patch shape on image artifacts were determined from axial and sagittal image stacks.
In vivoFinally, the impact of adhesives’ properties on susceptibility artifacts due to patch shape was assessed in vivo during ofMRI experiments. These experiments were performed with a total of n = 8 C57BL6/J mice of both sexes (25.5 g ± 4.8 g) under an established isoflurane/medetomidine anesthetic regimen [28]. All experiments complied with the German Tierschutzgesetz and were approved by the State Agency for Nature, Environment and Consumer Protection North Rhine-Westphalia (LANUV, 81–02.04.2018.A013).
To prepare the cranium, a 1 cm-diameter area was exposed and etched for 15 s with 37% phosphoric acid (DMG Chemisch-Pharmazeutische Fabrik GmbH, Hamburg, Germany) to optimize adhesion [17]. Following craniotomy, an optic fiber (diameter 200 µm) was positioned at the primary sensory hind limb cortex (from bregma, anterior–posterior: − 0.82 mm, left–right: + 0.15 mm) at a depth of 300 µm from the dura mater. The optic fiber was secured with adhesive unre.1, applied in one of two ways: by creating multiple < 1 mm-diameter adhesive drops, combined into high patches with minimal cranium surface contact (spherical patch, Fig. 1c), or by spreading the adhesive over the entire exposed cranium area (flat patch, Fig. 1c). During application, the adhesive was repeatedly cured with blue light to prevent uncontrolled spreading due to unre.1’s low viscosity. In vivo MRI was performed at 9.4 T using a receive-only 2 cm surface coil, with the optic fiber passing through the coil’s center. A thin layer of low melting 1% agarose gel (Agarose Standard, Carl Roth GmbH & Co. KG, Karlsruhe, Germany) was applied over the fixed fiber and the adhesive [18]. While the gel cooled, a 2 × 2 cm2 piece of laboratory film (Brand® Seal-R-filmTM, Brand GmbH & Co. KG, Wertheim, Germany) was placed between the agar and surface coil to protect the coil.
A quadrature volume resonator was used for excitation. While pre-scan adjustments were identical to the in vitro scans, the in vivo single-shot GE-EPI sequence was optimized for the morphology of a mouse cranium: FOV = 14 × 12 mm2; 70 × 60 matrix without partial Fourier transform; bandwidth = 200 kHz [27, 28]. Furthermore, a T2-weighted fast spin-echo sequence was used to image brain anatomy without susceptibility effects (rapid acquisition with relaxation enhancement, RARE: TE = 50 ms; TR = 2000 ms; 4 averages; RARE factor = 8; FOV = 14 × 12 mm2; 140 × 120 matrix; slice thickness and position corresponding to GE-EPI).
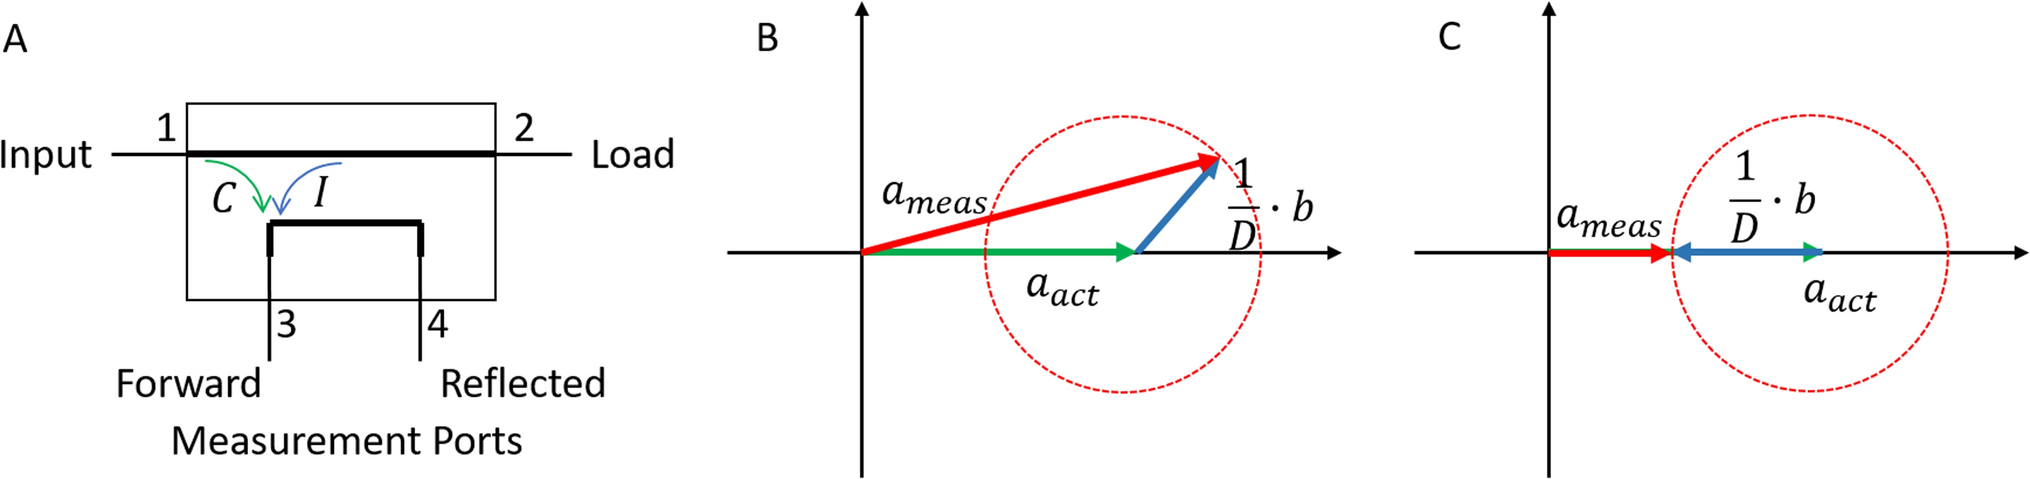
Analysis of susceptibility artifacts via signal deformationAnalysis of samples with constrained geometryTo analyze the effect of field strength on adhesive-induced susceptibility artifacts, we performed a volumetric analysis. For this purpose, the adjacent slice packages used to scan individual adhesive patches were stitched together using Horos 4.0.0 (Nimble Co LLC d/b/a Purview, Annapolis, MD, USA). First, the actual tube volume was fit to the stitched MR images via circular regions of interest (ROI) with a diameter of 2 cm per slice (total volume for 46 slices Vtube = 6.914 cm3, Fig. 2a). Then, a 3D growing region was placed to outline the deformed signal of the tube (Vsig, Fig. 2b). The lower threshold for the growing region was one-third of the maximum signal intensity in slice 23 of the stitched slice package. From Vtube and Vsig, the following volumetric signal deformations were determined: (1) total signal deformation ΔV = Vsig–Vtube (Fig. 2e and f); (2) positive signal deformation beyond the top half of the syringe Vout_top (Fig. 2c); (3) positive signal deformation beyond the lower half of the tube Vout_bottom (Fig. 2c); (4) negative signal deformation inside the tube Vneg (Fig. 2d).
Fig. 2
a At the center of an adhesive spot, the signal in an axial GE-EPI extended beyond a 2 cm-diameter circular ROI that represented the tube outline. The artifact at the bottom of the image derived from the notch underneath the adhesive (see Fig. 1a). b Segmentation of positive and negative signal deformations. Vsig thus included Vout_top and Vout_bottom, but not the negative signal deformations Vneg. c Positive signal deformations Vout_top and Vout_bottom protruded beyond the tube volume. d Negative signal deformations were found inside the tube volume. 3D renders of small (e) and large (f) volumetric deformations at 9.4 T associated with different adhesives at the top center of the volume
Analysis of samples with unconstrained geometry or defined adhesive shapeFor in vivo experiments, the penetration of MRI signal extinction into the cortex poses a significant challenge for analyzing the BOLD signal, as critical neuronal structures, such as the pyramidal cell layers of the neocortex, lie 0.3–1.3 mm beneath the mouse cranium. Therefore, our subsequent analyses focused on characterizing the magnitude of susceptibility artifacts towards the edges of the adhesive patch. The artifact depth for each patch was quantified in vitro by measuring the maximum extent of the artifact. This was done by placing a line across the tube’s cross section, extracting the signal profile, and determining the half-maximum position from the fitted curve.
Adhesive force measurementsIn a preclinical MRI setting, the primary characteristic of adhesives, besides avoiding excessive artifact induction, is to securely attach implants to the cranium. Therefore, we measured their adhesive strength on the crania of post-mortem C57BL/6 mice for the adhesives that were also selected for shape tests (sil.2, glas.1, cem.1, nail.1, unre.1; see Sect. “Adhesive shape comparison”). The crania were prepared following a protocol similar to previous ofMRI experiments [17], with the surface etched for 15 s with 37% phosphoric acid (DMG Chemisch-Pharmazeutische Fabrik GmbH). Adhesives were applied within a 3 mm radius from Bregma with an unconstrained shape to secure a 4 mm loop of self-dissolving synthetic suture (Spool Suture PGA Violet, Henry Schein, Melville, NY, USA) to the cranium. The opposite end of the suture was attached to the materials testing machine (Zwick Z005, ZwickRoell GmbH & Co. KG, Ulm, Germany) through another loop. Mouse crania were clamped in the machine’s tensile direction aligned with the mechanical load on the cranium, adhesive, and suture. A 3D-printed clamping device, adapted for mice, was used to hold the cranium in place. A pull-out test was then performed. After a preload force of 1 N, the machine moved at 0.1 mm/s, recording data every 0.01 s. A force reduction to 80% of the maximum force was selected as the tear-out criterion and maximum force (Fmax) was recorded as quantitative measure. Adhesives were randomly tested on different crania, with glas.1 applied last since it was not possible to remove its residue. Each adhesive was tested on five crania, except sil.2, which failed to consistently adhere or sustain the pre-tensioning force, reducing the silicone samples from five to three.
Integrative scoring of adhesive propertiesTo integrate the different characteristics we examined, we developed a scoring system to semi-quantitatively compare the properties of adhesives relevant in the context of fMRI. This system rates each characteristic from 0 (poor) to 3 (excellent; Table 1). Scores for image artifacts were based on a ranking of adhesives with lowest mean artifact depths from unconstrained geometry tests awarded highest scores. Handling was judged based on personal observations: it was best to fix fibers by applying multiple small adhesive drops (< 2 mm each) that can then be modeled into a flat patch around the fiber. Assisted curing using blue/UV light or compound mixing was preferential as it was faster than air curing. Insufficient handling was assigned to adhesives that lacked dedicated application methods, e.g., high viscosity prevented them from being applied via a syringe. Good handling was awarded to adhesives that came with a manufacturer-built applicator.
Table 1 Scoring system for adhesive propertiesStatisticsPearson correlation coefficients were calculated to assess the linear relationship between artifact volumes at different field strengths and the relationship between susceptibility artifact depth and patch height after unconstrained application. All group results were tested for normal distribution (Shapiro–Wilk) and equal variance (Levene). For constrained geometries, results across adhesive classes were compared using one-way ANOVA with Tukey’s post hoc test. Positive and negative signal deformations between 9.4 T and 7.0 T were compared using paired t tests. In case of non-normal distribution or unequal variances, Wilcoxon matched-pair signed-rank tests were performed. To determine artifact depth for unconstrained geometries, a line was placed radially along the tube cross section to extract the signal profile using FIJI (ImageJ v1.53t); this profile was then fitted to a logistic function to determine the half-maximum position, using GraphPad Prism (v9, GraphPad Software, Boston, MA, USA). The height of an adhesive patch together with the associated artifact depth, as well as the maximum force results from the pull-out tests were compared across classes using the Kruskal–Wallis test (due to unequal variances) followed by an all-pairwise comparison with Bonferroni correction. Artifact depths of different adhesive patch shapes were compared using Student’s t test. All tests were performed with SPSS (v29, IBM, Armonk, NY, USA) at a significance level α = 0.05. Values are given as group means ± standard deviation.
Comments (0)