Patient sample collection and data recording
Ten patients who underwent laparoscopic gastrointestinal surgery were included in this study. The patient recruitment was approved by the Ethics Committee of the Third Affiliated Hospital of Sun Yat-sen University (II2023-272-01). Samples of peritoneal drainage fluid and blood were collected from patients immediately and 6 h after surgery for analysis. To minimize the risk of blood contamination, we specifically selected drainage fluid that was distant from the abdominal incision drainage tube. Furthermore, to ensure that the sample remained unaffected by blood cells, we promptly subjected the collected drainage fluid to low-temperature centrifugation and subsequently stored it at -80℃. The operative duration was recorded from the surgical anesthesia center system, and the time of the first postoperative flatus was obtained from the gastrointestinal surgery nursing system.
Establishment and treatment of the mouse intestinal I/R injury model
This animal study was approved by the Animal Ethics Committee of the South China Agricultural University (2023F202). Male C57BL/6J mice (6–8 weeks old) were purchased from the Animal Center of South China Agricultural University. The animals were housed under specific pathogen-free conditions with a standard 12/12 h light/dark cycle. The mice fasted the night before the experiment but were permitted free access to water. The experimental groups were as follows: sham, I/R, and Micro DEA2k. With reference to the literature, after the mice were anesthetized with 1% isoflurane (Shenzhen RWD Life Science), a midline incision was made, the layers were opened, and the superior mesenteric artery (SMA) was isolated. A noninvasive microvascular arterial clamp was used to occlude the SMA for 45 min, after which the clamp was removed to restore SMA blood flow [17, 18]. The abdominal incision was closed with continuous sutures using 3 − 0 silk thread. For the Micro DEA2k (0.4 mg/mL) group, 1 mL was injected intraperitoneally before closing the incision. The I/R group was intraperitoneally injected with an equal volume of 1× phosphate buffered saline (PBS) (ProCell). For the Sham group, the SMA was isolated without clamping. Immediately after surgery, each mouse was injected subcutaneously with preheated sterile saline (0.5 mL) for fluid resuscitation and was kept warm using a heating pad. Mice were monitored for 24 h to record their survival rates. Clinical scoring was also performed based on the following criteria: 0, no symptoms; 1, piloerection and huddling; 2, piloerection, huddling, and diarrhea; 3, lack of interest in the surroundings and severe diarrhea; 4, reduced movement and lethargy; and 5, loss of self-righting reflexes [19]. The mice were humanely euthanized at a score of 5.
Molecular docking
The Drew-Dickerson dodecamer (1BNA) was used as the DNA model for molecular docking. Its crystal structure file was obtained from the Protein Data Bank database, which was saved as a pdbqt file after removing water molecules and adding hydrogen using AutoDock 4.2.6 and AutoDockTools 1.5.7 [20, 21]. Two consecutive repeating units of the cation segment were selected as the model ligands. After MM2 energy minimization, they were converted into pdb format using OpenBabel 3.1.1 (with an extra setting of hydrogen addition at pH = 1 for the protonated ligand model) and imported into AutoDockTools 1.5.7, where Gasteiger charges were added after the addition of hydrogen. After setting the torsional bonds and torsional centers, the file was exported as a pdbqt file. The size of the lattice point region was set to 60 nm × 80 nm × 120 nm, such that the docking active site spanned the entire DNA molecular model, with a spacing of 0.375 Å. After exporting the gpf file, AutoGrid was used to perform lattice point calculations. The parameters related to molecular docking were set using a genetic algorithm (GA) to generate 100 final conformations. Each run had a maximum energy evaluation of 2.5 million times and a maximum number of steps of 27,000, with all other parameters retaining their default system settings. In the docking run options, parameters such as random number generation, energy, step size, and export format were retained at their default settings. The dpf file was exported using the Lamarckian GA. Finally, the dpf file was used to perform molecular docking, and the molecular docking binding energies were calculated using the dlg file. The binding pose with the lowest energy was selected and visualized using UCSF Chimera 1.16. The unbound state is defined as the state in which the ligand reaches equal free energy at different positions when it is far away from the receptor, and it can be assumed that no interaction occurs between the receptor and ligand.
Synthesis of DEA2k and Micro DEA2k
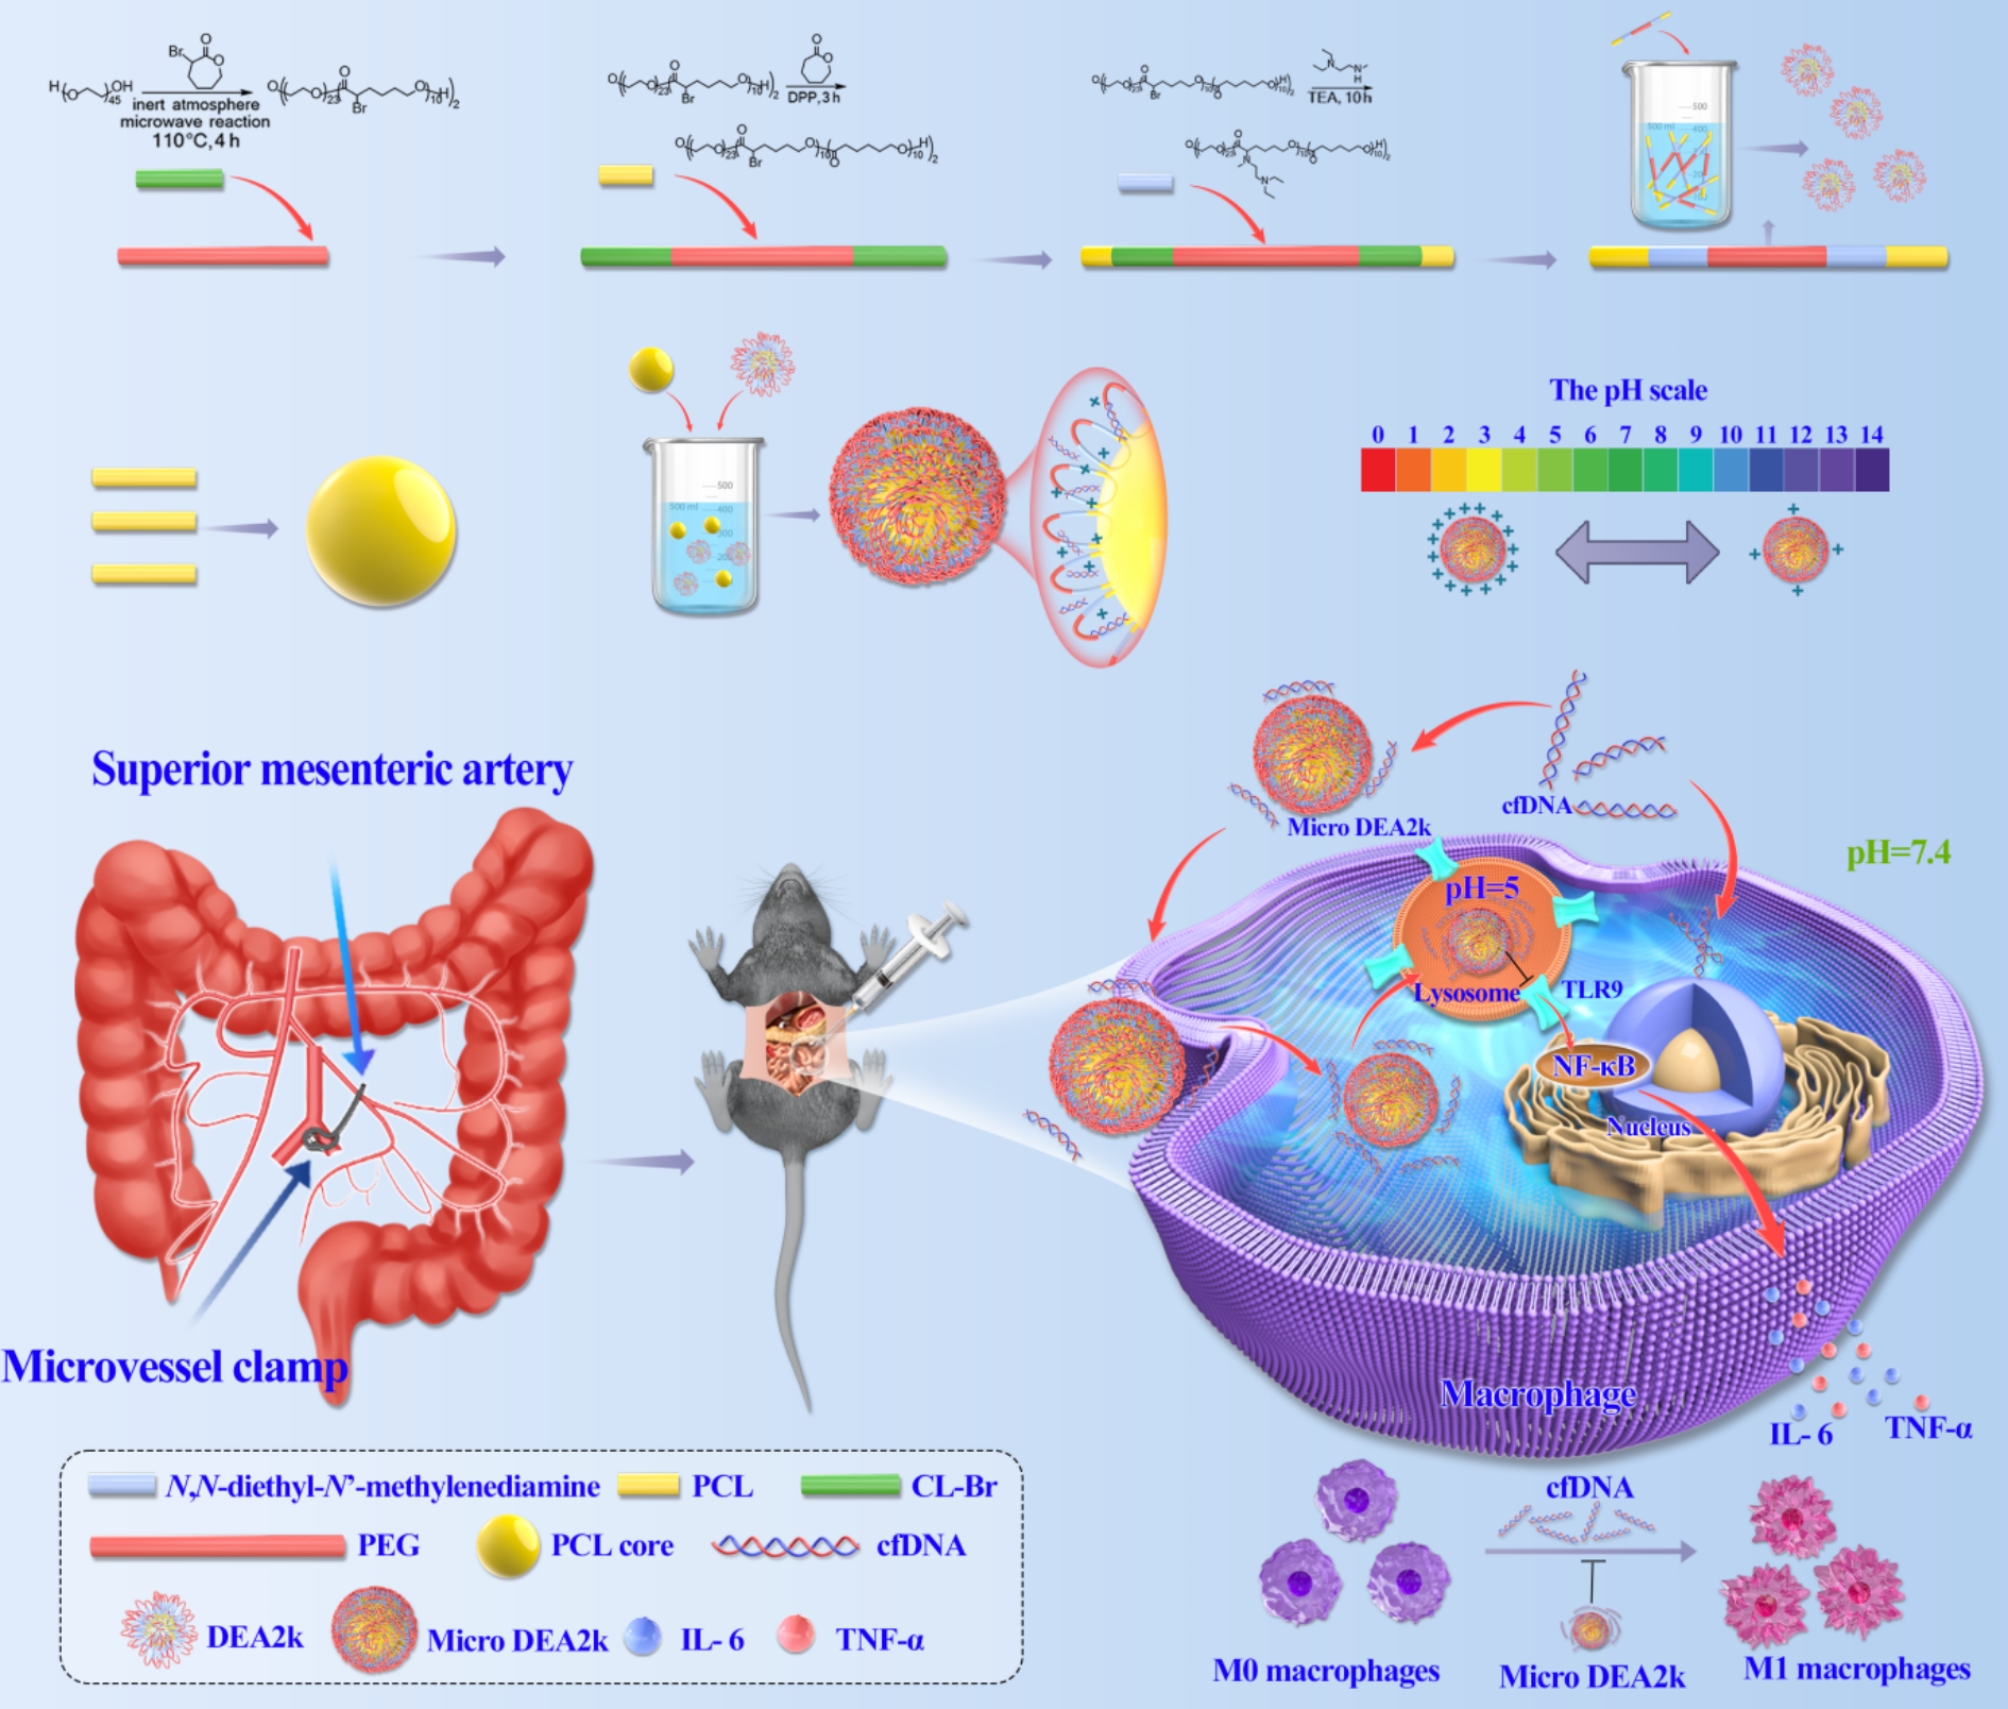
Synthesis of α-bromo-ℇ-caprolactone (CL-Br). Initially, 57.12 g of N-bromosuccinimide (NBS, 99.00%, Aladdin) and 5.81 g of p-toluenesulfonic acid (98.5%, Aladdin) were dissolved in 200 mL of dichloromethane (DCM, 99.5%, Guanghua Sci-Tech) and stirred in an ice-water bath. Then, 30.00 g of cyclohexanone (99.0%, Macklin) was added dropwise. The mixture was subjected to cold vacuum filtration to remove the salts, followed by extraction and washing. The extraction was performed using a saturated sodium chloride solution, followed by washing and drying over anhydrous sodium sulfate to obtain 38.52 g of 2-bromocyclohexanone. Next, the 2-bromocyclohexanone was dissolved in 250 mL of DCM, and m-chloroperoxybenzoic acid (mCPBA, 55.07 g, 239.35 mmol) was added. The mixture was refluxed overnight at 50 °C and then cooled. The solution was extracted with saturated sodium thiosulfate solution, saturated sodium bicarbonate solution, and deionized water. It was then extracted with saturated sodium chloride solution to remove water and dried over anhydrous sodium sulfate overnight. The resulting crystals were recrystallized from a DCM/n-hexane mixture at -20 °C to obtain 23.48 g of white crystals, identified as CL-Br. The product was placed in a microwave reactor (Initiator+, Biotage) with 3.41 g of the macroinitiator PEG (average Mn 2000, Aladdin) and reacted at 110 °C for 4 h for ring-opening polymerization (ROP), which produced 8.84 g of the triblock copolymer P(CL-Br)-b-PEG-b-P(CL-Br). Following this process, the triblock copolymer initiated ROP in 2.57 g of ε-caprolactone (97%, Bide Pharmatech), which yielded the pentablock copolymer PCL-b-P(CL-Br)-b-PEG-b-P(CL-Br)-b-PCL. Next, 2 g of the pentablock copolymer was weighed and modified by adding 1.51 g of N, N-diethyl-N’-methyl ethylenediamine (98%, Macklin); the resulting product was named DEA2k. After 1 mg/mL of DEA2k was mixed evenly with 1 mg/mL of PCL microspheres, centrifugation was performed using a tabletop centrifuge (Centrifuge 5810R, Eppendorf) at 15,000 rpm for 10 s to precipitate the microspheres. The supernatant containing free DEA2k was removed. The mass mm of the microspheres was obtained by lyophilization using the weight reduction method, and the total mass mt was obtained by lyophilization after direct mixing. The surface polymer content per unit mass of microspheres was calculated to be 85.7% using the following formula:
$$\:\frac__}}_}\times\:\:100\text$$
(1)
The vast majority of the polymers were successfully attached to the surface of the microspheres, and the product was named Micro DEA2k.
Characterization of DEA2k and Micro DEA2k
Proton nuclear magnetic resonance (NMR) spectra were recorded at room temperature using an NMR spectrometer (AVANCE III 400 MHz, Bruker). The relative molecular weight and dispersity were measured by gel permeation chromatography (GPC) (1260 Infinity, Agilent). The morphology was characterized using transmission electron microscopy (TEM, JEOL1400+). The hydrated size (Size), polydispersity index (PDI), and zeta potential were measured by dynamic light scattering (DLS, Malvern Zetasizer Nano ZS) at 25 ºC.
In vitro cytotoxicity assay
RAW264.7 cells, purchased from the ATCC cell bank, were cultured in Dulbecco’s modified Eagle’s medium (DMEM; Gibco Life Technologies), which contained 10% fetal bovine serum (FBS; Gibco Life Technologies) and 1% bispecific antibody (Pen Strep, Penicillin Streptomycin, Gibco) in an incubator (Steri-Cycle 371, Thermo Scientific) at 37 °C and 5% carbon dioxide. Cells in good condition were selected and seeded into a 96-well plate at approximately 104 cells per well. After culturing overnight, the culture medium was replaced with fresh medium containing different concentrations of cationic polymers. After 24 h of incubation, 10 µL of 5 mg/mL methylthiazolyldiphenyl-tetrazolium bromide solution (MTT, 98%, Sigma-Aldrich) was added and incubated for another 4 h. After removing the supernatant, 10 µL of dimethyl sulfoxide (DMSO, 99.7%, Guangzhou Chemical Reagent Factory) was added to each well to dissolve the pellet. Finally, the absorbance was measured at 570 nm using a microplate reader (BioTek Synergy2 Gen 5). The cell survival rate was calculated by (Q–Q0)/(Q1–Q0)×100%, where Q is the optical density (OD) of cells with the polymer, Q0 is the OD of wells without cells, and Q1 is the OD of cells without the polymer. Each experiment was repeated three times. The IC50 was calculated by fitting a logistic equation.
Protein adsorption capacity assay
Resistance to protein adsorption was assessed using the BCA Protein Assay Kit (Pierce™ BCA Protein Assay Kit, Thermo Scientific). Firstly, 50 µL of 2 mg/mL bovine serum albumin (BSA, Aladdin) solution was mixed evenly with 50 µL of 1 mg/mL cationic material. The control group was established by mixing 50 µL of deionized water with 50 µL of BSA solution. After incubation at 37 °C in a shaker for 1 h, the samples were centrifuged at 8000 rpm for 5 min, and the supernatant was collected. Calibration curves were obtained for BSA solutions with different concentrations, and the residual BSA concentration in the sample supernatant was determined based on ultraviolet absorption (280 nm). The amount of BSA adsorbed onto the cationic polymer was calculated using (CC–CT)V/m, where CC is the BSA concentration of the control group (1 mg/mL), CT is the BSA concentration of the supernatant after the addition of the cationic polymer, V is the volume of the solution (100 µL), and m is the weight of the cationic polymer (50 µg). Each experiment was repeated three times.
Potentiometric acid-base titration
DEA2k was dissolved in 10 mL of hydrochloric acid standard solution to yield a concentration of 500 µM (amine group content: 10 mM), and 0.1 M sodium hydroxide standard solution was gradually added dropwise to yield a pH of 2.00; this served as the starting point for the titration. Next, a 0.1 M sodium hydroxide standard solution was added dropwise with constant stirring, and the cumulative amount of sodium hydroxide solution added and the corresponding pH value were measured, and the titration curve was plotted. The peak of the first-order derivative of the curve is the point of sudden pH change, defined as the starting and ending points of amine protonation. The relationship between the degree of protonation α and pH during the process was calculated by using the following equation:
$$\:\alpha\:\:=\:\frac_-\:\frac_+\varPhi\:)\varDelta\:_}_}\right)-V}_-\:\frac_+\varPhi\:)\varDelta\:_}_}\right)-\left(_-\:\frac_+\varPhi\:)\varDelta\:_}_}\right)}$$
(2)
where Φ is the pH value of the solution, V is the cumulative volume of sodium hydroxide solution added at that pH, and subscripts i and t denote the starting and ending points of deprotonation, respectively. The protonation curve of the cationic polymer was fitted by a combination of two logistic equations, calculated as follows:
$$\:\alpha\:\:=\:E\left(1-\frac_}\right)}^_}}\right)\:+\:(1-E)\left(1-\frac_}\right)}^_}}\right)\:,$$
(3)
where B1 and C1 correspond to easier-to-protonate amine groups, B2 and C2 correspond to harder-to-protonate amine groups, and E represents the proportion of easier-to-protonate amine groups. The buffer capacity (β) at different pH values can be calculated from the fitted degree of protonation of the cationic polymer, and the formula is as follows:
$$\:\beta\:\:=\:(_-\:_-\frac_-\varPhi\:)\varDelta\:_}_}\:-\:\frac_)\varDelta\:_}_})\frac$$
(4)
Measurement of DNA binding capacity
The binding capacity of the cationic polymer to CpG1826 was measured by agarose gel electrophoresis. Cationic polymer solutions with different concentrations were mixed with 0.4 µL of 1 mg/mL CpG1826 solution (ODN 1826, 5’-tccatgacgttcctgacgtt-3,’ GenScript) to obtain complex solutions with different nitrogen-to-phosphorus ratios, and the CpG1826 aqueous solution was used as a blank control. After allowing the solutions to stand at room temperature for 0.5 h, they were added to 2 µL of 1% agarose gel containing a nucleic acid dye (Goldview nucleic acid dye (10,000 × DMSO), Biosharp, China). Electrophoresis was performed in 1% tris-acetate-EDTA (TAE) buffer solution (voltage 60 V, 45 min, DYY-6 C, Beijing Liuyi). Finally, the gels were photographed and analyzed using a gel imaging system (Gel Doc XR+; Bio-Rad).
The binding capacity of the cationic polymer was quantitatively assessed by competitive binding to ethidium bromide (EtBr). Firstly, 2.17 µL of 1 mg/mL EtBr (94%, Acros Organics) was added to 3 mL of PBS or sodium acetate buffered solution (SABS) to simulate different pH values, and the fluorescence emission spectrum of the solution was measured. Then, 10 µL of 1 mg/mL ctDNA (Sigma-Aldrich) solution was added and mixed evenly to increase the fluorescence intensity of the solution. Subsequently, different volumes of cationic polymer solution (1 mg/mL) were added sequentially and mixed. The fluorescence emission curve was measured using a fluorescence spectrometer (excitation wavelength: 280 nm, detection emission wavelength: 500–800 nm).
In vitro anti-inflammatory assay
RAW264.7 macrophages were added to 96-well plates at a density of 1 × 10⁴ cells/well. Cells were cultured in DMEM containing 10% FBS for 12 h. The culture medium was replaced with fresh medium containing CpG1826 (0.5 µM), and the cells were co-cultured for 4 h before discarding the medium. After washing three times with PBS, fresh medium containing cationic polymer (25 µg/mL) was added, and the cells were incubated for 24 h. Then, the supernatant was collected for TNF-α and IL-6 assays. The group without CpG1826 and cationic polymer in the medium served as the control group.
Western blot
RAW264.7 macrophages were added to 6-well plates at a density of 2 × 10⁵ cells/well. Cells were cultured in DMEM containing 10% FBS for 12 h. The culture medium was replaced with fresh medium containing CpG1826 (0.5 µM), and the cells were co-cultured for 4 h before discarding the medium. After washing three times with PBS, fresh medium containing cationic polymer (25 µg/mL) was added, and the cells were incubated for 24 h. Centrifugation was performed to collect the cells, and RIPA lysis buffer (Beijing Solarbio Technology Co., Ltd.) was added, boiled, and centrifuged. The supernatant was collected to obtain the protein samples. The different protein samples were separated by 10% sodium dodecyl sulfate polyacrylamide gel electrophoresis (SDS-PAGE), and the proteins on the PAGE gel were transferred to polyvinylidene fluoride (PVDF) membranes. The PVDF membrane bands of the corresponding protein molecular weights and appropriate sizes were excised and blocked in a solution of skim milk powder for 1 h. Then, they were incubated overnight on a shaker at 4 °C with the following primary antibodies: anti-p65 (1:1000) (Cell Signaling Technology, 8242 S, USA), anti-pp65 (1:1000) (Cell Signaling Technology, 3033 S, USA), anti-TLR9 (1:1000) (ABclonal, A14642, China), anti-MyD88 (1:1000) (ABclonal, A0980, China), and anti-β-actin (1:50000) (ABclonal, AC026, China). After the primary antibodies were recovered, the samples were washed thrice with tris-buffered saline with Tween 20 (TBST) solution (Biosharp, BL315B, China) for 6 min each and incubated with an anti-rabbit IgG secondary antibody (1:20000) (Cell Signaling Technology, 7074 S, USA) at room temperature for 1 h. After discarding the secondary antibody, the samples were washed three times with TBST for 6 min each, and enhanced chemiluminescence (ECL) exposure solution (Shanghai Beyotime Biotechnology Co., Ltd.) was added dropwise for imaging.
Confocal laser scanning microscopy
RAW264.7 macrophages were seeded at a concentration of 4 × 10⁵/mL in glass-bottom confocal dishes and incubated overnight. After washing three times with PBS, serum-free DMEM was added, which contained 0.5 µM FAM fluorescently labeled CpG1826 (FAM-CpG1826, GenScript Biotech). After co-culturing for 4 h, the cells were washed three times with PBS, and serum-free DMEM was added, which contained 25 µg/mL Micro DEA2k. After culturing for another 4 h, the medium was discarded and the cells were washed three times with PBS. Next, the cells were incubated with 0.2/mL of lysosomal green fluorescent probe (LysoTracker™ Green DND-99, Invitrogen) in serum-free DMEM for 30 min in the dark, followed by 1 µg/mL of bisbenzimide H 33,342 trihydrochloride (Hoechst 33342, Sigma) in PBS for 10 min in the dark for staining. The colocalization of lysosomes, CpG1826, and Micro DEA2k was analyzed using a laser confocal microscope (TCS SP8, Leica Microsystems, GmbH).
cfDNA purification and quantification
cfDNA was purified from serum, peritoneal drainage, and lavage fluid using a DNA purification kit (PCR Purification Kit/DNA Purification Kit, D0033, Shanghai Beyotime Biotechnology Co., Ltd.), and the concentration of cfDNA was measured using an ultra-micro spectrophotometer (Thermo NanoDrop 2000, Thermo Fisher Scientific Inc.).
HE staining
After fixation for 24 h, the tissue samples were embedded in paraffin and sectioned using a paraffin microtome (Leica) to obtain tissue sections with a thickness of 2 μm. Sections were deparaffinized, stained with hematoxylin and eosin (HE), washed, dehydrated, and mounted. Routine HE staining was used to assess the histomorphological changes in major organs, and an intelligent pathology imaging system microscope (Vectra, PerkinElmer) was used for image acquisition and analysis. The degree of small intestinal injury after reperfusion was assessed using the modified Chiu’s method, which is based on changes in the intestinal mucosal villi and glands [22]. The histological damage to the lungs, kidneys, and liver was assessed using their respective scoring systems [23,24,25]. Automated image analysis was performed on five randomly selected 200× magnification images from each sample.
Immunohistochemistry
After preparing paraffin sections according to the steps above, the expression and location of F4/80 were detected using a primary anti-F4/80 antibody (1:500) (GB113373, Servicebio) and a labeled goat anti-rabbit secondary antibody (1:200) (GB23303, Servicebio). The expression and localization of TLR9 were detected using a primary anti-TLR9 antibody (1:300) and a labeled goat anti-rabbit secondary antibody (1:200) (GB23303, Servicebio). The expression and location of MyD88 were detected using a primary anti-MyD88 antibody (1:1000) (GB111554, Servicebio) and a labeled goat anti-rabbit secondary antibody (1:200) (GB23303, Servicebio). The expression and localization of p65 were detected using a primary anti-p65 antibody (1:500) (#8242, Abcam) and labeled goat anti-rabbit secondary antibody (1:200) (GB23303, Servicebio). Finally, using an intelligent pathology imaging system microscope (Vectra, PerkinElmer) for image acquisition and analysis, automated image analysis was performed on five randomly selected 200× images from each sample to quantify the relative intensities of protein staining for F4/80, TLR9, MyD88, and p65.
Enzyme-linked immunosorbent assay
The concentrations of TNF-α and IL-6 in the culture supernatant of RAW 264.7 cells were measured using the Mouse TNF-α Enzyme-Linked Immunosorbent Assay (ELISA) Kit (JL10484) and the Mouse IL-6 ELISA Kit (JL20268), respectively. The concentrations of TNF-α, IL-6 and MCP-1 in mouse serum and peritoneal lavage fluid were measured using the Mouse TNF-α ELISA Kit (JL10484), Mouse IL-6 ELISA Kit (JL20268), and Mouse MCP-1 ELISA Kit (JL20304), respectively. The concentrations of LPS and FABP2 in the mouse serum were determined using mouse LPS ELISA kits (JL20691) and mouse FABP2 ELISA kits (JL20694). All the reagents were sourced from Shanghai Jianglai Biotechnology Co., Ltd.
Analysis of biochemical parameters
Serum creatinine (CRE) content was calculated by measuring the absorbance at 546 nm using a Mouse Creatinine Assay Kit (Sarcosine Oxidase Method; JL-T0928, Shanghai Jianglai Biotechnology Co., Ltd.). Serum blood urea nitrogen (BUN) content was calculated by measuring the absorbance at OD = 625 nm using a Mouse Urea Nitrogen Assay Kit (Enzyme Method; JL-T1014, Shanghai Jianglai Biotechnology Co, Ltd). Serum alanine aminotransferase and aspartate aminotransferase (ALT/AST) levels were calculated by measuring the absorbance at 340 nm using a Mouse Serum ALT/AST Assay Kit (JL-T2637, Shanghai Jianglai Biotechnology Co, Ltd.).
Flow cytometry analysis
RAW264.7 macrophages were added to 6-well plates at a density of 2 × 10⁵ cells/well. Cells were cultured in DMEM containing 10% FBS for 12 h. The culture medium was replaced with fresh medium containing CpG1826 (0.5 µM), and the cells were co-cultured for 4 h before discarding the medium. After washing three times with PBS, fresh medium containing cationic polymer (25 µg/mL) was added, and the cells were incubated for 24 h, then centrifuged and resuspended. The cells were then treated with a viability dye (1:500) (423101, Biolegend), blocked with CD16/32 (1:50) (101302, Biolegend), and stained with a CD86 antibody (1:80) (105012, Biolegend).
Peritoneal lavage fluid was collected 6 h after reperfusion using the method described above and centrifuged to obtain a single-cell suspension. The supernatant was discarded, leaving the cell pellet, which was treated with a viability dye (1:500) (423101, BioLegend) and blocked with CD16/32 (1:50) (101302, BioLegend). This was followed by staining with mouse CD45 (1:80) (103154, BioLegend, USA), F4/80 (1:80) (123137, BioLegend, USA), CD11b (1:200) (101206, BioLegend, USA), and CD86 (1:80) (105012. Biolegend, USA).
After sacrificing the mice, the spleen was bluntly dissected and the surface capsule and adipose tissue were discarded. After grinding the tissue sample, red blood cell lysis buffer was added, followed by resuspension and centrifugation. The cell pellet was then treated with a viability dye (1:500) (423101, BioLegend) and blocked with CD16/32 (1:50) (101302, BioLegend). This was followed by staining with mouse CD45 (1:80) (103154, BioLegend, USA), F4/80 (1:80) (123137, BioLegend, USA), CD11b (1:200) (101206, BioLegend, USA), and CD86 (1:80) (105012. Biolegend, USA).
After staining, the cells were washed and resuspended in 1% BSA buffer. Finally, flow cytometry data were collected using a flow cytometer (Attune NxT, Thermo Fisher Scientific) and analyzed using FlowJo software (10.8.1).
In vivo imaging
To elucidate the in vivo distribution of Micro DEA2k in normal and model mice, 1 mL of Cy7-labeled Micro DEA2k (0.4 mg/mL) was injected intraperitoneally into model mice prior to abdominal closure. Normal mice were injected intraperitoneally with 1 mL of Cy7-labeled Micro DEA2k (0.4 mg/mL) as the control group (n = 3). After injection, they were monitored with an in vivo imaging system (IVIS Spectrum, PerkinElmer, Inc.), and in vivo imaging was performed at 0, 6, 24, and 48 h. Three additional mice were taken from each group and were sacrificed and dissected at two time points (6 and 24 h). The brain, heart, lungs, liver, kidneys, testes, spleen, and small intestines were excised for ex vivo imaging. To examine the in vivo distribution of Micro DEA2k and DEA2k in the model mice, three additional model mice were injected intraperitoneally with 1 mL of Cy7-labeled DEA2k (0.2 mg/mL). The mice were euthanized and dissected at two time points (6 and 24 h), and the organs were removed for ex vivo imaging.
Statistical analyses
Statistical analysis was performed using GraphPad Prism 9.4.1, and the results were expressed as mean ± SEM. Between-group differences were assessed using the Student’s t-test (for simple two-sample or paired sample comparisons) or one-way analysis of variance and Tukey’s post hoc test (for multiple comparisons). The Kaplan-Meier method was used to compare the differences in survival rates. The Spearman correlation coefficient (R2) was used to evaluate correlations in the clinical data.


Comments (0)