
Remember me


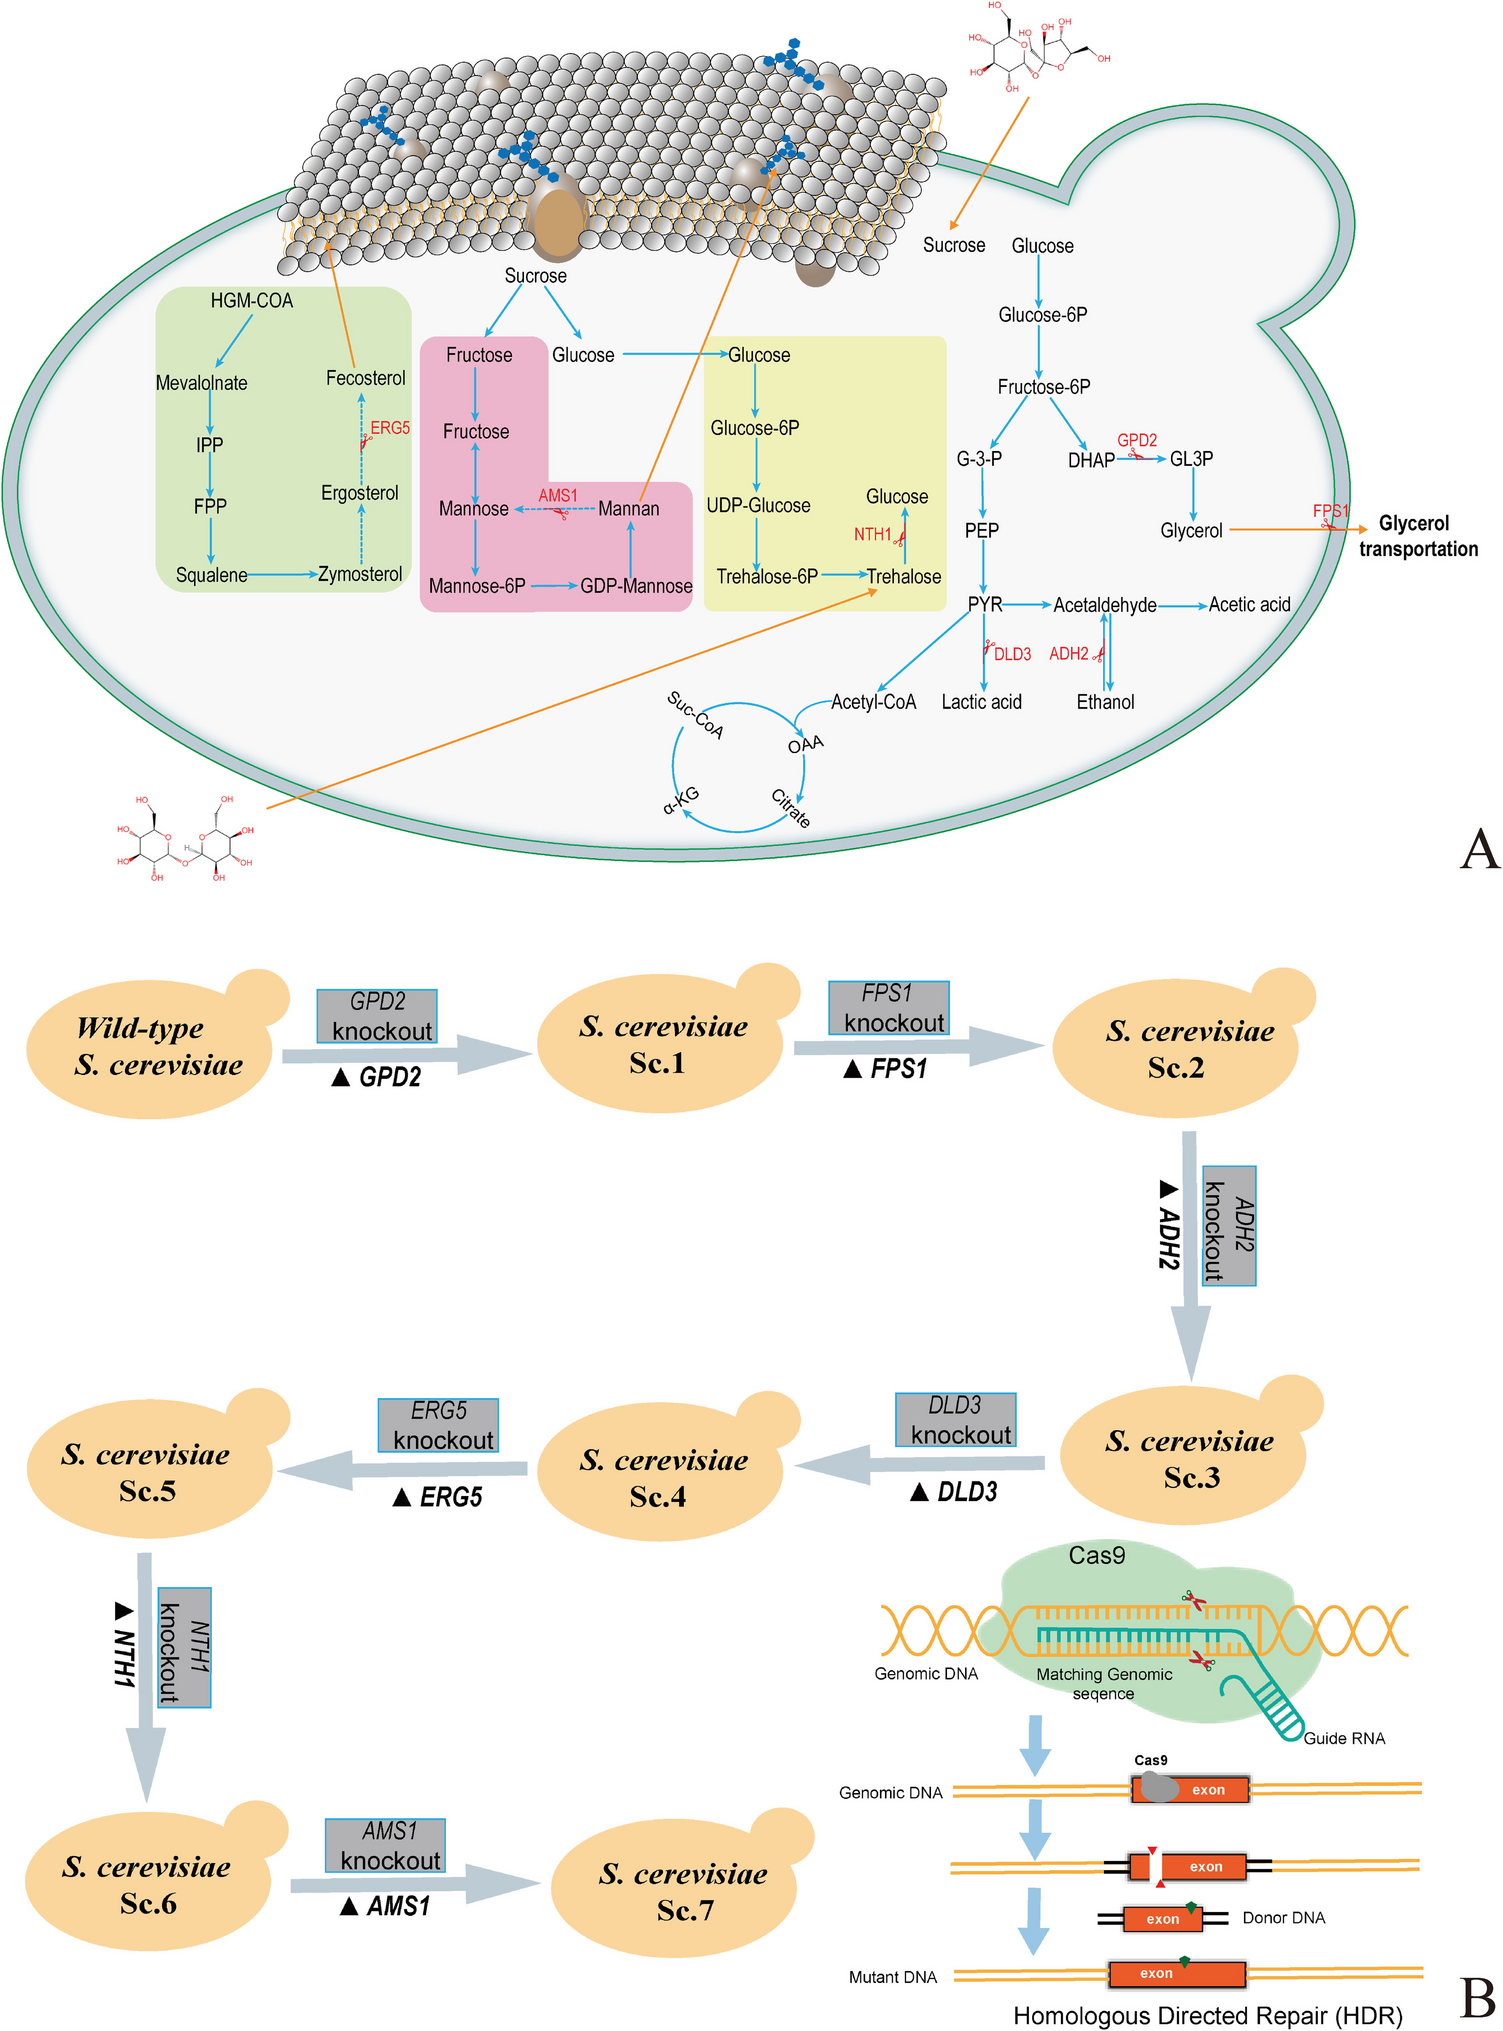
Engineered S. cerevisiae GFADENA was constructed by successively knocking out GPD2, FPS1, ADH2, DLD3, ERG5, NTH1, and AMS1 genes using the CRISPR-Cas9 approach. The screening of the putative transformants was performed on the YPD solid screening media after the transformation of gRNA expression and Cas9 vectors (Fig. 2A). A total of 15 colonies grew on the solid screening media with no colony on the plates from the three control groups. The putative transformants were further confirmed by amplifying and sequencing insertion DNA. The true transformants were used for further research.
Fig. 2
Screening of the putative transformants and growth of S. cerevisiae GFADENA using 400 g/L of sucrose. Note: A The screening of putative transformants on the YPD solid media containing dual antibiotics. A, B The plate after the transformation without gRNA expression vector and insertion DNA, respectively. C The culture of yeast strain containing Cas expression vector by the direct coating plate without transformation. D The normal transformation for targeted gene deletion; B the cell growth of S. cerevisiae GFADENA on the solid YP sucrose media. Note: A, B, C, and D indicate the cell growth on the media containing sucrose concentrations of 100, 200, 300, and 400 g/L with the wild-type strain as the control, respectively; C the equation between cell concentrations (g/L) and OD values at the wavelength of 600 nm (OD600nm); D the dry cell weights of S. cerevisiae GFADENA (g/L) during the fermentation using 400 g/L of sucrose with the wild-type strain as the control
Tolerance test of S. cerevisiae GFADENA on the solid sucrose mediumS. cerevisiae GFADENA grew on the solid YP media containing sucrose with the wild-type strain as the control. S. cerevisiae GFADENA had a similar growth with the wild-type strain under the low sucrose concentrations of 100 g/L (Fig. 2B–(A)). S. cerevisiae GFADENA possessed a better growth rate than the wild-type strain on the solid media containing high-concentration sucrose of 200–400 g/L (Fig. 2B–(B, C, and D)). Thus, S. cerevisiae GFADENA after GPD2, FPS1, ADH2, DLD3, ERG5, NTH1, and AMS1 deletion obtained higher sucrose resistance under the high-concentration condition than the wild-type strain.
Effect of fermentation time on dry cell weight of S. cerevisiae GFADENAThe dry cell weights (DCW) of S. cerevisiae GFADENA were calculated according to the equation between DCW and OD values of S. cerevisiae GFADENA. The conversion formula was y = 2.3045x + 0.1421(R2 = 0.9973), in which y and x represented OD600nm values and cell weight concentrations (g/L), respectively (Fig. 2C). S. cerevisiae GFADENA had a faster growth rate during the initial 30-h fermentation than the wild-type strain under the liquid fermentation of 400 g/L sucrose. DCW of engineered S. cerevisiae GFADENA after fermentation of 18 h (1.56 g/L) was 17 folds than the control (0.09 g/L). The cell yields of S. cerevisiae GFADENA after fermentation of 48 h (3.51 g/L) were 1.08 folds compared with that of the wild-type strain (3.26 g/L) (Fig. 2D). Thus, engineered S. cerevisiae GFADENA possessed a faster cell proliferation rate than the control under the condition of high-concentration sucrose.
Effect of fermentation time on sucrose consumption and ethanol productionSucrose concentrations and ethanol production were determined using 400 g/L of sucrose as fermentation substrate during the fermentation of 96 h (Fig. 3A). The ethanol concentration of S. cerevisiae GFADENA (135 g/L) was 1.17 folds than that of the wild-type strain (115 g/L). The residual sucrose content of S. cerevisiae GFADENA was higher than the wild-type strain. In addition, the concentration of glycerol in S. cerevisiae GFADENA was 9.21 g/L, which was 0.63 folds compared to the control yeast (14.53 g/L) after fermentation of 72 h under 400 g/L sucrose (Fig. 3B). The engineering yeast produced a certain amount of glycerol. Nevertheless, the glycerol content of engineering yeast had remarkably decreased compared to the control strain. Thus, S. cerevisiae GFADENA had stronger sucrose consumption capability and higher ethanol production efficiency than the wild-type strain.
Fig. 3
Ethanol concentrations of S. cerevisiae GFADENA using sucrose and corn syrup. Note: A Sucrose and ethanol concentrations of S. cerevisiae GFADENA during the fermentation using sucrose as a carbon source. B Glycerol concentrations of S. cerevisiae GFADENA and the control after fermentation of 72 h under 400 g/L sucrose. C Ethanol yields and corn syrup concentrations during the fermentation of S. cerevisiae GFADENA by the simultaneous saccharification and fermentation approach
Ethanol production of S. cerevisiae GFADENA using high-gravity corn syrupS. cerevisiae GFADENA was applied to produce ethanol using 400 g/L of corn syrup. S. cerevisiae GFADENA could effectively produce ethanol with the highest ethanol concentration of 145 g/L after fermentation for 66 h during the fermentation of 96 h (Fig. 3C). The conversion efficiency of sugar to ethanol was 2.2 g/L/h based on the calculation of ethanol conversion rate and fermentation time. The conversion rate from glucose to ethanol in S. cerevisiae GFADENA reached 41.1%. The rate accounted for 81% of the theoretical conversion rate (51.1%). After fermentation for 96 h, the concentration of corn syrup was 10 g/L. The utilization rate of corn syrup reached 97%. Thus, S. cerevisiae GFADENA possessed excellent high-sugar tolerance and ethanol conversion ability.
Principal component analysis (PCA) based on targeted metabolomics of energy metabolismThe determination data of index, compounds, and class based on energy sigMetabolites are listed in Table S1. PCA modeling method was used to analyze the two sets of measured data to distinguish the significant differences between S. cerevisiae GFADENA and the wild-type strain. The PC1 and PC2 contribution rates under the cumulative condition of 99.32% were 96.52% and 2.8%, respectively (Fig. 4A). No significant difference existed between the two metabolome groups by two-dimensional principal component score plots (p < 0.05) (Fig. 4B). A significant difference existed between the two groups based on the scores of the predicted principal components (p < 0.05) (Fig. 4C). An aggregation interval existed significant differences between S. cerevisiae GFADENA and the wild-type strain. The formulas of validated OPLS-DA models were R2X = 0.947, R2Y = 0.996, and Q2 = 0.978 (p < 0.005) by the data analysis from 200 random permutations (Fig. 4D).
Fig. 4
Principal component analysis (PCA) of S. cerevisiae GFADENA. Note: A Variability of the data between PC1 and PC2; B difference between the metabolomes by the two-dimensional principal component score plots; C significant difference of S. cerevisiae GFADENA between the metabolomes of the two groups according to the scores of the predicted principal components; D validated OPLS-DA models by the data analysis of 200 random permutations
Differential metabolites between S. cerevisiae GFADENA and the wild-type strainThe classification of metabolites was figured out between S. cerevisiae GFADENA and the wild-type strain (Fig. 5A). The differential metabolite L-cystine, 6-phosphogluconic acid, α-ketogluconic acid, pyruvic acid, and glutamine in S. cerevisiae GFADENA exhibited an upward trend compared with the control group according to the expression contents. The contents of other metabolites in S. cerevisiae GFADENA exhibited a downward trend. In total, 39 differential metabolites in S. cerevisiae GFADENA were distinguished among all the metabolites according to the OPLS-DA model with VIP value > 1 and fold change ≥ 1.2. The volcano plot analysis represented that 38 significantly downregulated metabolites in S. cerevisiae GFADENA were distinguished (Fig. 5B). In all metabolites, α-ketogluconic acid (α-KG) was one of the significantly upregulated metabolites according to the OPLS-DA analysis. α-KG served as an energy donor, a precursor of amino acid biosynthesis, and an epigenetic regulator. α-KG also played physiological functions in immune regulation, oxidative stress, and anti-aging. The upregulation of α-KG in S. cerevisiae GFADENA provided an important basis for improving the tolerance of engineering strain. In addition, the downregulated metabolites were amino acids, such as L-aspartic acid, tyrosine, threonine, and L-glutamic acid, as well as sugars including D ( +)—glucose, D-fructose-6-phosphate, D-glucose-1-phosphate, D-ribose-5-phosphate, and D-glucose-6-phosphate. The significantly differential metabolites from S. cerevisiae GFADENA after gene deletion were distinguished by the targeted metabolomics of energy metabolism.
Fig. 5
Differential metabolites between S. cerevisiae GFADENA and the wild-type strain. Note: A Classification analysis of metabolites; B statistics analysis of significantly regulated metabolites based on the OPLS-DA model
Upregulated and downregulated metabolites of S. cerevisiae GFADENAThe dynamic distribution profiles of the top 5 upregulated and top 10 downregulated metabolites of S. cerevisiae GFADENA were drawn based on energy metabolism (Fig. 6A). The upregulated metabolites of S. cerevisiae Sc.7 were L-cystine, 6-phosphogluconic acid, α-ketogluconic acid, pyruvic acid, and glutamine, while the top 10 downregulated metabolites were D-fructose, glyceraldehyde-3 phase, NAD, D-glucose-1-phase, IMP, AMP, argininosuccinic acid, phosphoenolpyruvic acid, 3-phosphoglycerate, and fructose-1,6-bisphosphate. The maximum log2FC value was from α-ketogluconic acid (0.49), which was only one upregulated metabolite classified as data greater than 0. In addition, the minimum log2FC value was from fructose-1,6-bisphosphate (− 2.93) with the most significant difference among all the downregulated metabolites (Fig. 6B).
Fig. 6
Distribution and KEGG annotation of top-upregulated and downregulated metabolites in S. cerevisiae GFADENA based on energy metabolism. Note: A Dynamic distribution map of top metabolites; B log2FC values of top-upregulated and downregulated metabolites. C The cell functions were classified based on the metabolomics of energy metabolism; D the distribution of 20 classified metabolisms based on the differential abundance scores
KEGG annotation of S. cerevisiae GFADENA based on energy metabolismMetabolism, environmental information processing, and genetic information processing were classified according to KEGG annotation of metabolomics of energy metabolism based on cell functions (Fig. 6C). The classification numbers of metabolism were much more than others based on functionality. Metabolic pathway function was the highest percentage among all the differentially significant metabolites. The biosynthesis percentages of secondary metabolites pathway, microbial metabolism in diverse environments, and amino acids functions accounted for 81.82%, 48.48%, and 45.45%, respectively. The percentages of ABC transporters, phosphotransferase system, and two-component system based on environmental information processing classification accounted for 23.4%, 12.12%, and 15.15%, respectively. The percentage of aminoacyl-tRNA biosynthesis accounted for 18.18% of genetic information processing classification.
The distribution profiles of p-values and counts of 20 classified metabolisms were provided according to the differential abundance (DA) scores of metabolisms (Fig. 6D). The biosynthesis of secondary metabolites had the highest count value based on a DA score of − 0.5 among all the metabolisms. Other metabolisms with a DA score of − 1.0 were from cyanoamino acid metabolism, galactose metabolism, starch and sucrose metabolism, and fructose and mannose metabolism. Thus, the deletion of seven genes resulted in the regulation of metabolites in S. cerevisiae GFADENA involving metabolism, environmental information processing, and genetic information processing based on energy metabolism.
Targeted metabolomics of amino acid metabolism of S. cerevisiae GFADENAThe determination data of index, compounds, and class based on the amino acid sigMetabolites of targeted metabolomics are listed in Table S2. The distribution profiles of ten top-upregulated and four top-downregulated metabolites were represented according to log2FC values of metabolites based on amino acid metabolism in S. cerevisiae GFADENA (Fig. 7A). Top-upregulated metabolites were from γ-glutamate-cysteine, L-cysteine, D-homocysteine, and L-theanine. The top-downregulated metabolites were from L-aspartate, 4-acetamido butyric acid L-tyrosine, 5-hydroxy-tryptamine, N-acetylaspartate, L-methionine, L-tryptophyl-L-glutamic acid, 5-hydroxy-tryptophan, urea, and S-sulfo-L-cysteine. The highest log2FC value from upregulated metabolite γ-glutamate-cysteine was 0.58 with the biggest value among the 20 top metabolites (Fig. 7B). In addition, top-downregulated metabolites (log2FC values) were from S-sulfo-L-cysteine (− 0.58), urea (− 0.55), and 5-hydroxy-tryptophan (− 0.51). Thus, the deletion of seven genes in S. cerevisiae GFADENA resulted in upregulated and downregulated metabolites according to the targeted metabolomics based on amino acid metabolism.
Fig. 7
Distribution of top-upregulated and downregulated metabolites in S. cerevisiae GFADENA based on the amino acid and free fatty acid metabolisms. Note: A The dynamic distribution map of top metabolites based on the amino acid metabolism; B log2FC values of top metabolites based on the amino acid metabolism; C the dynamic distribution map of top metabolites based on the free fatty acid metabolism; D the log2FC values of top metabolites based on the free fatty acid metabolism
Targeted metabolomics of free fatty acid metabolismThe determination data of index, compounds, and class from free fatty acid sigMetabolites based on the targeted metabolomics are listed in Table S3. The distribution profiles of ten top-upregulated and four top-downregulated metabolites were drawn based on free fatty acid metabolism (Fig. 7C). The ten top-upregulated metabolites were from trans-9-palmitelaidic acid, cis-9-octadecenoic acid, trans-9-octadecenoic acid, cis-s-palmitoleic acid, myristic acid, lauric acid, linoleic acid, arachidic acid, stearic acid, and palmitic acid. In addition, the downregulated metabolites were from cis-10-carbonic acid, behenic acid, lignoceric acid, and erucic acid. The log2FC values of top metabolites were represented in terms of differential fold changes (Fig. 7D). The upregulated metabolites with the largest fold changes were from cis-9-octadecenoic acid (0.46), trans-9-octadecenoic acid (0.45), linoleic acid (0.37), lignoceric acid (0.18), heptadecanoic acid (0.13), and decanoic acid (0.09). In addition, one downregulated differential metabolite was from lignoceric acid (− 0.02). Therefore, the gene deletion in S. cerevisiae GFADENA resulted in upregulated and downregulated metabolites of free fatty acids based on the targeted metabolomics.
Comments (0)