
Remember me


This Health Insurance Portability and Accountability Act (HIPAA) compliant retrospective study was approved by the institutional review board with a waiver of the requirement for written informed consent and followed Standards for Reporting of Diagnostic Accuracy Studies (STARD) reporting guidelines.
The radiology information system was searched for the records of patients older than 18 years who underwent multiphasic pancreatic CT angiography with a clinical indication of non-resectable LAPC between January 1, 2005 and December 31, 2018. Treatment protocols for all identified patients meeting this criterion were determined and those who received CyberKnife (Accuracy Inc., Sunnyvale, CA) SBRT and chemotherapy (SBRT/chemotherapy) were deemed the treatment group while those that received stand-alone chemotherapy were deemed the control group. Patients that did not undergo neoadjuvant treatment at our institution and/or those without follow up CT examinations for imaging assessment were excluded.
CT examinationsPatients underwent contrast-enhanced abdominal CT with a 64- or 128 multidetector computer tomography system (LightSpeed VCT, GE Healthcare; Aquilion, Toshiba America Medical Systems). The tube voltage was approximately 120 peak kilovoltage (kVp), and the tube current was determined by the automatic exposure control. Intravenous contrast medium was administered at a flow rate of 3–5 mL/s. Examinations were performed with multiphase pancreatic protocol (pancreatic phase 30–40 s and portal venous phase 70 s after injection). Images were reconstructed at a slice thickness of 2.5 mm or less in the axial, coronal, and sagittal planes.
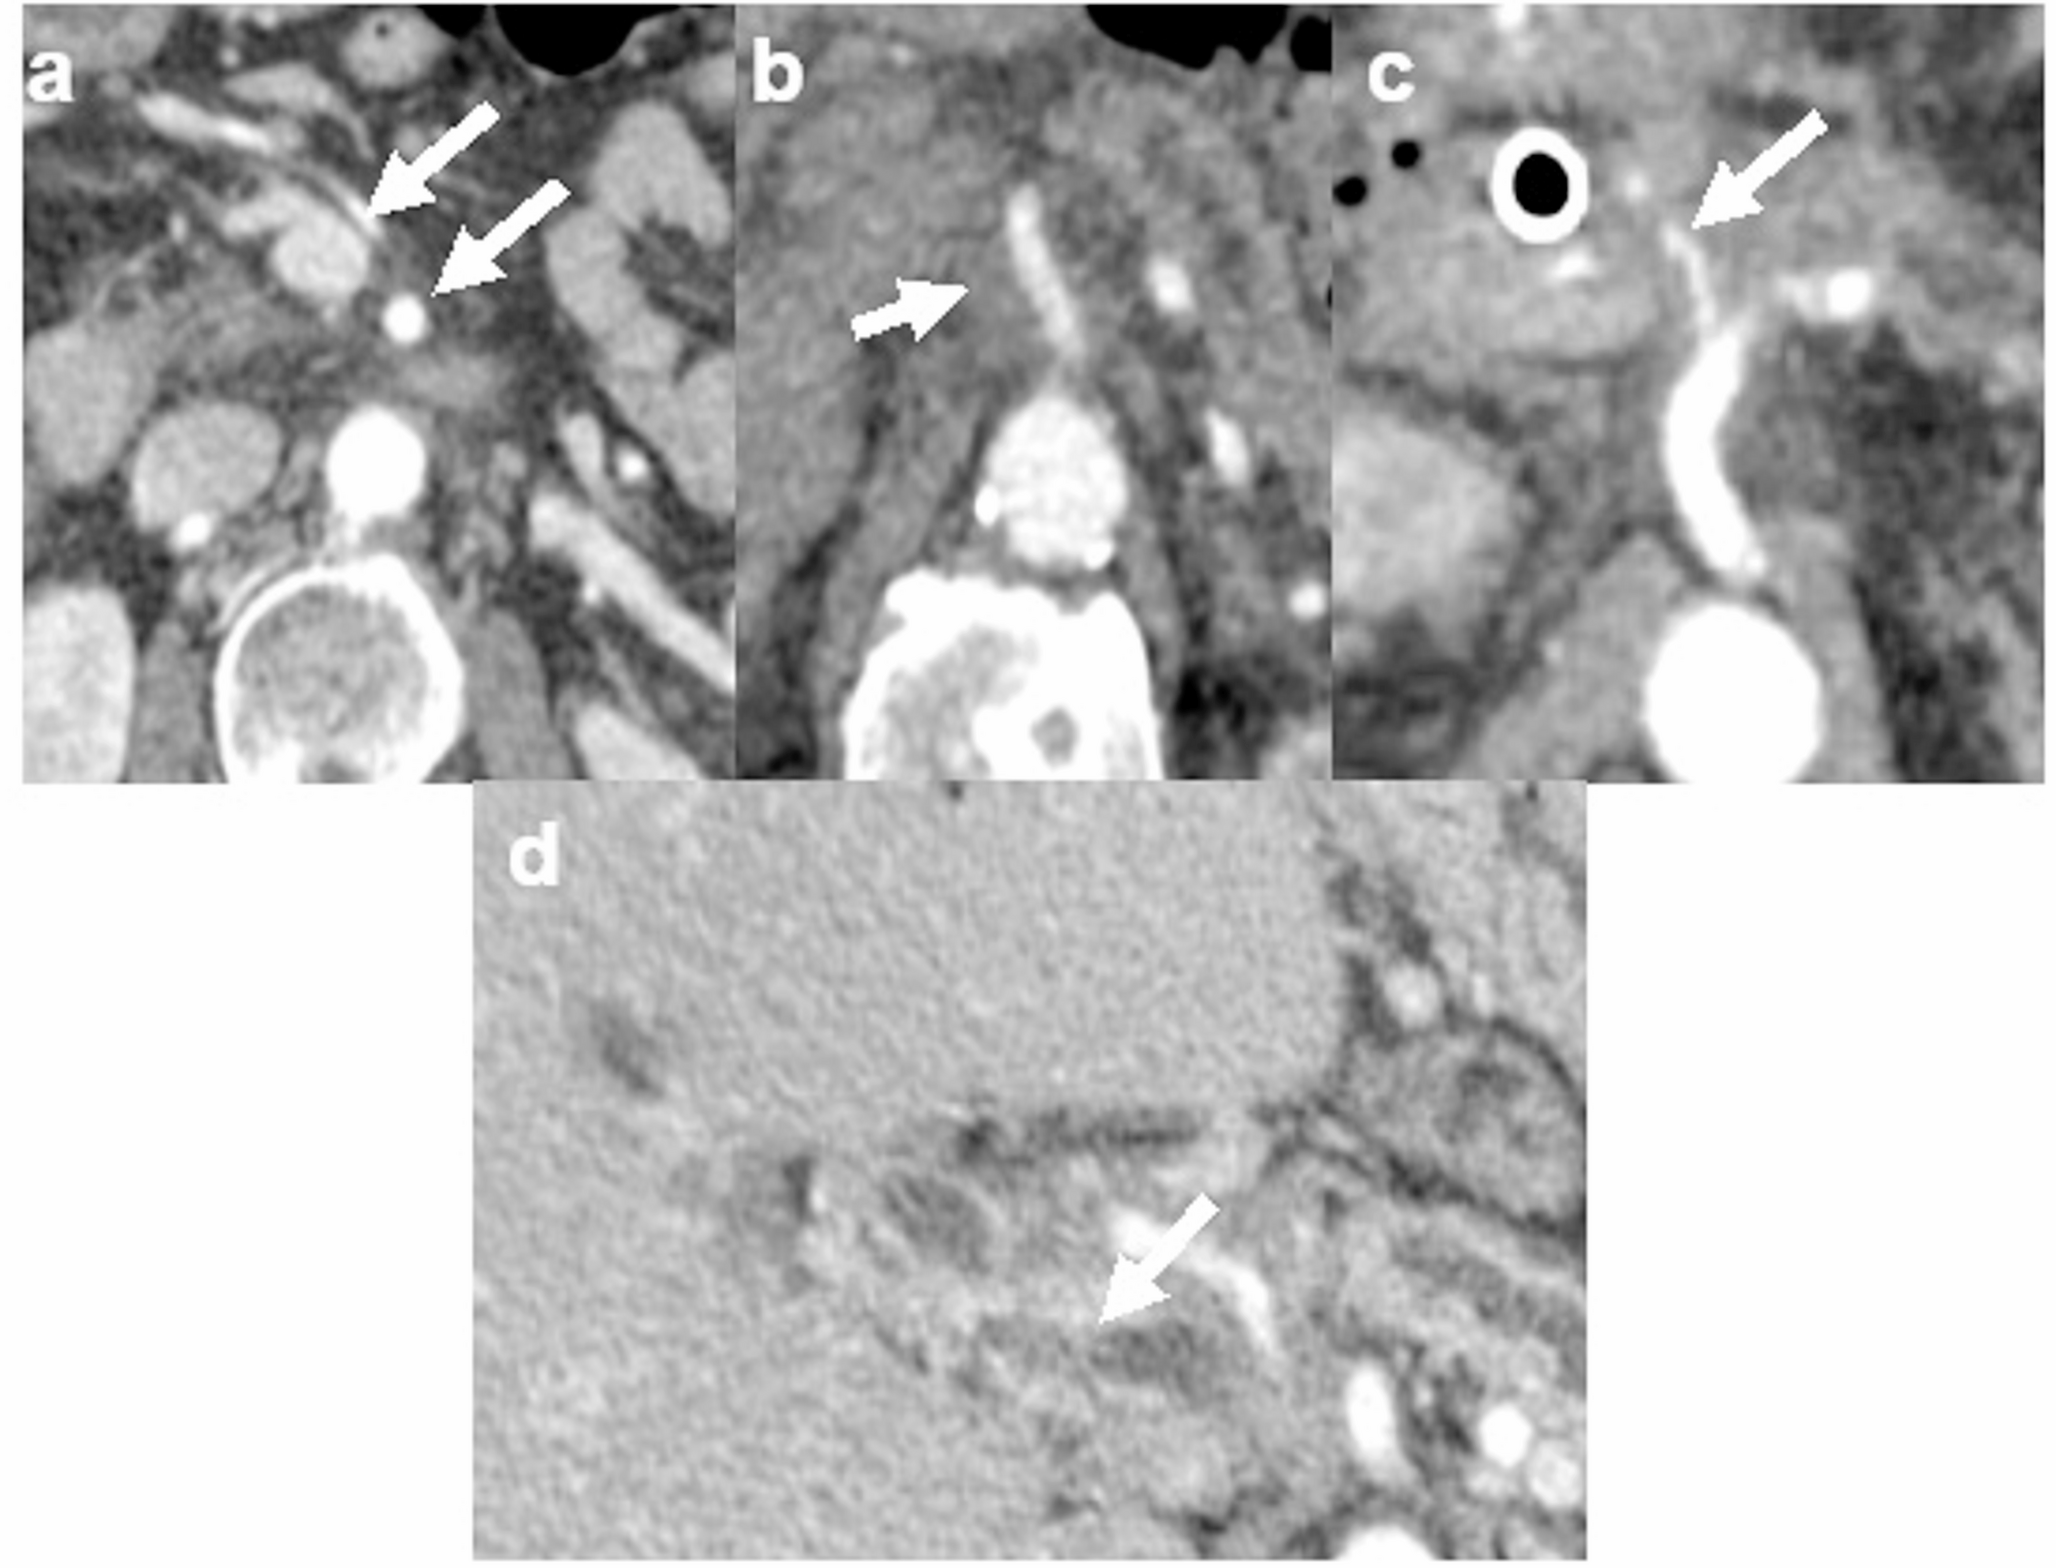
CT interpretationThe CT examinations were evaluated in consensus by two investigators blinded to clinical and treatment data (VG, a fellowship-trained abdominal radiologist with 2 years of post-training experience including 1 year of pancreaticobiliary multidisciplinary conference participation and AB, a fellowship-trained abdominal radiologist with 8 years of post-training experience including 6 years of pancreaticobiliary multidisciplinary conference participation). For each patient, CT examinations pre-treatment and at four subsequent standardized time intervals were reviewed (1 month, 3–6 months, 7–12 months, greater than 12 months). At each time point, degree of vascular involvement and the presence of peripancreatic fat stranding were recorded. Degree of vascular involvement was recorded for eight vessels: portal vein, superior mesenteric vein, splenic vein, left renal vein, celiac artery, common hepatic artery (including replaced vessels), superior mesenteric artery and splenic artery. A total of 512 individual vessels (8 vessels in each of the 64 patients) were assessed in the combination SBRT/chemotherapy group and 256 individual vessels (8 vessels in each of the 32 patients) were assessed in the stand-alone chemotherapy group. Vascular involvement was graded on a four-point scale as follows: 0—no involvement/less than 180-degree abutment, 1—encasement without stenosis or occlusion, 2—encasement with stenosis, 3—vessel occlusion (Fig. 1).
Fig. 1
Axial contrast enhanced CT images depict grading of vascular involvement. a No vascular involvement of superior mesenteric vessels, grade 0 (arrows). b Encasement of the superior mesenteric artery without stenosis, grade 1 (arrow). c Encasement with stenosis of the common hepatic artery, grade 2 (arrow). d Encasement and occlusion of the main portal vein, grade 3 (arrow)
Neoadjuvant therapyChemotherapy regimens for patients in this study generally reflected the evolving standard of care over the study period. Prior to 2010, gemcitabine-based regimens, often administered in combination with other agents, were the predominant approach. Following 2010, folinic acid, fluorouracil, irinotecan and oxaliplatin (FOLFIRINOX) became the preferred regimen in patients with preserved performance status, whereas gemcitabine plus nab-paclitaxel was more frequently utilized in patients with limited functional reserve. The choice of chemotherapeutic agents were made independent of potential future SBRT use or not.
For patients who received SBRT, clinical target volume (CTV) included the gross tumor volume (GTV) and involved the vasculature. The planning target volume (PTV) was a uniform 3 mm expansion of the PTV. The PTV was cropped out of critical structures by the treating radiation oncologist as needed to meet dose constraints. In the majority of cases, the PTV received 27 Grays in 3 fractions (institutional standard). The interdigitation of SBRT varied slightly from patient to patient, predominantly occurring during the 1st month following induction chemotherapy.
Disease progressionPatients were assessed for disease progression at each follow up CT examination. Disease progression was determined by a combination of clinical assessment (including patient performance status and clinical symptoms) and trends in Cancer Antigen 19-9 (CA 19-9) serology as assessed at multidisciplinary tumor board and documented in the electronic medical record. For both treatment and control groups, tumor marker trends over time were interrogated at each time point, and those in whom an increase was noted from baseline were defined as having biochemical progression at the time point where CA 19-9 elevation was first documented. Per institutional standard, a CA 19 -9 increase of 20% from baseline was considered biochemical progression. The only exception to this criterion was among SBRT patients during the first treatment interval (pre-treatment to one-month post-treatment), when a transient increase in CA 19-9 was tolerated and presumed secondary to radiation effects from SBRT. Such patients were only allowed to remain within the dataset if their tumor marker values returned to baseline or below at the second standardized time interval (3–6 months); failure to do so led to exclusion.
Among those patients in whom progression was identified, partial exclusion was performed wherein data at and beyond the time point when progression was initially suspected was excluded, leaving only pre-progression data. For explanatory purpose, a patient in whom progression was suspected by CA 19-9 elevation from baseline at nine months post-treatment would have all data from the nine-month post-treatment time point and beyond excluded from evaluation, with the pre-treatment, one-month post-treatment, and three-to-six month post-treatment data remaining within the dataset.
Statistical analysisData was summarized with descriptive statistics. Unpaired t-test was used to compare ages. Chi-squared test was used to compare distributions of gender. A mixed-effects logistic regression model with random effects for patient and fixed effects for vessels were used to analyze vascular involvement over time. Chi-squared and McNemar test were used to compare prevalence of fat stranding in different subgroups. Mann–Whitney test was used to compare length of follow-up. P < 0.05 was considered statistically significant. Computations were performed with Matlab software (version 9.9, MathWorks).
Comments (0)