
Remember me


This retrospective study was approved by the Institutional Review Board of our institution, which waived the requirement for obtaining written informed consent because of the retrospective nature of this study.
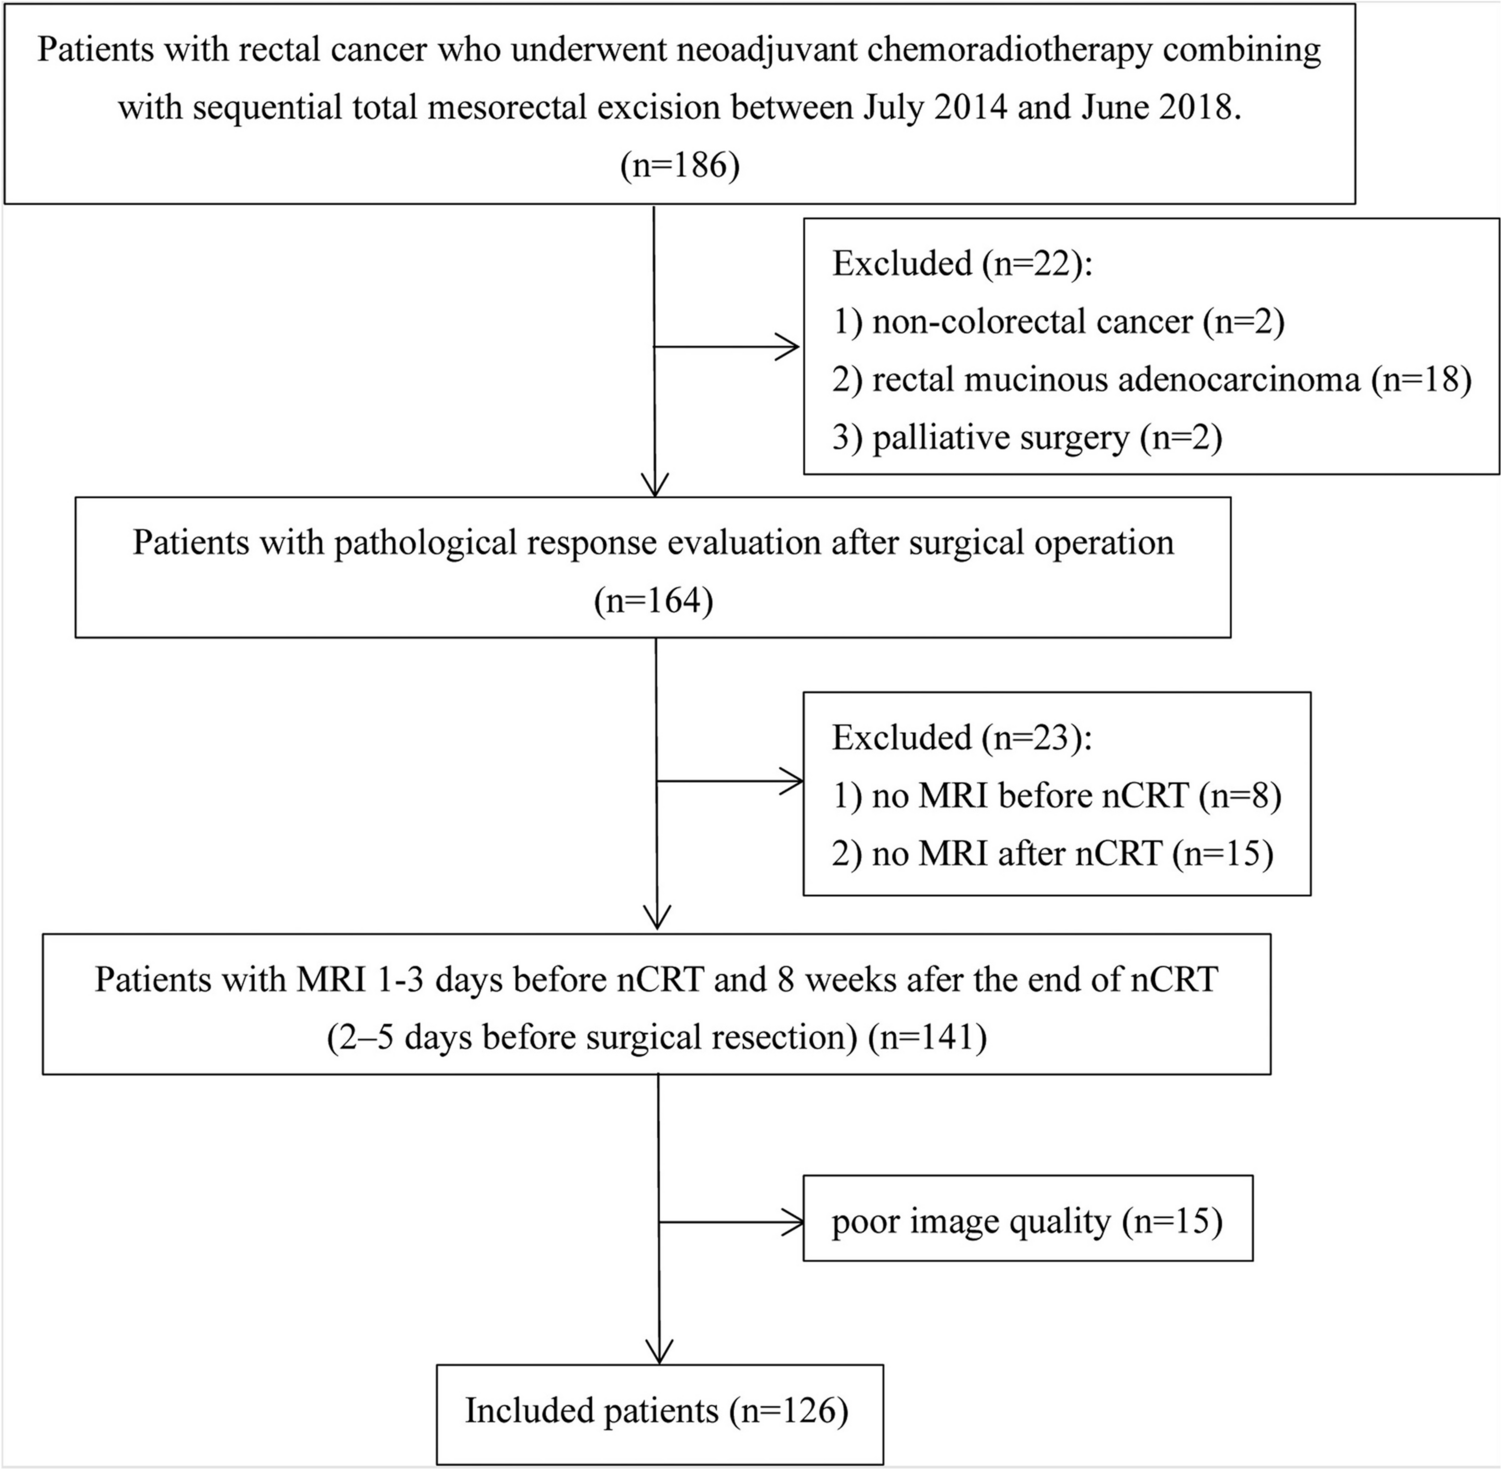
PatientsThe medical image management and processing systems of our hospital were searched to identify appropriate cases, and radiology reports from MRI examinations of the upper abdomen were gathered; these reports were then assigned to the training, validation, and testing datasets (Fig. 1). The training dataset comprised 5,000 cases of upper abdominal MRI reports with pancreatic cysts obtained between May 2019 and June 2021; the validation dataset comprised 250 cases of upper abdominal MRI reports with pancreatic cysts obtained in June 2022; and the test dataset comprised 500 cases of upper abdominal MRI reports with pancreatic cysts obtained between March 2024 and June 2024. We selected cases that were morphologically consistent with BD-IPMN. MRI reports that did not include pancreatic cysts, patients with nonspecific cysts not determined as BD-IPMNs, main duct IPMNs without pancreatic cysts, and mixed-type IPMNs were excluded from all datasets. Main-duct and mixed-type IPMNs were excluded because the Revised International Consensus Fukuoka Guidelines (2017) [5], which we used as the basis for classification, provide recommendations for follow-up intervals and intervention only for BD-IPMNs. MRI examination included the following sequences; 2D-magnetic resonance cholangiopancreatography, 3D-mangetic resonance cholangiopancreatography, true fast imaging with steady precession images, single shot fast spin echo T2-weighted images, diffusion weighted images, 3D fat-suppressed T1-weighted images. From the test dataset, patients included in the training dataset were excluded. Reports were obtained in CSV format. In our institution, there is no dedicated report template for IPMNs. All reports were written in Japanese, and words such as HRS and WF were removed from the reports.
Fig. 1
Patient inclusion and exclusion process
Reference standardEach report was classified into five groups according to the Revised International Consensus Fukuoka Guidelines (2017) [5] by a radiology resident with 1 year of diagnostic imaging experience. The groups were as follows:
*Group 0: BD-IPMNs difficult to classify based on the Revised International Consensus Fukuoka Guidelines (e.g., no description of the maximum cyst diameter).
*Group 1: BD-IPMNs with cyst diameters of < 10 mm.
*Group 2: BD-IPMNs with cyst diameters between 10 and 19 mm.
*Group 3: BD-IPMNs with cyst diameters between 20 and 29 mm.
*Group 4: BD-IPMNs with WF (cysts ≥ 3 cm, enhancing mural nodules ≤ 5 mm, thickened or enhancing cyst walls, main pancreatic duct diameter of 5–9 mm, abrupt change in the caliber of the pancreatic duct with distal pancreatic atrophy, lymphadenopathy, elevated serum CA19-9 levels, and a cyst growth rate of ≥ 5 mm over 2 years) or HRS (obstructive jaundice in a patient with a cystic lesion in the head of the pancreas, an enhancing mural nodule ≥ 5 mm, and a main pancreatic duct diameter ≥ 10 mm).
This classification was validated by a radiologist with 14 years of imaging experience.
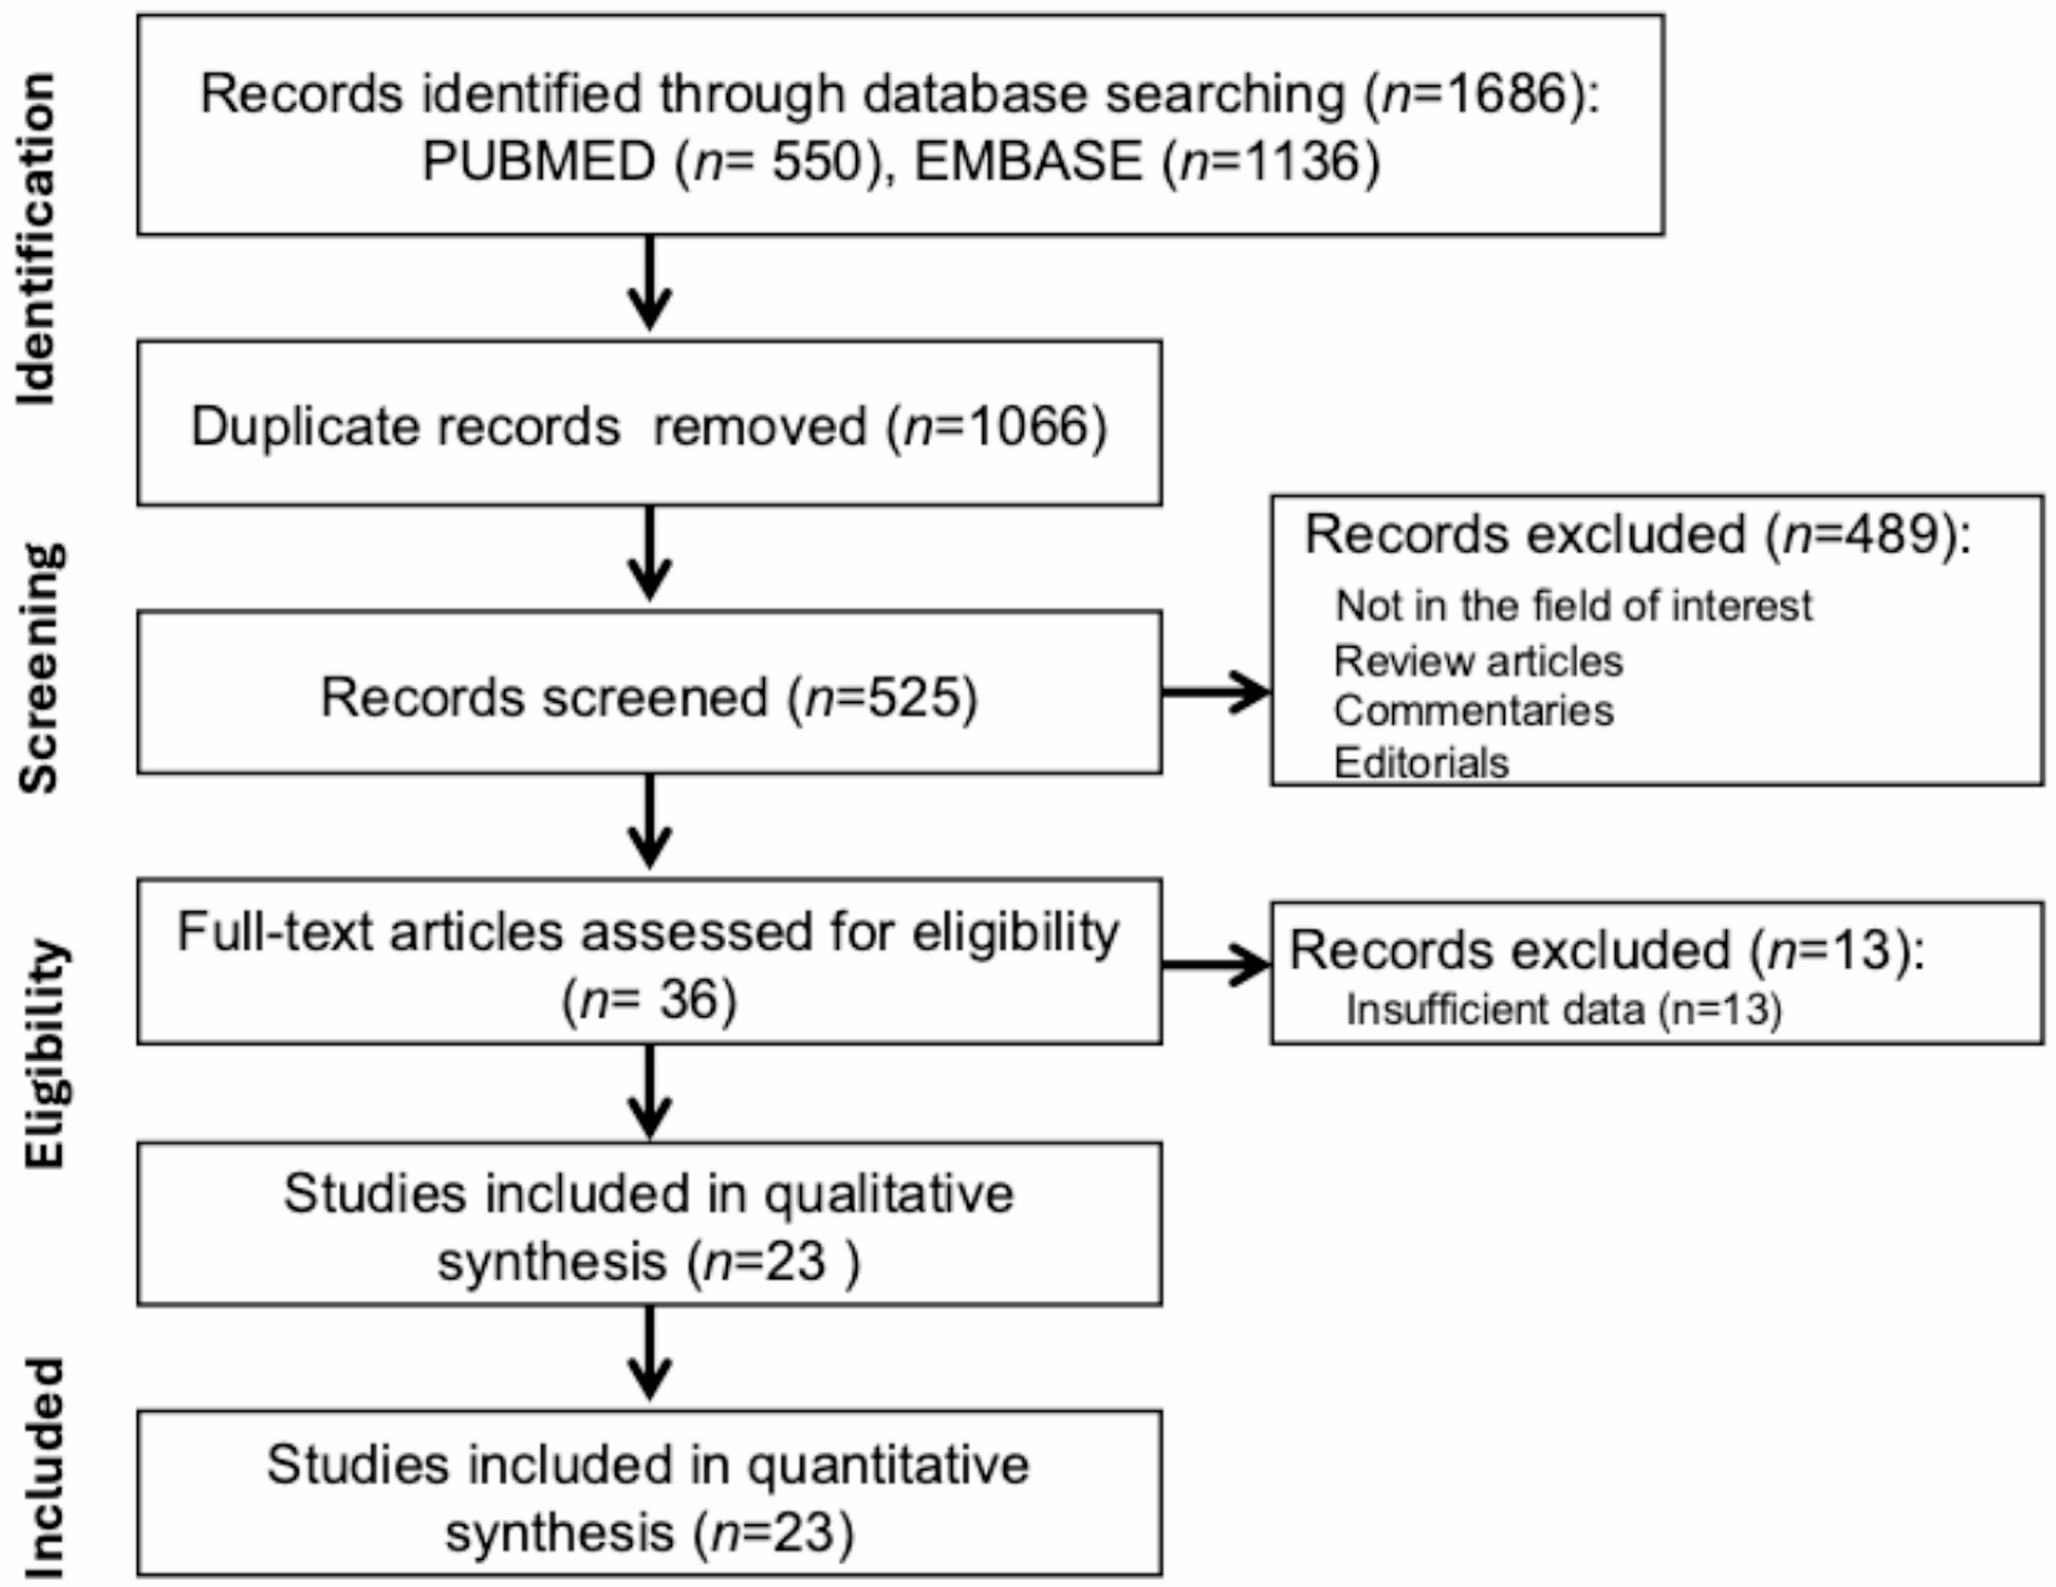
Fine-tuning of the modelWe fine-tuned the pretrained Bidirectional Encoder Representations from the Transformers Japanese model (https://huggingface.co/cl-tohoku/bert-base-japanese) on a workstation equipped with a central processing unit of Core™ i9-12900F (Intel), a graphic processing unit of GeForce RTX 3090 (NVIDIA), and 128-GB RAM using the programming language of Python (version 3.10.13) (https://www.python.org/) and Transformers library (version 4.35.2) (https://huggingface.co/). The model comprised 12 layers, 768 dimensions of hidden states, and 12 attention heads. This model was pretrained using the Japanese Wikipedia as of September 1, 2019. Using the AutoModelForSequenceClassification class method, the model was fine-tuned to classify reports into five groups based on the logits for each group. Based on our previous experience, the number of epochs was set to 10, and the other hyperparameters were set to their default values. Because of the randomness of the training process, such as initialization of parameters and the shuffling of the training data, 15 sessions were performed on the training and validation datasets, and the model with the best performance was adopted. These processes are shown in Fig. 2.
Fig. 2 Test phase of the fine-tuned model and readers
The best-performing model on the validation dataset was evaluated on the test dataset. Two radiology residents (Readers 1 and 2 with 3 and 2 years of diagnostic imaging experience, respectively) and an intern (Reader 3 with 2 years of medical experience) manually sorted the reports in the test dataset into five groups, and their performance was compared with that of the model. Readers 1, 2, and 3 were blinded to the patient background information and performed the classification independently. Before this evaluation, a radiologist with 14 years of imaging experience randomized all the test datasets. The results and the time required to complete the classification were recorded.
Statistical analysesStatistical analyses were performed using R (version 4.4.2) (https://www.r-project.org/). McNemar analysis was performed to compare the sensitivity and accuracy of the fine-tuned LLM with those of the readers. Sensitivity for a given class was defined as the proportion of true positive cases correctly identified among all actual cases of that class. Receiver operating characteristic (ROC) curve analysis was performed to evaluate the performance of the fine-tuned LLM in differentiating groups 0–1 from groups 2–4, groups 0–2 from groups 3–4, and groups 0–3 from group 4 by calculating the area under the ROC curve (AUC). Kruskal–Wallis tests followed by post hoc Dunn’s test were performed to compare classification times between the LLM and each of readers 1, 2, and 3. Because multiple comparisons were performed for the AUC, sensitivities, and classification time, Bonferroni correction was applied, and statistical significance was set at a p-value of < 0.017 (= 0.050 / 3).
Comments (0)