
Remember me


We included fifteen healthy young individuals (24 ± 3 years old, 11 females) in this study, similar to sample sizes of previous studies on muscle synergy analyses of posture and gait (Chvatal and Ting 2012; Oliveira et al. 2012; Wang et al. 2021). Exclusion criteria were any neurological, orthopedic or vestibular disorders or use of medication negatively affecting balance, or a body mass index above 25 kg/m2 to ensure sufficient quality of the electromyography (EMG) recordings. All subjects gave written informed consent prior to participation. The study was conducted in accordance with the declaration of Helsinki and adhered to the guidelines of the local medical ethical committee (CMO region Arnhem-Nijmegen).
Experimental protocolParticipants completed three blocked step type conditions in a random order. Each block comprised 60 trials of either reactive, voluntary or action observation with motor simulation of reactive stepping, henceforth referred to as motor-simulated stepping. All steps were performed with the right leg, as prior studies revealed no substantial differences between stepping with the left and right leg (Staring et al. 2024; Wang et al. 2021). Each condition consisted of 12 steps in each of five directions: anterior (Ant), 45° anterior (AntLat), lateral (Lat), 45° posterior (PostLat) and posterior (Post). The stepping directions were then alternated in a random order within each condition. Participants received up to five familiarization trials before each blocked step type condition.
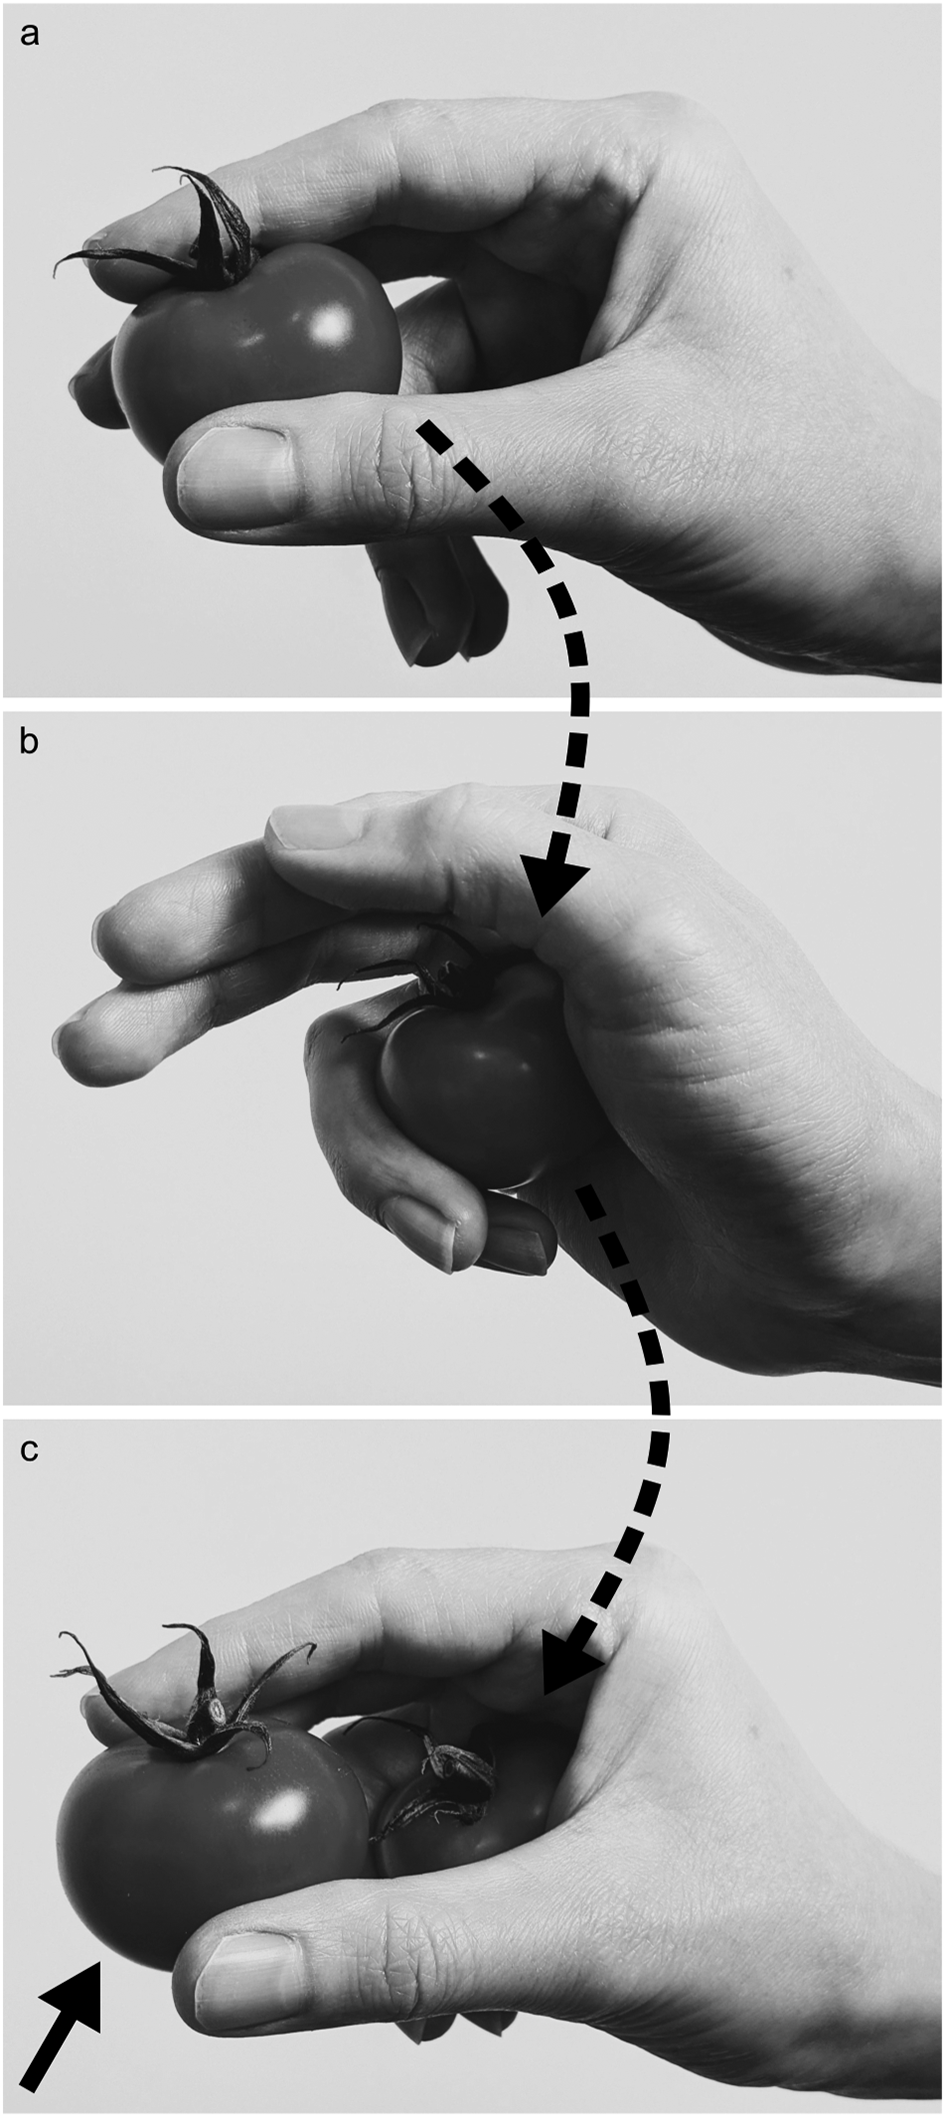
Reactive steps were evoked by sudden balance perturbations (Fig. 1a). Balance perturbations were delivered by the Radboud Fall Simulator, which is a movable platform (Baat Medical, Enschede, The Netherlands) with two embedded force plates (0.6 m by 1.8 m each, AMTI Custom 6 axis composite force platform, USA). A reactive step in the target direction was elicited by a platform translation in the opposite direction (e.g., a backward reactive step was elicited by a forward platform translation). Perturbations comprised an acceleration (300 ms), constant velocity (500 ms) and a deceleration phase (300 ms), with a perturbation intensity of 2 m/s2. Inter-trial intervals randomly varied between 3 and 6 s. The participants were instructed to respond to the balance perturbations with a single step without grabbing the rails surrounding the platform.
Voluntary steps were performed in response to a visual stimulus shown on a large screen in front of the platform, on which the step mat was also displayed (Fig. 1b). The visual stimulus was a stationary white circle that appeared after a random period of 3 to 6 s. Participants were instructed to perform a single step as fast as possible in the direction indicated by the stimulus.
Motor-simulated steps were performed in response to video recordings of reactive steps demonstrated by an actor, which were shown on the screen (Fig. 1c). The video showed platform perturbations with randomly varying inter-trial intervals (3, 3.5, 4 s). Participants were instructed to attentively observe the actor’s reactive step, to imagine experiencing the loss of balance themselves and to step along with the actor as accurately as possible.
Fig. 1
Experimental setup of (a) the reactive stepping condition, (b) the voluntary stepping condition and d) the motor-simulated stepping condition. Participants stood on a step mat that was placed on the Radboud Fall Simulator
To ensure a comparable step size across all three step type conditions, we used a custom-designed vinyl step mat to indicate the target step size of 53 cm (i.e., corresponding to the actor’s step size) and target step directions using colored triangles in each condition. Participants stood on the step mat barefoot with their feet 4.5 cm apart. This narrow stance width forced participants to always perform a reactive step in the event of balance perturbations with a lateral component. Participants were instructed to land their foot approximately on the opposite edge of a triangle while continuing to look at the screen in front. We emphasized that accuracy of foot placement did not have to be prioritized. After having completed a step, participants returned to the starting position which was indicated on the step mat.
Data acquisition and pre-processingGround reaction forces under each foot were collected by the two force plates integrated in the movable platform (sampled at 2000 Hz). The vertical force component from each force plate was filtered offline with a 20 Hz tenth-order zerophase Butterworth filter. The instants of foot off and foot down were detected from the ground reaction forces.
Reflective markers were placed on anatomical landmarks according to the Vicon Full Body Plugin-Gait model (Vicon Motion Systems, United Kingdom), excluding markers on the head and arms. An additional reflective marker was placed on the platform to correct marker positions for platform movements (i.e., in the reactive step condition only). Marker positions were recorded by an 8-camera 3D motion capture system (Vicon Motion Systems, United Kingdom) (100 Hz). Marker trajectory data were filtered offline with a 10 Hz second-order low-pass zero-lag Butterworth filter.
EMG signals were recorded from eight leg and trunk muscles using surface EMG electrodes (Mini Wave, Cometa Systems, Italy). These recordings were synchronized with the ground reaction forces and marker trajectories. The muscles included were the right erector spinae, gluteus medius, biceps femoris, rectus abdominis, rectus femoris, peroneus longus, tibialis anterior and soleus. EMG electrodes were placed according to SENIAM guidelines. Raw EMG signals were successively offline bandpass filtered (20–250 Hz), Hilbert transformed and lowpass filtered (40 Hz) (Staring et al. 2024). EMG signals were subsequently time-normalized from the instants of foot off (0%) to foot down (100%), resulting in a total 101 time samples. By concatenating the filtered EMG trials end to end, a distinct matrix (\(\:\mathbf\)) was created for each participant and condition independently, with each row corresponding to a single muscle.
Muscle synergiesWe used non-negative matrix factorization (NNMF) to extract muscle synergies, a method commonly used for dimensionality reduction of EMG data (Ting and Chvatal 2010; Torres-Oviedo and Ting 2007). NNMF factorizes a set of measured EMG data (\(\:\mathbf\)) into muscle weights (\(\:\mathbf\)) and temporal activation coefficients (\(\:\mathbf\)), such that reconstructed EMG patterns (i.e., \(\:\mathbf\cdot\:\mathbf\)) approximately equal the non-factorized data set \(\:\mathbf\) again. The muscle weights represent the relative contribution of the muscles, i.e., the time-independent spatial coefficients, and the temporal activation coefficients represent the activation of the muscle weights as function of the step cycle.
The lowest number of muscle synergies accounting for at least 80% of the variance (i.e., the variance accounted for (VAF)) was extracted, consistent with our previous study on muscle synergies (Staring et al. 2024). Muscle synergies were extracted for each condition (i.e., step type) and participant separately. Directions were not separated prior to muscle synergy extraction, as including multiple directions is considered critical to ensure sufficient variance for a sound muscle synergy analysis (Ting and Chvatal 2010). Before extracting muscle synergies, \(\:\mathbf\) was normalized to unit variance by dividing each row by its standard deviation to weigh each muscle equally in the factorization, which was undone after factorization to restore the original scaling. We then performed functional sorting to group muscle synergies based on similarities using an iterative process according to the procedures described by Ting et al. (Torres-Oviedo and Ting 2007). Muscle weights were considered similar when Pearson’s correlation coefficient (\(\:r\)) was statistically significant (i.e., \(\:r\ge\:0.622\) for \(\:\alpha\:=0.05\) for a one-tailed test and \(\:df=\:8\:\)muscles\(\:\:-2=6\)). This iterative process was repeated until ≥ 90% of all individual muscle synergies (of all directions and participants for the particular condition) were assigned to a group synergy. If an individual muscle synergy qualified for multiple group synergies (i.e., \(\:r\ge\:0.622\)), it was assigned to the group synergy for which the \(\:r\)-value was highest.
Finally, mean temporal activation coefficients were calculated for each group muscle synergy, condition and direction independently.
Step characteristics and body configurationsWe calculated the following outcome variables. Step length was used as a control variable and was calculated as the displacement of the mid-foot coordinate (i.e., mid-point between the calcaneus and the second metatarsal) in the step direction between perturbation or cue onset and the instant of foot down (Staring et al. 2024). Descriptive variables were step duration (the time interval between the instants of foot off and foot down), step velocity (step length divided by step duration), and leg angle and trunk angle at the instant of foot down (Roelofs et al. 2019). The leg angle was defined as the angle between the vertical and the line connecting the mid-pelvis to the second metatarsal of the stepping foot. Larger leg angles correspond to a mid-pelvis position more distant from the foot position in the transverse plane. The trunk angle was defined as the angle between the vertical and the line connecting the mid-shoulder to the mid-pelvis. Larger positive trunk angles represent a greater trunk inclination towards the step target, whereas negative trunk angles indicate a trunk inclination away from the step target. All outcome measures were calculated with custom-written Matlab software (version R2022a).
Statistical analysisA Friedman’s test was conducted to compare the number of muscles synergies accounting for ≥ 80% of the variance across step types. Fisher’s exact tests were performed to evaluate the presence of group synergies across step types. We employed linear mixed models to examine the within-synergy effects of step type and time on the temporal activation coefficients. The model included fixed effects for step type, time, and the interaction of step type and time. Random intercepts were included for each participant within each step direction, accounting for within-direction variability across participants. Because the activation coefficients are time-dependent, and interaction effects were significant, we conducted post-hoc comparisons per time sample with Bonferroni correction to adjust for multiple testing. Similarly, linear mixed models followed by posthoc pairwise comparisons with Bonferroni correction were used to examine the effects of step type and step direction on the step characteristics and body configurations, accounting for variability across participants (fixed effects were step type, step direction and the interaction of step type with step direction; random effects were specified for each participant within each step direction). Before employing the linear mixed models, Shapiro-Wilk tests indicated no violations of residual normality. Outcome values (trial average for each direction) were used in the linear mixed models. Statistical analyses were performed in SPSS (version 25) with a significance level of α = 0.05.
Comments (0)