
Remember me


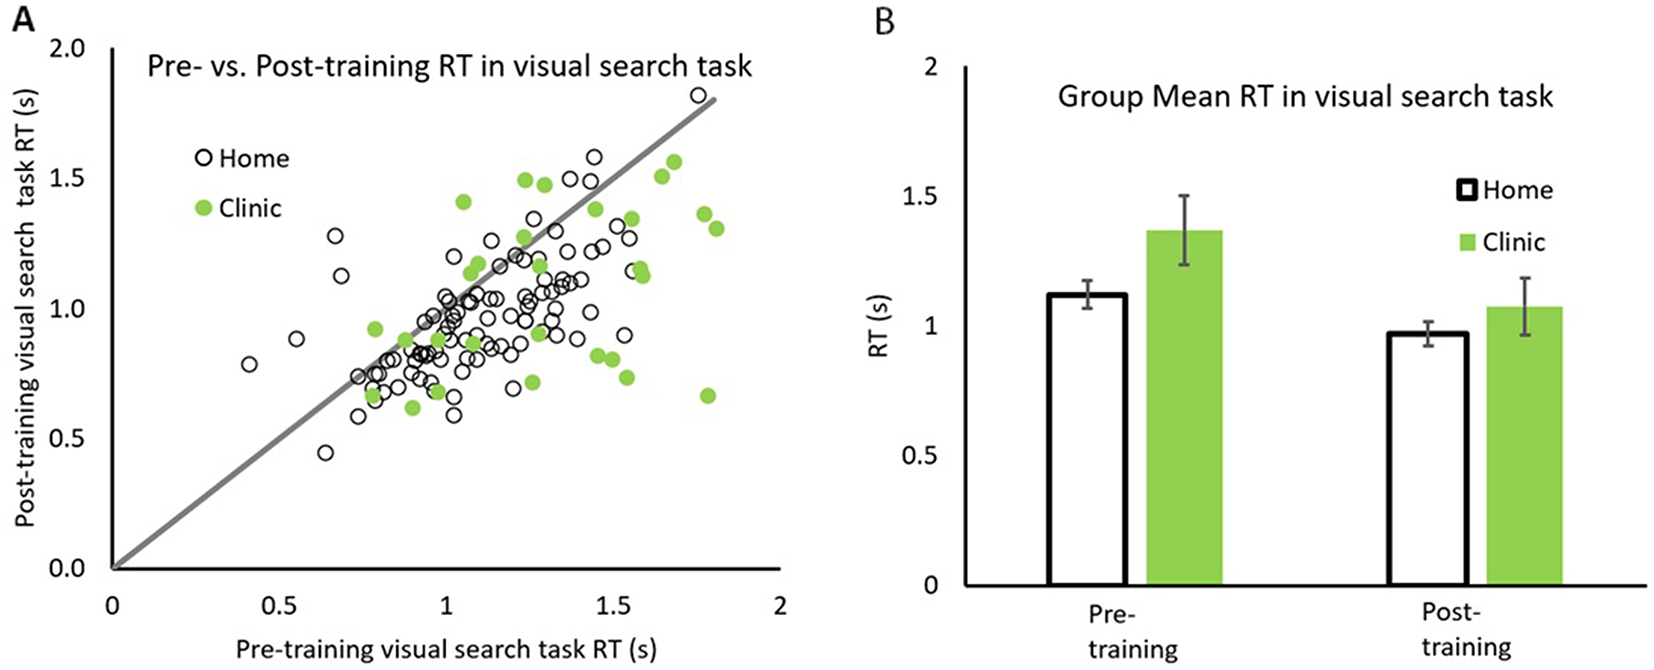


Pre- vs. post-reaction times for each participant is plotted in Fig. 1A, with data for Home and Clinic based patients depicted in open and solid symbols respectively. The line with slope of unity representing equal performance before and after training. All patients whose data falls below the line showing faster reaction times after rehabilitation. The group mean of reaction times in visual search task are also plotted in Fig. 1B.
Fig. 1
Comparison between pre/post training reaction times. Pre/post reaction times for both groups (A) and the group average RT (B) for home (open symbols) and in clinic (solid symbols) groups. Error bars represent 95% CI
The majority of data points falling below the line indicate that 80/95 (84.2%) home and 23/30 (76.7%) clinic based patients had faster reaction times after than before rehabilitation. A repeated measure 2 × 2 ANOVA with factors patient groups (Home and Clinic) by Training (before and after) for Visual Search Reaction Time, revealed a significant main effect of training, F(1,123) = 67.86, p <.001, ηp2 = 0.356. Home patients were significantly faster after rehabilitation (M = 0.971, SD = 0.235) than before (M = 1.121, SD = 0.262), (Mdiff=0.150, SD = 0.201), t(94) = 5.796, p <.001, Cohen’s d = 0.546. Similarly, Clinic patients were significantly faster after rehabilitation (M = 1.08, SD = 0.312) than before (M = 1.368, SD = 3.76), (Mdiff=0.285, SD = 0.374), t(29) = 6.192, p <.001, Cohen’s d = 1.038. Importantly there was a significant patient group x training interaction F(1,123) = 6.548, p =.012, ηp2 = 0.051 indicating that clinic patients improved significantly more than Home based patients (Fig. 1B).
Visual search errorPre- vs. post errors in visual search task for each participant is plotted in Fig. 2A, with data for Home and Clinic based patients depicted in open and solid symbols respectively. The line with slope of unity representing equal number of errors before and after training. All patients with data falling below the line have lower errors after rehabilitation. The group mean of errors in visual search task is also plotted in Fig. owin2B.
Fig. 2
Comparison between pre/post training errors in visual search task. Pre/post errors in visual search task for both groups (A) and the group average error (B) for home (open symbols) and in clinic (solid symbols) groups. Error bars represent 95% CI
The majority of data points falling below the line indicates that 71/95 (74.7%) home and 19/30 (63.3%) clinic based patients had lower number of errors after than before rehabilitation. A repeated measure 2 × 2 ANOVA with factors patient groups (Home and Clinic) by Training (before and after) for Visual Search Error, revealed a significant main effect of training, F(1,123) = 48.15, p <.001, ηp2 = 0.281). Home patients made significantly less error after rehabilitation (M = 0.63, SD = 2.01) than before (M = 3.40, SD = 3.85), (Mdiff=2.768, SD = 3.15), t(94) = 8.28, p <.001, Cohen’s d = 0.922. Similarly, Clinic patients had significantly less error after rehabilitation (M = 1.50, SD = 2.22) than before (M = 3.47, SD = 3.25), (Mdiff=1.97, SD = 0.65), t(29) = 3.306, p <.005, Cohen’s d = 0.655. There was no significant patient group x training interaction, F(1,123) = 1.380, p =.242, ηp2 = 0.011. It is likely that this is due to overall lower number of errors made at post training. As shown in Fig. 2A, there is a spread of data along the horizontal axis, whereas the vertical distribution (post-training data) is much less spread.
Cancelation task reaction timePre- vs. post-reaction times for cancelation task for each participant is plotted in Fig. 3A, with data for Home and Clinic based patients depicted in open and solid symbols respectively. The line with slope of unity representing equal performance before and after training. All patients with data falling below the line have faster reaction times while performing the cancelation task after rehabilitation. The group mean of reaction times in Cancelation Task are also plotted in Fig. 3B.
Fig. 3
Comparison between pre/post training reaction time in Cancellation task. Distribution of pre/post reaction times (s) in the Cancellation task for both groups (A) and the group average reaction time (B) for home (open symbols) and in clinic (solid symbols) groups. Error bars represent 95%CI
The majority of data points falling below the line indicate that 62/91 (68.1%) home and 25/31 (80.65%) clinic based patients had faster median reaction times in Cancelation Task after than before rehabilitation. A repeated measure 2 × 2 ANOVA with factors patient groups (Home and Clinic) by Training (before and after) for reaction time in Cancelation Task, revealed a significant main effect of training F(1,120) = 27.88, p <.001, ηp2 = 0.189. Home patients were faster after rehabilitation (M = 31.70, SD = 14.28) than before (M = 35.13, SD = 14.98), but this difference was not significant (Mdiff=3.43, SD = 10.38), t(90) = 1.595, p =.679, Cohen’s d = 0.125. Similarly, Clinic patients were faster after rehabilitation (M = 50.99, SD = 40.29) than before (M = 70.07, SD = 55.87), and this difference was significant (Mdiff=19.08, SD = 36.85), t(30) = 5.182, p <.001, Cohen’s d = 0.695. Importantly similar to reaction time in the visual search task, there was a significant patient group x training interaction, F(1,120) = 13.478, p <.001, ηp2 = 0.101, indicating that Clinic patients improved significantly more than the Home based patients (Fig. 3B).
Disability scorePre- vs. post-Disability Score for each participant is plotted in Fig. 4A, with data for Home and Clinic based patients depicted in open and solid symbols respectively. The line with slope of unity representing equal levels of reported disability before and after training. All patients with data falling below the line had reported less disability after rehabilitation. The group mean of Disability Scores are also plotted in Fig. 4B.
Fig. 4
Comparison between pre/post training disability score. Pre/post disability scores for both groups (A) and the group average scores (B) for home (open symbols) and in clinic (solid symbols) groups. Error bars represent 95% CI
The majority of data points falling below the line indicate that 60/90 (66.7%) home and 23/30 (76.7%) clinic setting patients reported less disability after than before rehabilitation. A repeated measure 2 × 2 ANOVA with factors patient groups (Home and Clinic) by Training (before and after) for Disability Score, revealed a significant main effect of training, F(1,118) = 41.74, p <.001, ηp2 = 0.261. Home patients reported significantly lower Disability Score after rehabilitation (M = 15.21, SD = 6.19) than before (M = 18.54, SD = 7.56), (Mdiff=3.33, SD = 5.70), t(89) = 5.667, p <.001, Cohen’s d = 0.508. Similarly, Clinic patients reported significantly lower Disability Score after rehabilitation (M = 10.47, SD = 4.43) than before (M = 14.73, SD = 6.11), (Mdiff=4.267, SD = 5.18), t(29) = 4.188, p <.001, Cohen’s d = 0.650. However, there was no significant interaction of patient group x training, F(1,118) = 0.630, p =.429, ηp2 = 0.005 (see Fig. 4B).
Between group comparisons at baselineFigures 1, 2, 3 and 4 above depict differences in baseline measurements between the two groups. Indeed independent sample comparisons of the home and clinic based patients show that the reaction times were significantly slower in the clinic group compared to the home group for both the cancelation task (t(120) = 5.45, p <.001) and in visual search task (t(120) = 4.03, p <.001), but the differences in errors made on both tasks were not significantly different. This may potentially indicate that the clinic group were more impaired compared to the home based group. However, the clinic group reported significantly lower subjective disability score compared to the home based group (t(118) = 2.499, p =.014). This dichotomy is discussed in the context of randomisation and differences between subjective and objectives measures of performance in the next section.
Comments (0)