Cell culture
The INS-1 and INS-1E rat insulinoma cell lines were cultured in RPMI-1640 medium (Gibco BRL, Grand Island, NY) containing 10% fetal bovine serum (FBS), 1 mM pyruvate, 10 mM HEPES, 50 μM β-mercaptoethanol, 100 U/mL penicillin, and 0.1 mg/mL streptomycin. All experiments were performed using INS-1 and INS-1E cells between the 20 and 30 passages. Mouse insulinoma (MIN6) cells were cultured in Dulbecco’s modified Eagle’s medium (DMEM) containing 15% FBS, 100 U/mL penicillin, 0.1 mg/mL streptomycin, 2 mM GlutaMAXTM (ThermoFisher, USA), 10 mm HEPES, 50 µM β-mercaptoethanol, and 25 mM glucose. Cells were maintained in a sterile tissue culture dish at 37 °C in an atmosphere of 5% CO2.
Insulin secretion
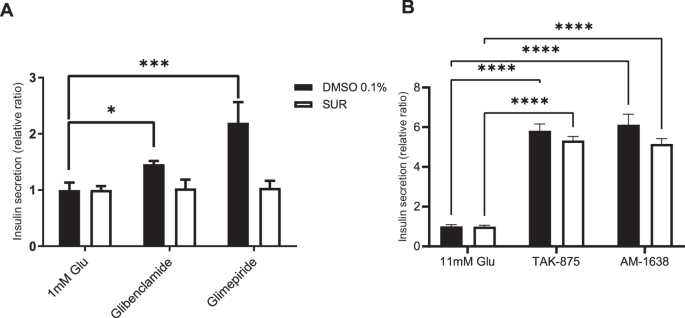
INS-1E cells (1.5 × 10⁵ cells/well) were seeded in 24-well plates with RPMI 1640 medium. After 18 h, the cells were incubated twice with KRB buffer (115 mM NaCl, 4.7 mM KCl, 1.28 mM CaCl2, 1.2 mM KH2PO4, 1.2 mM MgSO4, 10 mM NaHCO3, and 0.1% (w/v) bovine serum albumin, pH 7.4). Subsequently, the cells were washed and pre-incubated with 1 mM glucose in KRB buffer for 1 h. Insulin secretion was induced over a 2 h period by adding either 1 mM or 11 mM glucose along with the test substances. Supernatants were collected, and insulin secretion was measured using the rat insulin ELISA kit (Mercodia, Uppsala, Sweden) or mouse insulin ELISA kit (Mercodia, Uppsala, Sweden), following the manufacturer’s instructions.
Fluorescent imaging plate reader (FLIPR)-based Ca2+ determination
Intracellular calcium concentration, [Ca2+]i was determined by using a calcium assay kit (Molecular Devices, Sunnyvale, CA) in INS-1E cells. The cells were seeded into 96-well plates (black walls, clear bottom, Costar, Roskilde, Denmark) at a density of 1 × 10⁵ cells per well and allowed to attach during overnight culture. The cells were washed once with Krebs Ringer bicarbonate buffer (115 mM NaCl, 4.7 mM KCl, 1.28 mM CaCl2, 1.2 mM KH2PO4, 1.2 mM MgSO4, 10 mM NaHCO3, and 0.1% (w/v) bovine serum albumin, pH 7.4) supplemented with 1 mM glucose and 20 mM HEPES. Fluorometric data were acquired in a FlexStation scanning fluorimeter with an integrated fluid transfer workstation (Molecular Devices, Sunnyvale, CA). Excitation, emission, and cut-off filters were set to 485, 525, and 515 nm, respectively. The FlexStation was set to run for 5 min, collecting data at 2.5 s intervals (6 reads per well). Test solutions (50 μL at 5× concentration) were transferred at 60 s from the start of readings at a rate of 78 μL/s.
Whole-cell patch clamp
Membrane potentials of INS-1E cells were recorded in the current-clamp mode using an Multiclamp amplifier (Molecular Devices, Sunnyvale, CA, USA). The extracellular solution consisted of 140 mM NaCl, 5 mM KCl, 2 mM CaCl2, 1 mM MgCl2, and 10 mM HEPES (pH 7.4 with NaOH). The internal pipette solution consisted of 130 mM K-gluconate, 10 mM KCl, 5 mM NaCl, 2 mM MgATP, 0.2 mM Na2ATP, 5 mM EGTA, and 10 mM HEPES (pH 7.2 with KOH). Data were sampled at 20 kHz and measured using Clampfit 10.3 software (Molecular Devices, Sunnyvale, CA, USA).
For whole-cell patch clamp, borosilicate glass pipettes (Sutter Instrument, Novato, CA, USA) with resistance of 3–6 MΩ were filled with internal solution. The internal solution for recording of VDCC(Voltage dependent calcium channel) containing 130 mM CsCl, 1 mM MgCl2, 4 mM Na2ATP, 0.5 mM NaGTP, 10 mM HEPES, and 10 mM EGTA with pH 7.28 adjusted with CsOH. The cells were resuspended in 140 mM NaCl, 5 mM KCl, 2 mM CaCl2, 1 mM MgCl2, 10 mM glucose, and 10 mM HEPES (titrated to pH 7.4 with NaOH) with 1 μM TTX for VDSCs and 1 mM TEA(Tetraethylammonium) for potassium channels blocking. The current was elicited from a holding potential of −80 mV using a family of voltage steps from −100 to 90 mV with a 10 mV increment and 100 ms in duration.
The internal solution for recording of SK3 containing 130 mM K-gluconate, 5 mM KCl, 4 mM Na2ATP, 0.5 mM NaGTP, 10 mM HEPES, and 1 mM EGTA with pH 7.28 adjusted with KOH and CaCl2 was added to obtain 500 nM free Ca2+. The concentrations of free calcium were estimated using software Ca-EGTA Calculator v1.3 (https://somapp.ucdmc.ucdavis.edu/pharmacology/bers/maxchelator/CaEGTA-TS). The cells were resuspended in 144 mM NMDG, 5 mM KCl, 1 mM MgCl2, and 10 mM HEPES (titrated to pH 7.4 with HCl). The current was elicited from a holding potential of −55 mV using a family of voltage steps from −100 to 60 mV with a 10 mV increment and 500 ms in duration.
Data were acquired by pClamp 10.0 software (Molecular Devices) with MultiClamp 700B patch-clamp amplifier and Digidata 1550B (Molecular Devices). Data were low-pass filtered at 2 kHz and digitized at 5 kHz.
Microarray analysis
Total RNA was extracted from INS-1E cells using the guanidinium isothiocyanate method (TRIzol reagent; Invitrogen, Carlsbad, CA) followed by purification using RNeasy column (Qiagen, Valencia, CA). Following quantitative and qualitative evaluations performed with BioAnalyzer (Agilent, Santa Clara, CA, USA), RNA samples with an RNA integrity number (RIN) ≥ 6.7 and A260/A280 values ≥ 1.88 were subjected to cDNA synthesis, performed with the GeneChip whole transcript (WT) cDNA synthesis and amplification kit (Applied Biosystems, MA, USA). Next, the cDNA was fragmented and biotin-labeled using a GeneChip WT terminal labeling kit (Applied Biosystems, MA, USA), and approximately 5.5 μg of labeled cDNA was hybridized to the GeneChip Rat Gene 2.0 ST Array (Affymetrix, Santa Clara, CA, USA) at 45 °C for 16 h. The hybridized arrays were scanned on a GCS3000 Scanner (Affymetrix), and all data analyses were performed with the GeneChip Command Console Software (Affymetrix, Santa Clara, CA, USA).
Immunoblot analysis
INS-1E cells were treated with 10 μM glibenclamide for varying durations ranging from 1 to 11 days. Protein extraction was performed using a lysis buffer containing protease inhibitors, followed by centrifugation to collect the soluble protein fraction. Protein concentrations were determined using a Bradford protein assay. Equal amounts of protein (20–30 μg) from each sample were separated by sodium dodecyl sulfate-polyacrylamide gel electrophoresis (SDS-PAGE) and transferred onto nitrocellulose membranes [9]. The membranes were blocked with 5% skim milk in Tris-buffered saline-Tween 20 (TBS-T) and incubated overnight with primary antibodies against SK3 (Abcam, Cambridge, UK) or SK1 (Abcam, Cambridge, UK). Following serial washings, the membranes were incubated with horseradish peroxidase (HRP)-conjugated secondary antibodies, and the protein bands were visualized using an enhanced chemiluminescence (ECL) detection system (Promega, Madison, WI). The expression levels of tubulin-α and SK3 were quantified by densitometry analysis and analyzed using Image J software.
Sulfonylurea failure animal model
Sprague-Dawley (SD) rats were fed a normal diet or a diet containing glibenclamide (0.01%) for 3 weeks. On day 19, 10 mg/kg glibenclamide suspended in 0.5% methylcellulose was administered orally, and blood glucose was monitored using Accu-Chek (Roche, Indiana, USA). On day 21, animals were sacrificed, and the pancreas was harvested and fixed in 4% paraformaldehyde. The rat study was approved by the institutional animal care and use committee at LG Chem (Seoul, Korea) (approval number LGRD17-018).
Immunofluorescence staining
Pancreas samples obtained from SD rats following necropsy were utilized for immunofluorescence staining. Tissue sections with a thickness of 5 μm were prepared from paraffin-embedded and formaldehyde-fixed specimens, and subsequently deparaffinized. The sections were then subjected to overnight incubation with primary antibodies targeting SK3 (Abcam, Cambridge, UK; dilution 1:250) and insulin (Biorbyt, Cambridge, UK; dilution 1:500). Secondary antibodies included Alexa Fluor 488-conjugated goat anti-mouse IgG (Thermo Fisher Scientific, Waltham, MA, USA; dilution 1:100) and Alexa Fluor 594-conjugated goat anti-rabbit IgG (Thermo Fisher Scientific; dilution 1:100). Nuclei were counterstained using 4’,6-diamidino-2-phenylindole (DAPI, Sigma-Aldrich). The stained pancreas sections were mounted and imaged using the Cytation 5 imaging system (Agilent Technologies, Santa Clara, CA, USA). Islet count and size were quantified using Gen 5 software (Agilent Technologies) with automated recognition based on color analysis.
Statistics
Data are expressed as the mean ± standard error of the mean (SEM). Statistical analysis was analyzed by a two-tailed, unpaired Student t-test, while differences between more than two groups were analyzed by using one-way analysis of variance (ANOVA) followed by Dunnett’s multiple comparisons test using GraphPad Prism 9.3.0 software (GraphPad Software, Inc., La Jolla, CA, USA).

Comments (0)