Plasmids
EXOtic device plasmids, pDB68 (Connexin43 S368A), pDB30 (CD63-nLuc), were kind gifts from Dr Martin Fussenegger [10], and VHH72 (pcDNA-CD63-VHH [5]).
Cell lines
Vero E6 and neural stem cells (NSC) (A4 lineage) and HEK293 cells were cultured in Dulbecco’s modified Eagle’s medium (DMEM) (Thermo Fisher Scientific) supplemented with 10% fetal bovine serum (FBS) and incubated at 37 °C and 5% CO2.
Virus
SARS-CoV-2 Wuhan (Ancestral - VIC1) strain was obtained from the Peter Doherty Institute for Infection and Immunity and Melbourne Health, Victoria, Australia and cultured in Vero E6 cells. All SARS-CoV-2 infection work was conducted in a BSL3 approved animal facility at Griffith University.
Viral plaque and immunoplaque assays
For viral plaque assays, Vero E6 cells were infected with SARS-CoV-2 for 1 h before overlaying with 1% methylcellulose (MC) agar- viscosity (4,000 centipoises) (Sigma- Aldrich). Cells were incubated for 4 days at 37 °C before fixing in 8% formaldehyde and stained with 1% crystal violet to visualize plaques. Viral immunoplaque assays for SARS-CoV-2 were performed on Vero E6 cells as described previously [11] using recombinant monoclonal antibodies that recognizes the same SARS-CoV-2 spike protein (CR3022) epitope that VHH72 recognises [8, 9].
Spike protein binding assay
This assay was done as described previously [5]. HEK293 cells were transfected with either a control vector or a SARS-CoV-2 spike-expressing vector (Sino Biological, Beijing, China). After 48 h, equal numbers of VHH72-CD63 or control CD63 EVs were added to the cells and incubated at 37 °C and 5% CO2 for 4 h and washed with PBS. Luciferase activity was determined using the Nano-glo luciferase assay system (Promega).
In vitro SARS-CoV-2 neutralization assay
EVs or the monoclonal anti-SARS-CoV-2 RBD antibodies (clone nos. CB6 and 5309) were incubated with 250 PFUs of SARS-CoV-2 at the described concentrations for 30 min at RT before infecting Vero E6 cells for 1 h at 37oC. The virus was then removed, and the wells were layered with MC agar. The numbers of plaques were assessed 4 days after infection.
Viral copy number determination
To determine viral copy numbers in infected tissues, digital PCR against the N gene of SARS-CoV-2 (CDC primers from IDT - SARS-CoV-2 N1) was performed in Quant-Studio 3D Digital PCR 20 K chips (Thermo Scientific) on a ProFlex 2×Flat Block Thermal Cycler (Thermo Scientific). Results are analyzed on the QuantStudio 3D Analysis Suite software (Thermo Scientific) and expressed as viral copies per µl of template RNA.
EV production and characterization
Control and anti-SARS-CoV-2 targeting EVs in this study were produced using the following plasmids from the EXOtic packaging system as we have done previously in HEK293 cells [5]:
DB30 (Control EVs)
pDB30 (CD63-nLuc) + pDB68 (connexion EV release)
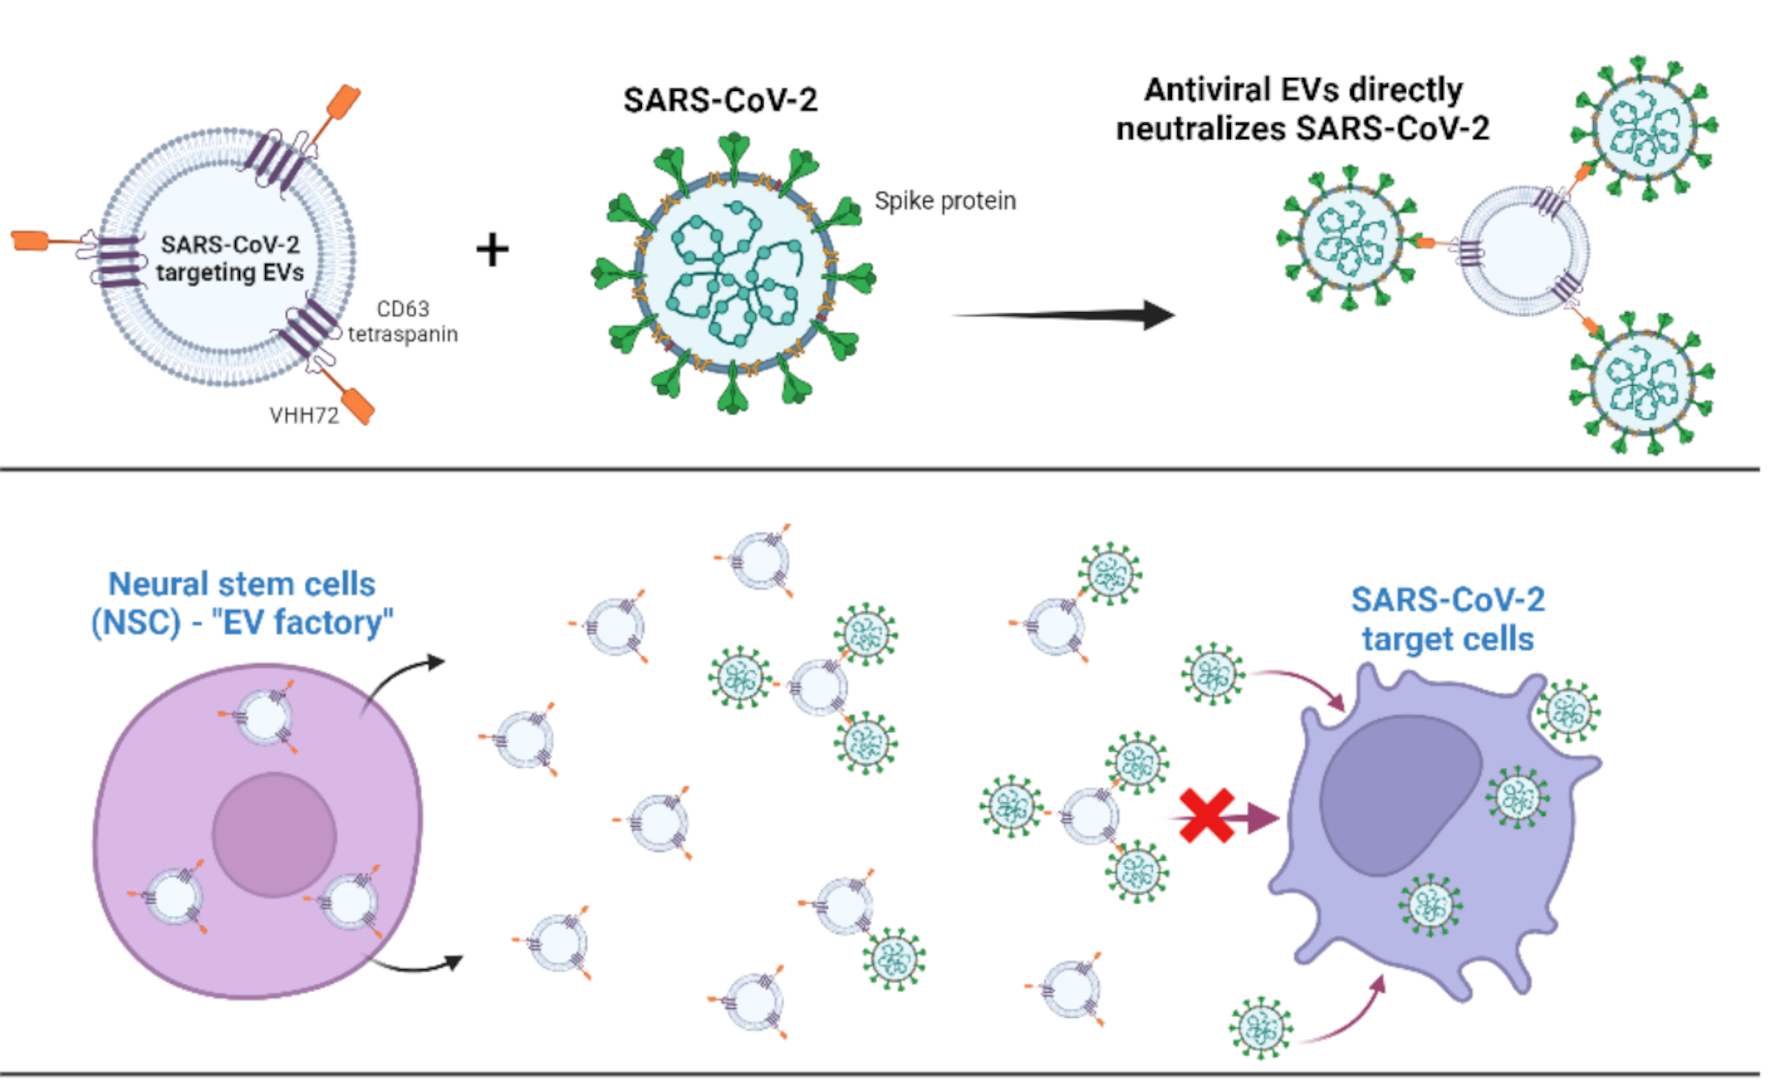
VHH (Anti-CoV-2 EVs)
VHH72 (pcDNA-CD63-VHH72) + pDB68 (connexion EV release)
Producer cells were transfected using Lipofectamine 3000 (Thermo Fisher Scientific) according to manufacturer instructions over 24 h before washing cells with DMEM and replacing media with DMEM + 10% EV-depleted FBS (Thermo Fisher Scientific). Supernatant was collected at 48–96 h later and centrifuged at 300 x g for 10 min at 4oC. The viability of the cells was determined at the time of EV collection, which was greater than 90%. Supernatants were transferred to a new 50-mL conical tube and further centrifuged at 2000 x g for 20 min at 4oC before passing the supernatant through a 0.45-mm filter (Millipore). The filtered supernatant was then ultracentrifuged at 100,000 x g for 120 min at 4oC on a SW32Ti rotor in a Beckman XL-900 ultracentrifuge to pellet the EVs and were resuspended in PBS. The final precipitate was resuspended in sterile PBS and passed through 0.22-micron Ultrafree® Centrifugal Filter Units (Millipore Sigma) before storing at − 20 °C until used. A recent study has shown that EVs stored at 4 °C or -20 °C for short periods do not significantly change compared to those stored at -80 °C [12]. EVs were then quantified using Nanoparticle Tracking Analysis (NTA) on a NanoSight (Malvern Panalytical) (1/4000 dilution) (Figure S1). A 488-nm laser was used to detect the EVs (slide shutter level = 1,259, slider gain = 366, syringe pump speed = 30) using a flow-cell top plate module. To determine particle count, a threshold setting = 3 was used. We then further confirmed that these are CD63-positive EVs by determining luciferase activity via the Nluc-tagged to CD63 relative to ultracentrifuged supernatant from untransfected cells (i.e., no EVs) as done previously [4]. On average we routinely collect ~ 10–12 × 109 EVs per 10 cm plate of NSCs (1–2 × 10⁶ cells) over a 96 h period.The particle size, polydispersity index (PDI) and zeta potential index of the EVs were obtained using Zetasizer Nano ZS (Malvern Instruments, Malvern, UK) following appropriate dilution in PBS (Figure S1) to overcome the reported limitations associated with measuring EV physio-characteristics using the NTA [13, 14]. The negative zeta potential of the EVs (surface charge) confirms the colloidal stability of EVs and values consistent with what was previously reported [15]. All measurements were carried out at room temperature.
Transmission electron microscopy
NSC EVs were visualized using transmission electron microscopy with negative staining. Prior to imaging, NTA determined EV concentrations at 2.07 × 10⁹ particles/mL. For TEM, samples were diluted 1:2 and 1:10 in MilliQ water, yielding working concentrations of 1.04 × 10⁹ and 2.07 × 10⁸ particles/mL, respectively. Copper grids (200–300 mesh, formvar/carbon-coated) were glow-discharged for 30 s at 400 mTorr (Evactron) to enhance hydrophilicity. A 5 µL droplet of EV suspension was placed on parafilm, and the grid (dark side down) was floated on the droplet for 3 min. Excess was wicked away using filter paper, and grids were immediately stained with 2% aqueous uranyl acetate for 2 min. Grids were then air-dried. Imaging was performed using a JEOL 1400 TEM (Jeol Pty Ltd, Japan), operated at 120 kV mounted with a 2 K TVIPS CCD camera at the Central Analytical Research Facility (CARF), Queensland University of Technology (QUT).
EV biodistribution in mice
NSC EVs were diluted in sterile PBS were complexed with DiIC18(7);1,1′-dioctadecyl-3,3,3′,3′-tetramethylindotricarbocyanine iodide (DIR), a lipophilic, near-infrared fluorescent cyanine dye at a final concentration of 1.55ng/µl DIR. A total of 108 NSC EVs were administered to C57BL/6 mice intranasally (20µL). Fluorescence was detected using a single photon animal imager at various timepoints post-administration.
SARS-CoV-2 in vivo work
K18-hACE2 mice (3–4 months old) were purchased from the Jackson Laboratory (Bar Harbor, ME) and bred in-house at the Griffith University Animal Resource Center. Mice were intranasally infected with 104 plaque forming unit (PFU) (20µL total volume) of live SARS-CoV-2 while under isoflurane anesthesia. Mice were subsequently treated with EVs either retro-orbitally (intravenous) (100µL total volume) or intranasally (20µL total volume) while under isoflurane anesthesia. Mice were weighed and scored daily until the experimental endpoint for disease progression. The well-being of mice was evaluated based on locomotion, behaviour, and appearance.
NanoString gene expression analysis
Immune gene expression analysis was undertaken using the NanoString nCounter analysis system (NanoString Technologies, Seattle, WA) and the commercially available nCounter Mouse Inflammation Panel. The Mouse Inflammation panel contains 248 genes of key inflammatory pathways and 6 reference/housekeeping genes. The nCounter system directly detects and counts single-stranded nucleic acid via reporter probes affixed with fluorophore barcodes and biotinylated capture-probes attached to microscopic beads. Probes are then affixed to lanes in cartridges and read in a digital scanner. Following the manufacturer’s protocol, 100 ng of total RNA extracted from tissue was hybridised with probes at 65 °C for 20 h before being inserted into NanoString Prep Station where the target-probe complex was immobilised onto the analysis cartridge. Cartridges were read by the nCounter Digital Analyser for digital counting of molecular barcodes corresponding to each target at 555 fields of view.
Nanostring data analysis
Gene expression data was analysed using a combination of the Advanced Analysis Module in the nSolver™ Analysis Software version 4.0 from NanoString Technologies (NanoString Technologies, WA, USA) or the Limma package in the R Statistical Computing Environment. nSolver enables quality control (QC), normalisation, differential gene expression (DGE), Pathview Plots and immune cell profiling. Negative and positive controls included in probe sets were used for background thresholding, and normalizing samples for differences in hybridization or sample input respectively. Data was corrected for input volume via internal housekeeping genes using the geNorm algorithm. Genes that were expressed below 20 counts in more than 90% of samples were excluded from analysis. Differential gene expression between the treatment groups was determined using a variance stabilized t-test. Pathway analysis was undertaken using the Gene Ontology and Kyoto Encyclopedia of Genes and Genomes (KEGG).
Quantitative real-time PCR (qRT-PCR)
Total RNA was extracted from mouse lung tissues for gene expression analysis. The relative mRNA levels of key inflammatory genes were performed using the UniPeak U One Step RT-qPCR SYBR Green Kit (Vazyme) and Rotor-Gene Q (Qiagen) platform. The specific primer pairs used are listed in Table 1. Gene expression was normalized to the endogenous control β-actin. All reactions were performed in triplicate, and relative gene expression was calculated using the 2 ^ (-ΔΔCt) method.
Table 1 qRT-PCR primers used in this studyStatistical analysis
All statistical analyses were performed using the statistical software package GraphPad Prism v9 and described in detail in respective figure legends.


Comments (0)