
Remember me
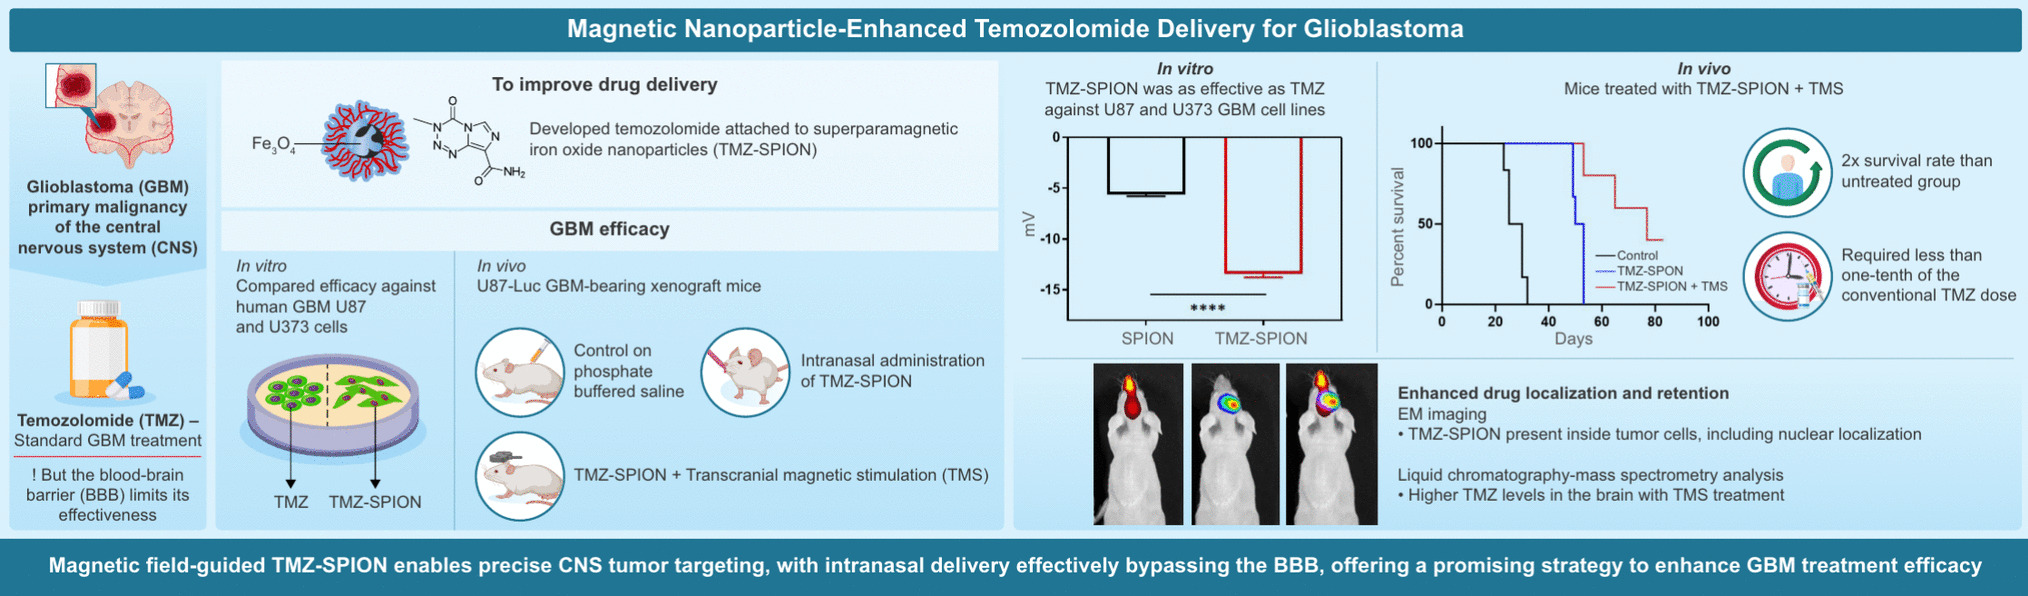


UV and FID spectrophotometry were each employed to identify suitable detection parameters that provide optimum sensitivity of the RP-HPLC method. The UV spectrum of APO prepared in the mobile phase is shown in Fig. 3A, confirming that the λmax was 274 nm, in line with previously reported literature [16, 19, 20, 27, 29, 30]. Additionally, APO is known to be fluorescent, providing an excellent opportunity to improve sensitivity and selectivity [24, 31, 32]. A fixed-excitation emission scan with 274 nm set as the excitation wavelength revealed a selective region of emission between approximately 350–525 nm, as shown in Fig. 3B. The wavelength of maximum emission in this region was 458 nm. Similarly, this was in line with previous reports [18, 33]. These detection parameters were thus employed in the developed RP-HPLC method.
Fig. 3
(A) Absorption spectra of APO dissolved in 70:30 (v/v) 0.1% (v/v) TFA in water and ACN. Mean measurements shown (n = 3). (B) Emission spectra of APO dissolved in 70:30 (v/v) 0.1% (v/v) TFA in water and ACN. Generated using a fixed-excitation wavelength of 274 nm with a PMT gain of 400 V. Mean measurements shown (n = 3)
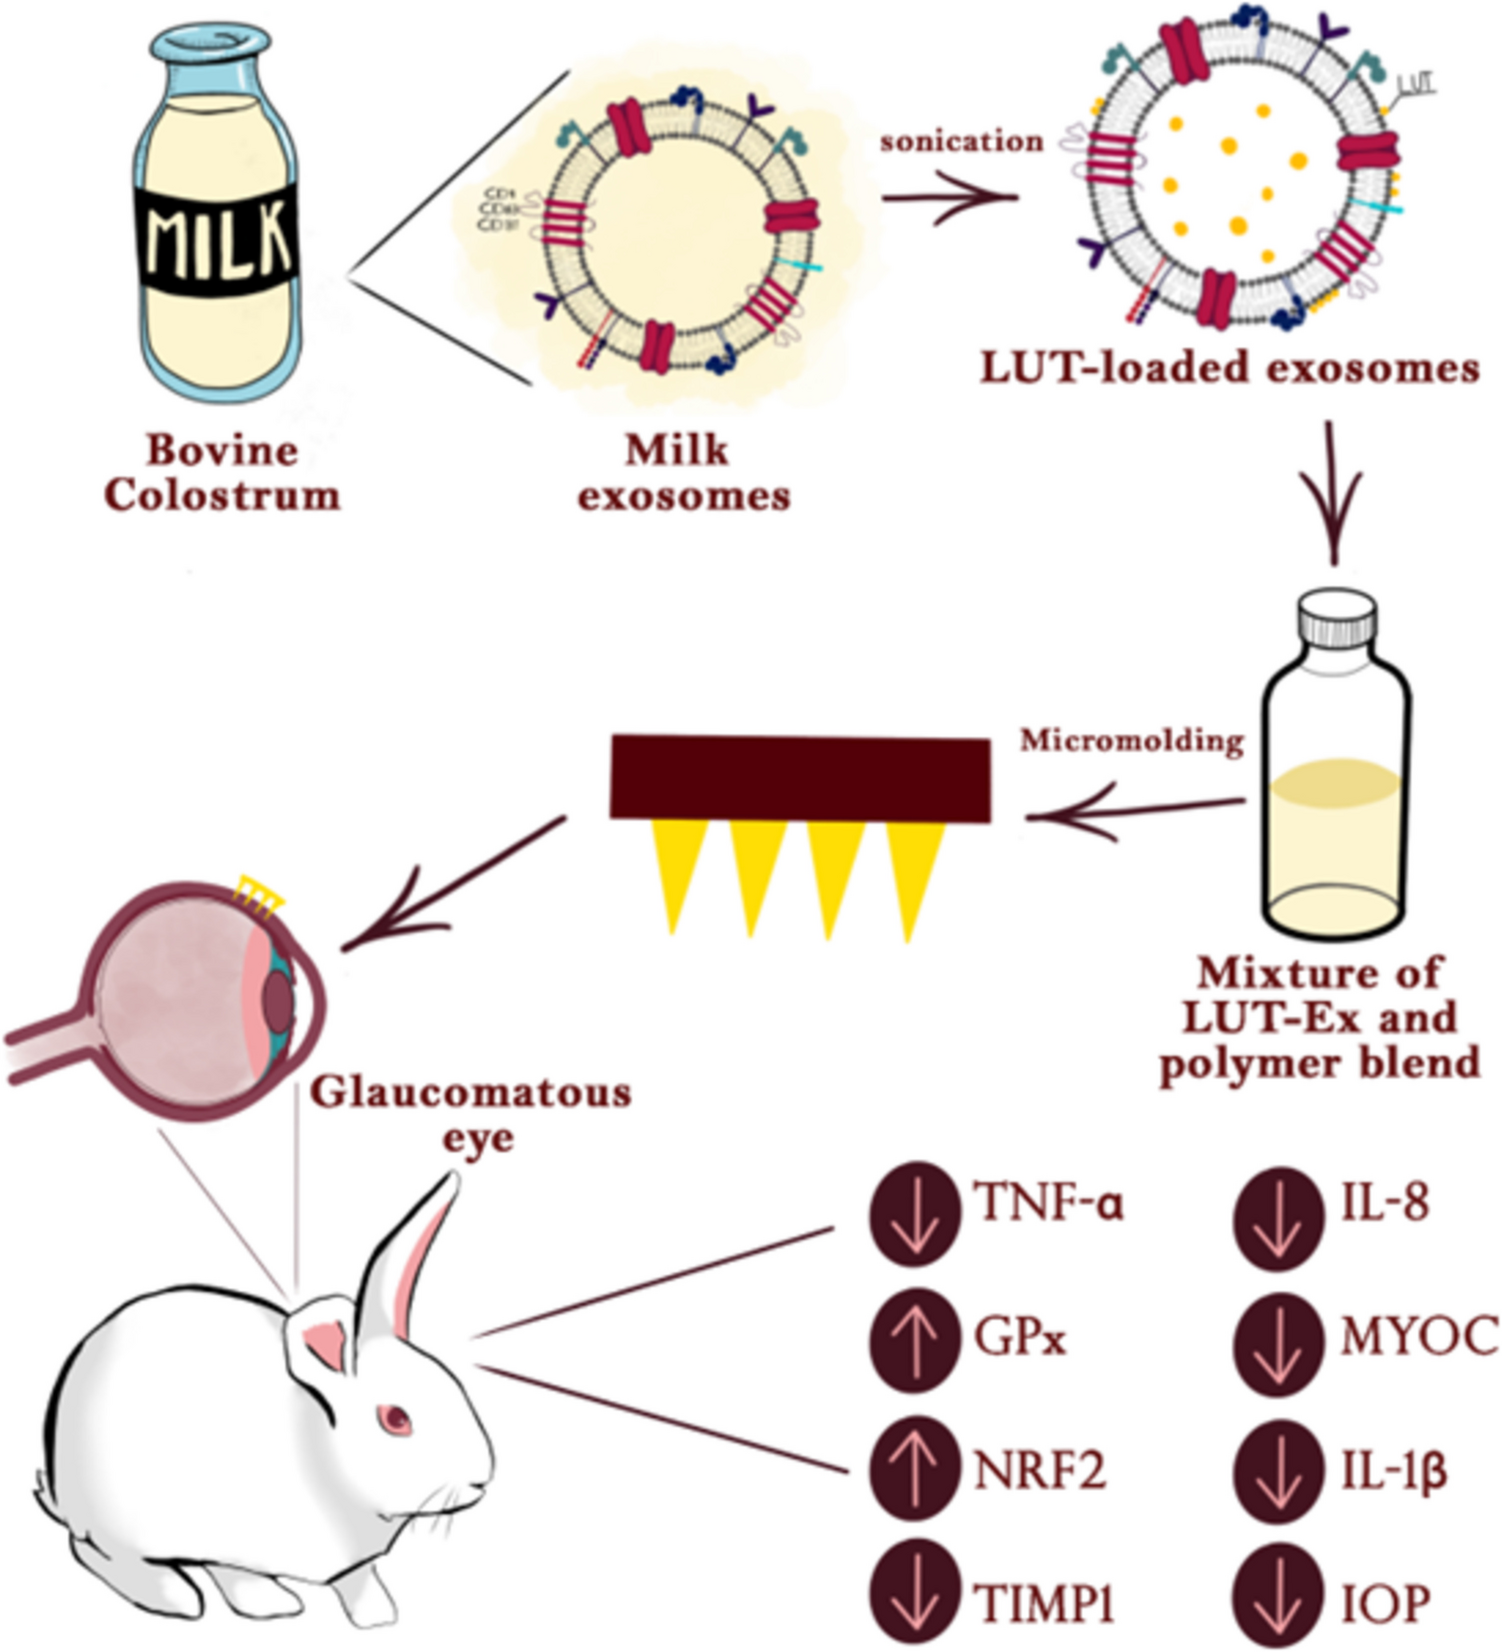
Method validationLinearity and rangeIn line with ICH M10 bioanalytical guidelines, linearity and range of the RP-HPLC method were determined using a minimum of 6 non-zero calibration standards between 12.5 and 0.098 µg/mL and 12.5–0.391 µg/mL, for FID and UV respectively [28]. The linear regression models were constructed based on average peak area and plotted in Fig. 4. Summaries are provided in Table 2, with R2 values > 0.9999 confirming sufficient linearity is achieved via both detection techniques. Furthermore, these calibration curves were deemed acceptable, as shown in Table 3. For both FID and UV, bias and CV values were within ± 15% for each calibration standard. In exception to this was the LLOQ for FID, which was within ± 20% bias.
Fig. 4
(A) FID calibration curve of APO prepared in porcine skin extract in range of 12.5–0.098 µg/mL. (Means ± SD, n = 3). (B) UV calibration curve of APO prepared in porcine skin extract in range of 12.5–0.391 µg/mL (Means ± SD, n = 3)
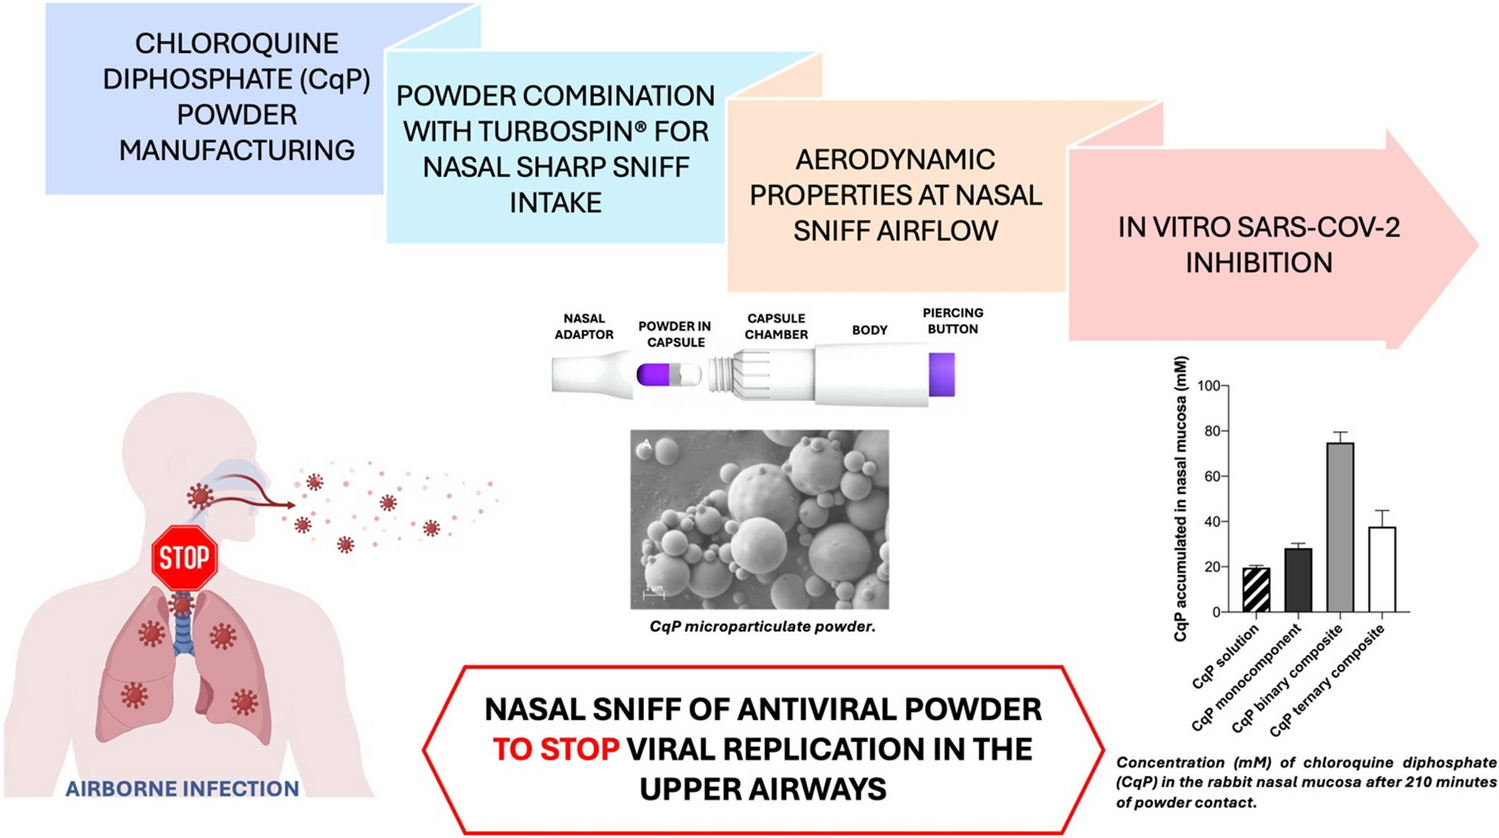
Table 2 Summary of linear regression analysis of calibration curves shown in Fig. 4Table 3 Back-calculated concentrations of APO based on linear regression models summarised in Table 1 (Means ± SD, n = 3)SpecificitySpecificity of the RP-HPLC method to detect APO in presence of interferences derived from excised neonatal porcine skin and degradation is summarised in Fig. 5. In the retention time region of APO displayed in Fig. 5A and B (FID and UV detection respectively), there was minimal to no interference from porcine skin, as shown by Fig. 5D and E. Additionally, after 7 days storage at 37 °C in PBS (pH 7.4), without the presence of any stabiliser, APO nearly fully degraded, being in fact undetected by UV. However, the generated degradants did not elute in the retention time region of APO and were baseline resolved by both detection techniques, as confirmed by Fig. 5C and F, respectively. Thus, the method was stability-indicating, and can reliably quantify APO during ex vivo percutaneous permeation and deposition studies.
Fig. 5
Chromatograms obtained via FID and UV arranged into left and right column, respectively. (A-B) 25 µg/mL APO prepared in porcine skin extract. (C-D) Blank porcine skin extract, with minimal to no interference in the retention time region of APO. (E-F) 100 µg/mL APO prepared in PBS (pH 7.4) and stored in 37 °C for 7 days, demonstrating baseline resolution from generated degradants labelled on chromatograms
SelectivityThe RP-HPLC method demonstrated high selectivity, which in accordance with ICH M10 bioanalytical guidelines provided an LLOQ peak area response more than 5-fold greater than the response generated by blank porcine skin matrix, within the same retention time region. This is confirmed in Table 4, with the LLOQ: matrix ratio of both detection techniques being > 5. Comparing the two detection techniques, FID was unsurprisingly more selective than UV with average LLOQ: matrix ratios of 25.000 ± 4.696 and 7.084 ± 0.501, respectively, due to the 11-fold reduced response generated by the blank porcine skin matrix.
Table 4 Comparison of peak area responses of LLOQ QC standards versus blank Porcine extract (Means ± SD, n = 6)Within-run and between-run accuracy and precisionTo assess the accuracy and precision performance of the RP-HPLC method, QC standards from four concentration levels were prepared based on the linear range of both detection techniques. Table 5 shows that repeated measurements of the high, medium and low concentrations of APO were consistently within ± 6% of the target value and maintained excellent precision within ± 10% CV, for both within-run and between-runs. Additionally, the LLOQ was shown to be well within acceptance limits of ± 20% bias and CV. Therefore, the RP-HPLC method can consistently provide accurate and precise data reliably over a period of time.
Table 5 Summary of within-run (n = 5) and between-run (n = 15) accuracy and precision studies (Means ± SD)CarryoverBy comparing the blank response in Tables 4 and 6, there was notably an increased mean matrix response immediately after injection of a high concentration of APO (50 µg/mL). This was likely caused by a small amount residual analyte within or on the surface of the autosampler needle, resulting in minor carryover between injections. However, as confirmed in Table 6, the carryover was minimal and did not significantly affect the performance of the RP-HPLC method. Indeed, mean LLOQ: matrix response ratios of 7.79 ± 0.65 and 5.54 ± 0.03, for FID and UV detection respectively, were in accordance with acceptance criteria laid out in ICH M10 bioanalytical guidelines.
Table 6 Comparison between LLOQ QC standard response with response of blank Porcine skin extract directly after injection of 50 µg/mL APO (Means ± SD, n = 3)Dilution integrityThe dilution integrity was assessed using arbitrary dilution factors of 10 and 100, in order to give a general understanding of the effect the dilution process may have on the accuracy and precision of any quantitative measurements of APO. Table 7 shows that for both detection techniques, the % bias and CV of the diluted samples were will within acceptance criteria of ± 15%. Therefore, samples from ex vivo permeation or deposition studies may be reliably diluted to be within the linear range of the RP-HPLC method without affecting the integrity of the data.
Table 7 Analysis of the effects upon accuracy and precision of data caused by dilution of samples. Dilution factors of 10 and 100 were performed upon a 100 µg/mL APO sample (Means ± SD, n = 3)RobustnessIn order to understand the robustness of the method to minor random variations in chromatographic conditions, these were purposefully performed with the intention of monitoring the effect upon quantitative measurement and elution time of APO. Table 8 highlights that slightly altering the mobile phase flow-rate, composition and TFA concentration will not produce any significant effect upon either of the aforementioned data parameters. Indeed, for both FID and UV detection, recovery of APO consistently remained between 96 and 102%, and retention time remained within ± 0.05 min of the original. Thus, the RP-HPLC method was shown to be highly robust, additionally due to the fact that it does not require any temperature control of the column compartment. Interestingly, this may highlight the ease-of-transfer of the method to an alternative HPLC instrument model or laboratory, and then employed by other analysts while maintaining performance. This is easily facilitated by the duality of both FID and UV detection.
Table 8 Summary of robustness studies; study of the effect caused by small alterations in % (v/v) TFA concentration in aqueous phase, % (v/v) ACN in mobile phase composition and flow-rate, upon APO peak retention time and response. (Means ± SD, n = 5)Stability studies and saturation solubility in PBS (pH 7.4) with 0.1% (w/w) AAAPO is known to rapidly auto-oxidise in aqueous solution to oxoapomorphine, particularly below pH 7 [27]. Of the previously published reports that study ex vivo permeation of APO across human or animal skin, some fail to account for this by omitting the use of antioxidants in their release media [15]. Additionally, those that do, employed sodium metabisulfite (SMB) to prevent chemical degradation of APO [18, 21, 24]. A recent study by Ang et al. provided an in-depth study on the stabilizing effect of different antioxidants including SMB and AA incorporated into acetate buffer (pH 4.0). Despite being commonly incorporated into formulated APO commercial products, SMB had a very weak capability of preventing auto-oxidation, and was outperformed by AA [27]. These findings indicate a flawed experimental design in the aforementioned studies. Thus, in order to select a more appropriate release media, AA was investigated further for its ability to stabilise APO when incorporated into PBS (pH 7.4).
Figure 6A and B illustrate the recovery of APO over a period of 28 days in varying storage conditions, at two concentrations (100 µg/mL and 10 µg/mL). Clearly shown here is an inverse relationship between drug concentration and rate of degradation, driven by oxygen to drug ratio [27]. At high concentrations above 100 µg/mL, APO was stable in PBS (pH 7.4) with 0.1% (w/w) AA for up to 28 days even at room temperature in lit conditions. Although, reduced concentrations of APO may require lower temperatures during storage to maintain stability for long periods of time. Interestingly, APO had superior stability in refrigerated conditions, in comparison to -20 °C. Initially this seems counter-intuitive as storing pharmaceutical agents at temperatures < 0 °C is generally considered to enhance stability and obviate concerns regarding liquid storage. However, based on prior reports this phenomenon is not unprecedented and may be due to exclusion of drug solute molecules by the moving ice-front during the uncontrolled freezing process. This results in cryoconcentration of drug molecules into highly concentrated zones, which may have altered levels of freely available ascorbic acid to protect the APO from oxidative stress [34, 35]. Therefore, storing APO solutions dissolved in PBS (pH 7.4) with 0.1% (w/w) AA in refrigerated conditions of approximately 4 °C is recommended and may maintain > 90% recovery for up to 28 days.
The stabilising effect of incorporating 0.1% (w/w) AA into PBS (pH 7.4) is illustrated in Fig. 6C. Within 24 h at 37 °C, APO stored in PBS (pH 7.4) alone drastically degraded to as low as 5.60 ± 0.56% and 4.92 ± 0.47% of the initial 100 µg/mL and 10 µg/mL concentrations, respectively, and fully degraded after 48 h. However, when stored in PBS (pH 7.4) with 0.1% (w/w) AA, APO was stable for up to 48 h at 37 °C with > 90% recovery. Indeed, Fig. 6C illustrates that concentrations of 100 µg/mL or higher may even be stable for greater than 7 days at this temperature. Further highlighted in Fig. 6D, was significantly greater stability of APO within a 24-hour period, upon incorporation of 0.1% (w/w) AA into the PBS (pH 7.4) (p < 0.0001), which is more than sufficient for ex vivo percutaneous permeation and deposition studies, based on the limiting factor of porcine skin viability in non-refrigerated saline solutions [36]. Furthermore, no significant difference in recovery of the initial APO concentration was found between 100 µg/mL or 10 µg/mL after 24 h, suggesting that the oxygen: drug ratio effect was minimal within this period. Overall, PBS (pH 7.4) with 0.1% (w/w) AA may offer sufficient stability of APO throughout the duration and temperature conditions of typical ex vivo percutaneous permeation and deposition studies performed with neonatal porcine skin, thus ensuring reliable and accurate data. Additionally, these findings verify that choice of buffer may have a strong effect on the stabilising capability of antioxidants, as 0.1% (w/w) AA was shown to perform more effectively here when incorporated into PBS (pH 7.4) than with acetate buffer (pH 4.0), which was previously investigated and shown to have a negative impact on stability [27].
Fig. 6
(A) and (B) show recovery of APO prepared in 0.1% (w/w) AA in PBS (pH 7.4) over a period of 28 days at two different concentrations (100 µg/mL and 10 µg/mL, respectively) when stored in various conditions. Dotted line represents 90% recovery (Means ± SD, n = 3). (C) compares recovery of APO stored in 37 °C over a period of 7 days when prepared in PBS (pH 7.4) with or without 0.1% (w/w) AA. Dotted line represents 90% recovery (Means ± SD, n = 3). (D) Direct comparison of recovery of APO after 24 h in 37 °C. Dotted line represents 90% recovery. (Means + SD, n = 3). All data shown in (A – D) quantified by FID
In order to maintain sink conditions, the concentration of drug in the release media contained in the receptor chamber of Franz diffusion cell apparatus should never exceed 10–30% of the saturation solubility [37, 38],. Through analysis by the validated RP-HPLC method, saturation solubility of APO in PBS (pH 7.4) with 0.1% (w/w) AA was determined to be 4.08 ± 0.20 mg/mL (n = 4). In addition to providing excellent stability, this media should easily achieve sink conditions for ex vivo permeation studies using modified-Franz diffusion cells, dependent on the drug-loading of the TDDS formulation applied in the donor compartment.
Extraction efficiency of APO from porcine skinSummarised in Fig. 7 is a comparison of the efficiency of ACN, MeOH and 0.1% (w/w) AA in H2O, to extract low quantities of APO deposited within full-thickness neonatal porcine skin. These solvents extracted 96.66 ± 5.18% (no significant difference compared with control group) 91.24 ± 2.63% and 83.45 ± 10.67% of a 100 µg deposit, respectively. For a 10 µg deposit, each solvent had diminished extraction efficiency, with ACN, MeOH and 0.1% (w/w) AA in H2O demonstrating mean recoveries of 89.10 ± 2.05%, 85.34 ± 2.14%, and 69.59 ± 7.50%, respectively. Therefore, out of these solvents, ACN was proven to be the superior choice with the highest recovery of APO at both levels. Although, this process was concentration-dependent with lower concentrations of drug being harder to fully extract from porcine skin tissue, which may be partially due to the oxygen: drug ratio effect outlined previously, resulting in degradation during the extraction process. This may make factoring extraction efficiency into deposition studies challenging. However, ACN was able to essentially fully recover quantities close to and greater than 100 µg per 250 mg full-thickness neonatal porcine skin tissue (approximately 1 cm2), thus this may not be an issue in most cases.
Fig. 7
Efficiency of ACN, MeOH and 0.1% (w/w) AA in water to extract differing low amounts of APO deposited in full-thickness neonatal porcine skin. Quantified by FID (Means + SD, n = 5)
Determination of drug distribution of APO PSA films via multi-photon microscopyDue to the fluorescent nature of APO, the distribution of drug throughout the PSA films could easily be characterised using multi-photon microscopy via three-photon excitation at 822 nm, as shown in Fig. 8. The prepared APO PSA films were found possess uniform drug distribution throughout the patch adhesive, as illustrated in Fig. 8A, where the drug is highlighted in blue. Small voids were present with little-to-no APO; however, these were to be expected due to the drying process after solvent-casting [39]. The XYZ stack in Fig. 8B determined that APO was predominantly located 20–80 μm deep within the adhesive matrix of the PSA films. Overall, the PSA films were well-prepared with drug confirmed to be present throughout the entirety of the patch surface.
Fig. 8
(A) Surface images of representative APO PSA film captured by TCS SP8 MP multi-photon microimaging. Left image shows distribution of APO (represented in blue) throughout patch surface. Right image displays visualisation of patch adhesive via light transmission. (B) XYZ stack of 600 × 600 μm area of patch surface, with APO highlighted in blue on left image
Ex vivo percutaneous permeation and deposition studyDemonstrated in Fig. 9 (A) and (B), is the novel approach of incorporating APO into 1 cm2 PSA films, which when used in conjunction with PEG penetration enhancers could successfully deliver APO across porcine skin. The effectiveness of the penetration-enhancing effect of PEG appeared to be molecular weight-dependent, with PEG 200, 400, and 3000 delivering 19.078 ± 15.590 µg/cm2, 107.020 ± 63.322 µg/cm2, and 52.872 ± 39.566 µg/cm2 over 24 h, respectively. Understandably so, as the lipid-fluidisation by nonionic surfactants is known to be optimal for carbon-chain lengths ranging between 10 and 14, similar to PEG 400 [40]. Each formulation generally followed Fickian-diffusion, demonstrating pseudo-steady state kinetics, allowing for the permeation profiles to be modelled by simple linear regression, with R2 values consistently > 0.89 as shown in Table 9 [41]. Thus, as shown in Fig. 9 (C), the flux of APO -PSA film formulations containing PEG 200, 400 and 3000 was 0.674 ± 0.678 µg/cm2/hr, 4.015 ± 2.361 µg/cm2/hr and 2.225 ± 1.699 µg/cm2/hr, respectively. Without the presence of PEG, APO could not effectively diffuse across dermatomed neonatal porcine skin, due to the physicochemical limitations of the drug molecule and the densely packed, lipid-rich extracellular matrix of the stratum corneum [42, 43]. Indeed, this was in line with prior reports showing poor transdermal permeation of APO without chemical modification, iontophoresis, microemulsion or microneedle mediated-techniques [15,16,17,18,19,20,21,22,23,24]. Therefore, the highest mean flux of APO across porcine skin was provided by films containing PEG 400, which was statistically significant compared to films manufactured with PEG 200 (p < 0.05) or without PEG (p < 0.01). However, no statistically significant difference was found between PEG 400 and PEG 3000 in terms of drug flux. It should be noted that, although necessary to ensure that uneven hair density and residual shafts do not compromise the effective contact area of the APO-PSA films, the pre-treatment of skin with depilatory hair removal cream may have minorly enhanced the permeation of APO. However, this effect will have been uniform across all of the formulations. Additionally, the occlusive conditions under which the study was performed will have resulted in increased hydration of the skin and thus an enhanced permeability of APO [44]. Deposition of APO in the dermatomed porcine skin was similarly affected by presence and molecular weight of PEG within the APO -PSA films, as highlighted in Fig. 10. Without the penetration-enhancing effect of PEG, APO almost completely remained within the adhesive matrix of the PSA films with only 3.156 ± 3.553 µg deposited in the porcine skin after 24 h application-time.
Based on their performance, these PSA films are unlikely to be clinically useful in delivering therapeutic doses of APO to patients suffering with PD. Indeed, they provided similar [15] or inferior [16,17,18,19,20,21, 23, 24] drug fluxes (per square unit area) in comparison to those aforementioned studies already in literature. This may largely be due to interactions between APO and carboxyl groups present in DuroTak® 87-2677, resulting in inhibited skin permeation [45]. Therefore, to conclude that PSA films are not viable for APO may be premature, as the scope of this study provided merely an initial investigation into this novel approach to transdermally delivering APO, in order to demonstrate the applicability and versatility of the analytical methodology presented earlier. A more focused study into APO PSA patches should explore different adhesives, penetration enhancers and drug-loadings in order to provide a more complete assessment of the effectiveness of this approach.
Included in Figs. 9 and 10; Table 9 are comparisons in the results obtained via both UV and FID. Interestingly, both detection techniques provided highly similar data with no statistically significant differences found, thus highlighting the versatility of the analytical method. Furthermore, the high sensitivity of both detection techniques allowed for accurate quantification of low concentrations of APO in release media in the receptor compartment (< 6 h) and neonatal porcine skin. The RP-HPLC method described in the present work may therefore be reliably employed during ex vivo percutaneous permeation and deposition studies using either UV or FID, dependent on instrument availability, without compromising data integrity.
Fig. 9
(A) and (B) show permeation profiles of each APO -PSA film formulation across dermatomed neonatal porcine skin over a 24-hour period, as detected by FID and UV respectively. Lines shown generated by simple linear regression. (Means + SD, n = 4). (C) Comparison of APO -PSA permeation rates determined from the slope of simple linear regression analysis (Means + SD, n = 4)
Table 9 R-squared values determined from linear regression analysis of permeation-time graphs shown in Fig. 6 (A) and (B)Fig. 10
Comparison of deposition of APO in dermatomed neonatal porcine skin after 24 h adherence of APO-PSA films during ex vivo permeation study. (Means + SD, n = 4)
Comments (0)