Cell lines and reagents
The human PCa cell lines C4-2, PC-3, DU145, LNCaP, and 22Rv1 were purchased from the American Type Culture Collection (ATCC, VA, USA). The above cell lines were grown in RPMI 1640 medium (Gibco, NY, USA) supplemented with 10% fetal bovine serum (FBS). VCaP, HEK293T, and MDA-MB-231 cells were obtained from ATCC and maintained in DMEM medium (Gibco) with 10% FBS. All cell lines were authenticated by short tandem repeat (STR) genotyping and were used within 2 months of continuous culturing. Cells were mycoplasma-negative in routine tests. When indicated, cells were treated with EZP-6438 (Selleckchem, TX, USA), GSK126 (Cayman Chemical, MI, USA), enzalutamide (Selleckchem), and DL-β-Hydroxybutyric acid sodium salt (Sigma, MO, USA). MS1943 and MS8815 were synthesized by Dr. Jian Jin at the Icahn School of Medicine at Mount Sinai. For the xenograft study, a ketone drink (Ketone IQ, R-1,3-Butanediol) was purchased from H.V.M.N (CA, USA).
Antibodies
Primary antibodies used in this study are listed in Supplementary Table 1.
Primers
RT-qPCR and ChIP-qPCR are listed in Supplementary Table 2.
Transfection and transduction of cell lines
All the silencer siRNAs used in this study were purchased from Thermo Fisher (MA, USA) (siEZH2-1: s4916, siEZH2-2: s4918). Lipofectamine RNAiMAX (Invitrogen, MA, USA) was utilized for siRNA transfection according to the manufacturer’s protocol.
Lentiviral shRNA vector was purchased from Sigma (shEZH2: TRCN0000286227). EZH2 depletion utilized doxycycline inducible lentiviral human shRNA, which targeted EZH2 plasmids were generated (shEZH2-1: TRCN0000286227, shEZH2-2: TRCN0000293738). Lentivirus was packaged by co-transfecting the shRNA construct with the helper plasmids pVSVG and psPAX2 into HEK293T cells. The viruses were harvested at 48 h post-transfection. Transduction of C4-2 cells took place for 48 h with 10 ug/mL polybrene, followed by puromycin selection (3 mg/mL).
Cells were transiently transfected with either pcDNA3.1 empty vector (EV) or HMGCS2 ORF clone (GenScript, NJ, USA) using Lipofectamine 3000 following the manufacturer’s protocol (Invitrogen).
RNA isolation and RT-qPCR
RNA was extracted from cells using the RNeasy Plus Kit (QIAGEN, Germany). cDNA was synthesized from 2 μg of total RNA using the High-Capacity cDNA Reverse Transcription Kit with RNase Inhibitor (ThermoFisher Scientific). Each cDNA sample was amplified using PowerUP SYBR Green Master Mix (Applied Biosystems, CA, USA) using QuantStudio 6 Flex real-time PCR systems (Applied Biosystems). The 2−ΔΔCT method was used to calculate the relative gene expression levels, and β-actin was used as an endogenous control to normalize each sample. The primers are listed in Supplementary Table 1.
Western blot analysis
Protein samples were separated electrophoretically by SDS–PAGE, and semi-dry transferred to polyvinylidenedifluoride membranes (Biorad, CA, USA). The membranes were blocked for 60 min in Tris-buffered saline–Tween 20 with 5% nonfat milk. Thereafter, immunoblotting was performed with primary antibodies overnight. After washing for three times, the membranes were incubated with goat anti-mouse/rabbit IgG (H + L)–horseradish peroxidase secondary antibody (GenDEPOT (TX, USA), 1:2,000 dilution) for 1 h. The signals were developed using western ECL substrate (Bio-Rad), and images were scanned using a Bio-Rad imaging system. The relative protein level was evaluated using ImageJ software.
EZH2 rescue assay
The EZH2 plasmid was generously provided by Dr. Yu. For rescue assay, shEZH2 lentivirus (shEZH2: TRCN0000286227) was selected because it targets the 3’UTR region of endogenous EZH2, and ectopic EZH2 expression remains unaffected. Samples were collected 48 h after transfecting EZH2 plasmids into EZH2-deficient C4-2 cells, and RT-qPCR was performed to measure mRNA levels. Doxycycline-inducible EZH2-depletion cells were generated and treated with doxycycline (1 µg/mL) for 4 days, after which the media were replaced with fresh medium. Cell lysates were harvested for immunoblot analysis after 4 days of maintenance with fresh media (8 days from the start of doxycycline treatment) and again after 26 days of maintenance with fresh media (30 days from the start of doxycycline treatment).
Co-immunoprecipitation (co-IP)
C4-2 cells were treated with BHB or vehicle (RPMI medium) for three days. 10 μM of MG132 (Calbiochem, CA, USA) was used at two days post-treatment of BHB for 24 h. Cells were washed with cold PBS three times and lysed in NP-40 lysis buffer (Thermo Fisher Scientific) with protease and phosphatase inhibitor cocktails (Thermo Fisher Scientific). The lysate was kept on ice for 15 min followed by sonication. Insoluble material was removed by centrifugation. Lysates were pre-incubated with Dynabeads protein A/G (Invitrogen) to eliminate nonspecific binding. Then, anti-EZH2 antibodies were mixed into the lysates with newly added Dynabeads and incubated at 4 °C overnight. The immune complexes were collected using a magnetic separator and washed three times with lysis buffer. To denature proteins, beads were added to 2× reducing SDS sample buffer (Bio-Rad) and heated at 95 °C for 10 min. Protein samples were subjected to WB assay for further analysis.
Analysis of EZH2 protein stability by cycloheximide (CHX) treatment
C4-2 cells were treated with BHB or vehicle for three days. Cell lysates were collected at specific times after CHX addition (10 μg/ml). Total cell lysates were blotted for EZH2 and H3, while β-actin served as a loading control. The amount of the EZH2 protein at the zero time in each group was considered as 1.
Chromatin immunoprecipitation (ChIP)-qPCR analysis
The ChIP experiment was performed using the SimpleChIP Plus Sonication ChIP kit (Cell Signaling Technology) with the procedure provided by the manufacturer. Cells were cross-linked using paraformaldehyde solution (Invitrogen) and terminated with glycine solution. A chromatin fragment at an average size of 200 bp was obtained by cell lysis and sonication using a Diagenode bioruptor. DNA was isolated from samples by incubation with the anti-H3K27me3 (Cell Signaling Technology, MA, USA) antibody at 4 °C overnight, followed by washing and reversal of crosslinking. ChIP-qPCR assay was performed to monitor the enrichment of H3K27me3 marks at 2 kb upstream of the promoter regions of HMGCS2 in vehicle control and GSK126-treated C4-2 cells. Four pairs of primers (F1 (transcription start site~−0.5 kb), F2 (−0.5 ~ −1.0 kb), F3 (−1.0 ~ −1.5 kb), F4 (−1.5 ~ −2.0 kb)) at different regions were used to amplify fragments inside the HMGCS2 promoter region. Primers are listed in Supplementary Table 2. Immunoprecipitated DNA was calculated as a percentage of input DNA.
Pull-down assay
First, BHB-conjugated beads were synthesized according to a previous literature [47]. Briefly, (S)-(+)-4-Amino-3-hydroxybutyric acid (Sigma) was dissolved in coupling buffer (0.2 M NaHCO3, 0.5 M NaCl, pH 8.3), and prewashed NHS-activated Sepharose beads (Cytiva, MA, USA) were mixed and incubated overnight at 4 °C. After blocked and washed three times, BHB-conjugated beads were used for pull-down assay with either cells or a recombinant protein.
C4-2 cells were washed with PBS and homogenized with a syringe in binding buffer. After centrifugation, the supernatant was loaded into BHB or vehicle (RPMI medium) conjugated Sepharose beads. After three times of washing, the samples were eluted with BHB containing elution buffer (0.1 M Tris-HCl, BHB 0.5 mM), followed by western blot.
Recombinant GST protein (Abcam) and GST-EZH2 (BPS Bioscience, CA, USA) protein were incubated with BHB-conjugated Sepharose beads for two hours at room temperature. After three times of washing, the samples were eluted with BHB-containing elution buffer, followed by western blot.
Immunohistochemistry (IHC) staining
Tumor tissues were harvested after the mice were sacrificed. Part of the tumor tissues were fixed in 10% neutral-buffered formalin, processed, and embedded in paraffin. Ki67 (1:800) staining was conducted using the Immunoperoxidase Secondary Detection System (EMD Millipore), followed by Hematoxylin counterstaining. Detection was developed by secondary antibodies (EMD Millipore) and visualized with microscopes. The primary antibody used for IHC was listed in Supplementary Table 1.
RNA-Seq and data analysis
Total RNAs were extracted using the RNeasy Plus Kit (QIAGEN) and sequenced by the DNBseq-PE100. The RNA-seq reads were mapped to the human genome GRCh38 and assigned to the reference genes using HISAT2 v2.1.0. Read counts for each gene were calculated by featureCounts v1.6.1 [48]. Differential gene expression analysis was performed between the two groups of cells by R packages edgeR and limma to determine the log2 fold change of each gene as the ranking metric [49, 50]. Adjusted P < = 0.05 was set up as a cutoff to define differential expressed genes (DEGs). GSEA (version 2.2.0) was used to analyze the BHB-altered gene signature from C4-2 cells treated with vehicle control and BHB or siControl and siEZH2. Hallmark gene signatures were used in the analysis, and the source data are provided with this paper. These results were used to determine overlapping hallmarks by creating Venn diagrams for both negative and positive enrichment scores [51]. For clustering analysis, we used a hierarchical clustering method with Spearman correlation distance to cluster samples based on the log-scaled FPKM. The data’s expression matrix was processed using the R software “Limma” for differential expression analysis. The significantly differentially expressed genes (DEGs) (|logFC| > 1, p-value < 0.05) were then visualized by a heatmap(“pheatmap”). GSK126, shEZH2_1/2, GSK126_con, shCTRL_1 data sets were used from GSE124268.
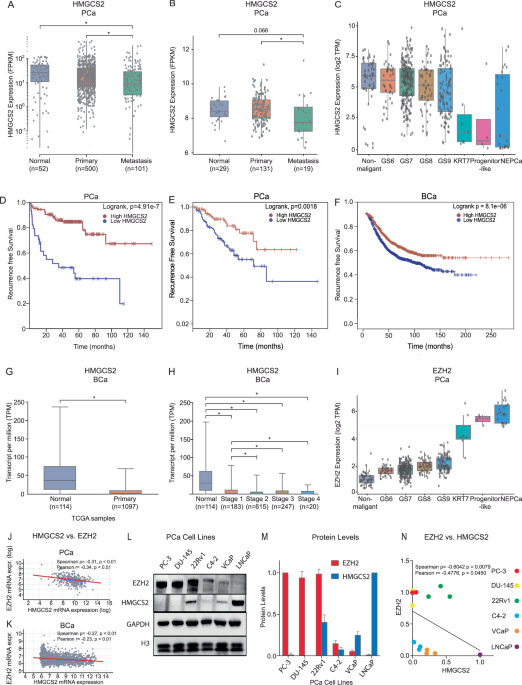
Bioinformatic analysis for public data
Normalized expression values of individual genes for PCa and BCa patients from the multiple cohorts were downloaded for analysis. TCGA-PRAD RNA-Seq data were downloaded from https://portal.gdc.cancer.gov. We obtained the RNA count from 101 metastatic PCa in the WC-SU2C cohort from the Genotypes and Phenotypes (dbGaP) database under accession code phs000915.v2.p2 [26]. RNA-seq data from Taylor et al. (GSE21032) [27] was downloaded from Gene Expression Omnibus (GEO). Data of Kaplan-Meier Survival Analysis were downloaded from https://betastasis.com, PCa, Taylor et al.) [27] and GEPIA (PCa, TCGA-PRAD) [52], and https://kmplot.com/analysis (BCa) [29]. EZH2 and HMGCS2 expression levels by scRNA-seq were obtained from https://pcatools.shinyapps.io/HuPSA-MoPSA/ [28]. Expression of HMGCS2 in BCa based on sample types and individual cancer stages was downloaded from https://ualcan.path.uab.edu/ [30, 31]. Co-expression plots of EZH2 and HMGCS2 in PCa (TCGA) [53] and BCa (METABRIC) [54, 55] were obtained from https://www.cbioportal.org.
Cell function assays
For the cell growth assay, cells were seeded in 96-well plates and treated with BHB and enzalutamide (or EPZ-6438), either alone or in combination, at concentration gradients for 72 h. Bioluminescence was measured to quantify cell viability using a CellTiter-Glo Luminescent Cell Viability Assay kit (Promega, WI, USA), and plates were read on a Tecan plate reader. Combination index (CI) values were calculated by Calcusyn (Biosoft, Ferguson, MO).
For the wound-healing assay, cells were cultured in a 35-mm dish with a 3-well culture insert (Ibidi) and grown to 90% confluency. After carefully removing the inserts, the dishes were refilled with serum-free RPMI 1640 medium and incubated in a humidified atmosphere at 37 °C. Images were captured under a microscope at the specified time points, and the percentage of wound closure was quantified using ImageJ software. Wound closure was calculated using the formula:
$$}\; }( \% )=[(}\; }\; }\; }\,0)-(}\; }\; }\; }\; })]/(}\; }\; }\; }\,0)\times 100.$$
For Boyden chamber migration assay, the migratory effect of PCa cells was assessed by their ability to pass through transwell inserts (Millipore). Cells diluted in 300 μl of serum-free RPMI medium were seeded into the upper compartments of the chambers. Meanwhile, the lower compartments of the chambers were filled with 900 μl of RPMI medium with 10% FBS. After 24 h, cells that had migrated to the lower surface of the chamber were fixed in methanol, stained with 0.1% crystal violet (Sigma), and subjected to microscopy inspection. The number of cells was expressed as the average number of cells counted in five random fields per filter.
Targeted metabolomics
After transfection of C4-2 cells with siEZH2 and siControl, the cells were harvested in 80% methanol. Cell lysates were incubated in -80 °C freezer for 5 mins and then vortexed 60 seconds at room temperature. Incubation and vortex steps were repeated two more times. Cell lysates were stored in -80 °C freezer for protein precipitation. After centrifugation, the supernatant was dried under nitrogen gas, and the pellets were used for protein analysis. Dried metabolites were reconstituted in 60% acetonitrile, and samples were analyzed by High-Performance Liquid Chromatography and Triple-quadruple Mass Spectrometry and Tandem Mass Spectrometry (HPLC-MS/MS). Specifically, the system consisted of a TSQ (Thermo) in line with an electrospray source (ESI) and a Vanquish (Thermo) UHPLC consisting of a binary pump, degasser, and auto-sampler outfitted with an XBridge C18 column (Waters, dimensions of 2.1 mm × 50 mm and a 3.5 μm particle size). Elution was at isocratic mode with mobile phase A (10 mM ammonium formate, 0.1% formic acid in water) and mobile phase B (acetonitrile) at A: B = 80: 20 (v/v) with 0.15 mL/min. In negative mode, the capillary of ESI source was set to 300 °C, with sheath gas at 35 arbitrary units, auxiliary gas at 3 arbitrary units and the spray voltage at 3 kV. A selective reaction monitoring (SRM) of the protonated precursor ion and the related product ion for BHB (m/z 103 → 59) was monitored. Peak area was integrated, and data acquisition and analysis were carried out by Xcalibur 4.1 software and TraceFinder 4.1 software, respectively (both from Thermo Fisher Scientific). The data were normalized to β-actin level of each sample.
Tumor xenograft and drug treatments
All procedures involving mice were performed in compliance with ethical regulations and with the approval of the Northwestern University Institutional Animal Care and Use Committee (IS00017714). Four-week-old NCG male mice were purchased from Charles River Laboratories and castrated. The LuCaP 35CR PDX was provided by E. Corey (University of Washington). One week later of castration, mice were implanted subcutaneously with LuCaP 35CR tumor bits. Mice were divided into treatment groups based on body weight when the tumor volume reached 100 mm3. The sample size for each group (n = 6) was chosen based on experimental feasibility and ethical considerations. Mice were given vehicle (PBS), 1:1 dilution of ketone drink with PBS, and no dilution of ketone drink (R-1,3-butanediol, H.V.M.N., 100 μl x twice by oral gavage daily). Blinding was not used in the animal studies. The tumor volume was measured with calipers using the formula (L*W*W/2). Tumor volume and body weight were measured twice weekly. After 42 days of treatments, mice were euthanized, tumors were excised, and weighed.
To evaluate the efficacy of the ketone drink and current drugs, pre-castrated male mice were anesthetized using 2% isoflurane (inhalation), and 3 × 10⁶ C4-2 cells were suspended in 100 μl of FBS with 50% Matrigel and implanted subcutaneously into the dorsal flank of the mice. When tumor volume reached 100 mm3, mice were randomly divided into six different groups and treated with 200 μl of vehicle control (0.5% Sodium carboxymethyl cellulose, 0.1% tween 80 in water), EPZ-6438 (200 mg/kg/day; 100 μl x twice by oral gavage daily), enzalutamide (10 mg/kg/day; 100 μl x twice by oral gavage daily), ketone drink (R-1,3-butanediol, H.V.M.N., 100 μl x twice by oral gavage daily) or in combination. Animals were treated by oral gavage on a weekly schedule of 5 days on, 2 days off. Tumor volume and body weight were measured weekly. After 28 days of treatments, mice were euthanized, tumors were excised, and weighed. Blood was obtained by a cardiac puncture when sacrificed. Serum was separated by centrifugation at 1,000 g for 10 min at 4 °C, and supernatant was transferred to −80 °C until BHB measurements. BHB was measured using a fluorescence assay kit (Cayman). The effects of drug treatment in suppressing target pathways were examined by IHC analysis.
Statistics and reproducibility
Statistical analysis was performed using GraphPad Prism (v.9.0) as described in the figure legends for each experiment. Data were presented as the mean ± s.e., and P values were determined by unpaired two-tailed t test. Significance was set at P < 0.05. No statistical methods were used to predetermine sample sizes, but our sample sizes are similar to those reported in previous studies. The results were reproducible and conducted with established internal controls. When feasible, experiments were repeated three or more times and yielded similar results. All samples that met proper experimental conditions were included in the analysis.

Comments (0)