
Remember me
First, we extracted EVs derived from HGC-27 and AGS cells (gcEVs), which were consistent with EV characterization (Fig. S1) according to previous studies [19]. Subsequently, gcEVs were treated with 10% trypsin to remove membrane proteins while preserving the phospholipid structure of the cell membrane. Nanoparticle tracking analysis (NTA) confirmed that enzymatic treatment did not significantly alter particle size distribution. However, treatment with 2% SDS completely disrupted the phospholipid bilayer, leading to significant changes in particle size (Fig. 1A, B).
Fig. 1: Protein components in gcEVs affected endothelial cell permeability.
A Phosphotungstic acid-negative staining TEM images of gcEVs treated with trypsin or SDS (bar = 0.5 μm, yellow arrow: EVs). B Nanoparticle tracking analysis (NTA) of EV size distribution. EVs treated with different conditions were co-incubated with HUVECs of confluent monolayers for 24 h. Untreated EVs were used as the Control. C Transendothelial electrical resistance (TEER) was measured (n = 9, one-way ANOVA). D FITC-dextran permeability assay to detect the fluorescence intensity of FITC-dextran diffusing to the lower chamber (n = 5, one-way ANOVA). Untreated EVs were used as the Control, and untreated HUVECs as the Blank control. ns, not statistically significant, ***p < 0.001.
Next, we assessed the effects of different components of gcEVs on the endothelial permeability by TEER and FITC-dextran permeability assays. The transendothelial resistance value of gcEVs in the trypsin-treated group was statistically higher than that in the control(untreated EVs) or SDS-treated group (p < 0.001) (Fig. 1C). The higher the resistance value, the lower the permeability. FITC-dextran permeability measurement showed that the fluorescence intensity of the lower chamber in the trypsin-treated group was remarkably weaker than that in the control (untreated EVs) or SDS-treated group over 24 h following the treatment of monolayer endothelial cells (p < 0.001) (Fig. 1D). These data indicate that the effect of gcEVs on endothelial permeability is significantly attenuated by removing the protein component of EVs, suggesting that the membrane proteins of EVs play a key role in regulating endothelial barrier function.
CD147 as one of the major effectors mediating the biological functions of gcEVsThe results of Fig. 1 demonstrate clearly that membrane proteins are the main effector molecules of EVs to increase the permeability of the endothelial barrier. Therefore, we conducted proteomic analysis of the EVs derived from HGC-27 cells to find the main effector protein of EVs. A total of 5001 proteins were identified by mass spectrometry, of which 2185 proteins were able to be quantified (Supplementary Table 1). Principal component analysis (PCA) of the proteins from all samples revealed good clustering of both HGC-27 cells and HGC-27 -derived EVs (PC1 = 70.5%, PC2 = 11.4%), indicating a good repeatability of the experiments (Fig. 2A). Compared with HGC-27 cells, 246 proteins were significantly upregulated and 423 proteins were downregulated in HGC-27-derived EVs. Some of the differentially upregulated proteins have been highlighted in the volcano plot. (Fig. 2B). We performed GO enrichment analysis on differentially expressed proteins in HGC-27 cells and HGC27-derived EVs, revealing the characteristics of these differentially expressed proteins in biological processes (BP), cellular components (CC), and molecular functions (MF) (Fig. 2C).
Fig. 2: Proteomic analysis of HGC-27 cells and HGC-27-derived EVs.
A Principal component analysis (PCA) of differentially expressed proteins in HGC-27 cells and HGC-27-derived EVs. B The volcano plot visualized the differential expression of identified proteins in HGC-27 cells and HGC-27-derived EVs (red dots indicate significantly upregulated proteins, blue dots represent significantly downregulated proteins, and gray dots indicate non-significant proteins). C Gene Ontology (GO) enrichment analysis of the differentially expressed proteins, categorized into biological process (BP), cellular component (CC), and molecular function (MF) (fold change >2, p < 0.05). D Venn diagram showing the overlapping proteins that are upregulated in the GO analysis across BP, CC, and MF categories (Fold change >2, p < 0.05). E Bar plot displaying the top 10 enriched CC terms ranked by statistical significance (−log10 (p value)). F Network map illustrating the relationship between upregulated proteins and their associated CC terms. G Bubble plot of the enriched top 10 CC terms, where color intensity represents p value and bubble size indicates protein count. H Interaction network of top 10 upregulated CC terms. Node size corresponds to the number of enriched proteins (larger circles indicate more proteins). Node color indicates the significance level (−log10 transformed p value, darker red indicates greater significance). Gray edges represent functional relationships, with edge width proportional to shared gene counts. The network was constructed using Cytoscape (v3.9.1), with FDR < 0.05 as the significance threshold.
To further identify specific regulatory proteins in HGC-27-derived EVs, we performed a more in-depth GO analysis of 246 upregulated proteins. The Venn diagram revealed 35 overlapping proteins across the three GO categories of BP, CC and MF, and the BSG gene (CD147) was found among both the differentially upregulated proteins and the overlapping sets in all three classes (Fig. 2D). Subsequently, we analyzed the top ten BP terms and associated protein counts, indicating that upregulated proteins were primarily involved in regulating cell morphology, with network analysis confirming that the upregulated BSG gene played a role in regulating cell morphology (Fig. S2). Analysis of the top ten CC terms and associated protein counts revealed that upregulated proteins are predominantly involved in focal adhesion and cell-matrix attachment regulation (Fig. 2E, G), with network analysis confirming the role of the BSG gene in focal adhesion and cell–matrix attachment regulation (Fig. 2F, H). KEGG pathway enrichment analysis of GO molecular function-upregulated proteins in HGC-27-derived EVs identified the top enriched pathways, including regulation of actin cytoskeleton, alongside pathways related to viral infection and cancer. Notably, network analysis confirmed the involvement of the BSG gene in cytoskeletal regulation, highlighting its potential role in modulating cellular architecture and metastatic processes (Fig. S3).
We subsequently verified the expression of CD147 in gcEVs and found that CD147 was significantly highly expressed in EVs derived from HGC-27 and AGS cells, with fold changes of 12.27 and 15.36, respectively (Fig. S4A). Therefore, we selected CD147 for further investigation.
CD147-high gcEVs promote tumor cell transendothelial migration and metastasisTo investigate the biological effects of CD147-gcEVs, we employed lentiviral transduction to knock down CD147 expression in HGC-27 and AGS cells, with mRNA and protein inhibition efficiencies of over 65%, 71% and 66%, 76%, respectively (Fig. S4B–D). The levels of CD147 in the gcEVs extracted from CD147-knockdown cells were significantly reduced (Fig. 3A–C).
Fig. 3: CD147-high gcEVs disrupted the vascular endothelial barrier and promoted tumor cell transendothelial migration and metastasis.
A Western blot analysis of CD147 levels in EVs. Mock EVs (derived from untreated cells), shNC EVs (derived from cells transfected with non-targeting shRNA), and shCD147 EVs (derived from cells transfected with CD147-targeting shRNA). B Quantification of CD147 expression (n = 3, one-way ANOVA). C Flow cytometry analysis of CD147 levels in EVs from transfected cells. D Transendothelial migration assay: HUVECs were cultured to confluence and treated with different groups, followed by co-culture with PKH-26-labeled HGC-27 cells (1 × 10⁵) for 24 h. The number of migrating HGC-27 cells in the lower chamber was quantified using fluorescence microscopy. E Statistical analysis of tumor cell transendothelial migration (n = 3, one-way ANOVA). F Detection of Evans blue dye leakage into lung parenchyma in mice treated with different groups (n = 3, one-way ANOVA). G Representative H&E-stained lung sections from mice subjected to the three treatments (bar = 100 μm; asterisk: perivascular space, arrow: alveolar exudate). H H&E-stained sections of lungs and liver from different treatment groups (bar = 1000 μm; arrow: tumor tissue). I Analysis of cancerous regions in lung and liver tissues. *p < 0.05, **p < 0.01, ***p < 0.001.
We then completed a transendothelial assay to observe the migration of GC cells. The results displayed that CD147-high gcEVs significantly promoted transendothelial migration of GC cells, whereas CD147-knockdown gcEVs suppressed this effect (p < 0.001) (Fig. 3D, E). We found that CD147-high gcEVs significantly increased vascular leakage in mouse lungs through the Evans blue extravasation assays, whereas CD147-knockdown gcEVs reduced this effect (Fig. 3F). Mouse lung histopathology also showed that CD147-high gcEVs increased vascular permeability significantly, manifested by expanded perivascular spaces and alveolar spaces filled with exudative plasma proteins (Fig. 3G). Mouse transfer model confirmed that CD147-high gcEVs significantly increased the area of GC metastases in the lungs and liver of mice, whereas CD147-knockdown gcEVs significantly reduced the formation of metastatic lesions (Fig. 3H, I). These results indicate that CD147-high gcEVs have an effect on increasing endothelial barrier permeability, thus promoting the transendothelial migration and organ metastasis of GC cells.
CD147-high gcEVs disrupted endothelial barrier integrity by cytoskeletal reorganization and VE-cadherin internalizationTo investigate the effect of CD147-high gcEVs on endothelial barrier, the CD147-high or CD147-knockdown gcEVs were incubated with HUVECs at 37 °C for 24 h, and the changes in HUVEC permeability were observed by measuring TEER and dextran permeability through the endothelium.
The results demonstrated that CD147-high gcEVs markedly decreased the monolayer resistance value of endothelial cells and increased dextran leakage through the endothelium. In contrast, CD147-knockdown gcEVs significantly attenuated the endothelial barrier disruption (p < 0.001 vs. shNC EVs), with preserved monolayer resistance and reduced dextran permeability. Although CD147 recombinant protein also enhances the permeability of the endothelial barrier, it is not as effective as CD147-high gcEVs (Fig. 4A, B).
Fig. 4: CD147-high gcEVs affected endothelial barrier permeability by inducing cytoskeletal rearrangement and VE-cadherin internalization.
A Transendothelial electrical resistance (TEER) measurement in permeability of HUVECs treated with Mock EVs, shNC EVs, shCD147 EVs, PBS, or recombinant CD147 protein at different time points (n = 3, one-way ANOVA). B Permeability assay in confluent HUVECs treated with Mock EVs, shNC EVs, shCD147 EVs, PBS, or recombinant CD147 protein for 24 h; FITC-dextran was added to the upper chamber, and the fluorescence intensity in the lower chamber was measured after 24 h (n = 3, one-way ANOVA, vs. shNC). C Confocal microscopy images of endothelial cells treated with different gcEVs or PBS for 24 h, showing F-actin distribution (green: F-actin, blue: nucleus, red: gcEVs, bar = 20 μm). D Confocal microscopy images displaying VE-cadherin localization in HUVECs treated with different gcEVs or PBS for 24 h (red: VE-cadherin, blue: nucleus, bar = 20 μm). E Quantification of the colocalization coefficient of VE-cadherin with the nucleus (n = 3, one-way ANOVA). ***p < 0.001.
We investigated the mechanism of increasing endothelial permeability by CD147-high gcEVs on endothelial permeability from two perspectives. On the one hand, HUVECs were co-incubated with gcEVs and observed for 12 h continuously under a laser confocal microscope. It was found that CD147-high gcEVs were gradually endocytosed by HUVECs, and the number of gcEVs uptaken increased in a time-dependent manner (Fig. S5). At the same time, we assessed the impact of gcEVs on the endothelial cytoskeleton. In the control group, F-actin fibers were organized parallel to the long axis of the endothelial cells. However, treatment with CD147-high gcEVs disrupted this arrangement, leading to diffuse and fragmented F-actin fibers. In contrast, HUVECs treated with CD147-knockdown gcEVs maintained predominantly elongated F-actin fibers, with reduced cytoskeletal deformation (Fig. 4C).
On the other hand, we detected changes in endothelial cell adhesion molecules. VE-cadherin plays crucial functions in adhesion junctions between endothelial cells and in maintaining the vascular integrity and permeability [23]. We found that HUVECs treated with CD147-high gcEVs exhibited significant internalization of VE-cadherin, whereas CD147-knockdown gcEVs markedly inhibited this phenomenon (Fig. 4D, E). These results remind us that endocytosis of CD147-high gcEVs by endothelial cells leads to cytoskeleton rearrangement and cell contraction, reducing intercellular adhesion, and enlarging the intercellular space and endothelial barrier permeability.
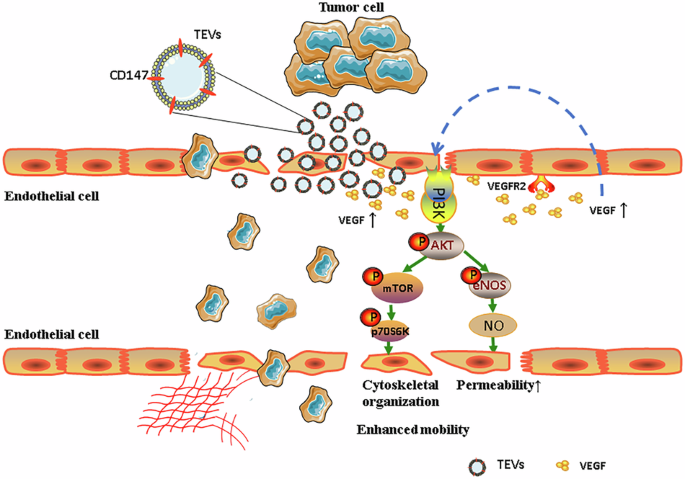
CD147-high gcEVs exert effects via VEGF/AKT/eNOS/NO and AKT/mTOR pathwaysTo investigate signaling pathways potentially involved in CD147-high gcEV function, we mapped MF-upregulated proteins to KEGG reference pathways using KEGG Mapper. This analysis revealed that these proteins were mapped to the GC pathway and the PI3K-AKT signaling pathway, highlighting key regulators such as mTOR, S6K, AKT, and eNOS (Fig. S6). Given the known roles of these pathways in vascular permeability and tumor progression, we further explored their functional relevance in CD147-high gcEVs.
To further validate these findings, we analyzed correlations in the TCGA database and found a positive association between BSG (CD147), VEGFA, AKT1, and AKT2 (Fig. 5A). We then evaluated protein–protein interactions using the STITCH and STRING databases, which demonstrated prominent interactions between BSG (CD147) and key signaling molecules, such as VEGF, AKT, eNOS, mTOR, and VE-cadherin (Fig. 5B, C), thereby supporting the involvement of these pathways.
Fig. 5: CD147-high gcEVs regulated endothelial cell function via the VEGF/AKT/eNOS/NO and AKT/mTOR pathways.
A Correlation analysis of BSG (CD147) with VEGFA, and BSG (CD147) with AKT1, as well as VEGFA with AKT1 and AKT2 in GC tissues based on the TCGA database. B STITCH database analysis of protein-protein interactions, with line thickness indicating the strength of data support (thicker lines represent stronger reliability). C STRING database analysis illustrating the protein–protein interaction network. D Western blot analysis of VEGF, p-AKT, AKT, p-eNOS, p-mTOR, mTOR, p-p70S6K, and p70S6K expression in HUVECs treated with different gcEVs, PBS, or recombinant CD147 protein for 24 h, and E quantitative analysis (n = 3, one-way ANOVA). F Measurement of NO levels in the culture supernatant of HUVECs co-incubated with different EVs or PBS for 24 h (n = 3, one-way ANOVA). *p < 0.05, **p < 0.01, ***p < 0.001, vs shNC.
Subsequent experimental validation was performed in HUVECs. Western blot analysis showed that treatment with CD147-high gcEVs markedly increased the expression of VEGF, p-AKT, p-eNOS, p-mTOR, and p-p70S6K and promoted the release of NO. On the contrary, CD147- knockdown gcEVs significantly reduced the expression of these proteins as well as NO release (Fig. 5D–F). The AKT inhibitor MK2206 inhibited the activation of p-AKT, p-eNOS, and p-mTOR proteins and NO release by CD147-high gcEVs, whereas the AKT agonist SC79 reversed the inhibition of these proteins’ expression and NO release by CD147-knockdown gcEVs (Fig. S7A–C). Rapamycin, an mTOR inhibitor, suppressed p-p70S6K activation by CD147-high gcEVs (Fig. S7D, E).
MK2206 and SC79 were further used to validate the effect of the AKT pathway on the endothelial barrier by CD147-high gcEVs. The results suggested that MK2206 reversed the CD147-high gcEVs induced promotion of endothelial cell permeability, tumor cell transendothelial migration, cytoskeletal rearrangement, and internalization of VE-cadherin, whereas SC79 reverted the inhibitory effect of CD147-knockdown gcEVs (Figs. S8 and S9). CD147-high gcEVs induced diffuse and fragmented F-actin fibers, which were restored to a more organized state upon rapamycin treatment. Similarly, VE-cadherin internalization induced by CD147-high gcEVs was markedly reduced in the presence of rapamycin, as evidenced by increased membrane localization of VE-cadherin (Fig. S10).
CD147 used as a marker for diagnosis and poor prognosis of GCTCGA database was analyzed and revealed that the expression of CD147 mRNA in GC tissues was significantly higher compared to normal tissues (Fig. 6A). Also, the expression of CD147 mRNA in GC samples with different pathological stages was higher than that in normal tissues (Fig. 6B). Further, we collected cancer and para-cancer tissues of 53 patients with GC and confirmed that the expression of CD147 mRNA in cancer tissues was markedly higher than that in para-cancer tissues (p < 0.01; Fig. 6C). The clinical correlation analysis illustrated that high expression of CD147 mRNA was significantly associated with N stage (p = 0.021), lymph node metastasis (p = 0.008), and differentiation degrees (p = 0.035) (Supplementary Table S2). Immunohistochemistry staining verified that CD147 was mainly localized in the epithelial cell membranes, and the intensity was higher in cancer tissues than in para-cancer tissues (Fig. 6D).
Fig. 6: CD147 expression in gastric cancer patients demonstrates diagnostic potential and correlates with poor prognosis.
A CD147 mRNA expression levels in gastric cancer (GC) tissues (n = 375) and normal tissues (n = 32) based on the TCGA database. B CD147 mRNA expression in GC patients at different T stages compared to normal tissues (TCGA database). C Relative CD147 mRNA expression in 53 GC tissues and paired adjacent normal tissues (n = 3, t test). D Immunohistochemical staining of CD147 in gastric cancer and adjacent normal tissues. (1, 4) Adjacent normal tissues, (2, 3, 5–9) Gastric cancer tissues (red arrows: cancerous tissues, blue arrows: normal mucosal glands adjacent to cancerous tissues, bar = 50 μm). E Flow cytometric analysis of CD147-positive EVs in plasma from GC patients (n = 67) and healthy subjects (n = 34). F CD147 expression across different T stages; G N stages; H M stages; and I differentiation grades. J ROC curve for CD147 mRNA expression in gastric tissues (TCGA database, GC n = 375, normal n = 32), AUC = 0.789. K ROC curve for CD147 expression in plasma EVs (GC patients n = 67, healthy subjects n = 34), AUC = 0.984. Kaplan–Meier analysis of CD147 expression and patient survival in GC patients. L–N Kaplan–Meier survival analysis of CD147 expression in GC patients: L overall survival (OS), M first progression (FP), and N post-progression survival (PPS). O, P Forest plots of univariate (O) and multivariate (P) Cox proportional hazards regression models. *p < 0.05, **p < 0.01, ***p < 0.001.
In addition, we analyzed the expression of CD147 in plasma EVs from 67 GC patients and 34 healthy volunteers. The results exhibited that the positivity rate of CD147 in plasma EVs was significantly higher in GC patients than that in healthy controls (Fig. 6E), with notable differences across T stages (Fig. 6F), N stages (Fig. 6G), M stages (Fig. 6H), and varying differentiation levels in GC patients (Fig. 6I) (p < 0.05). To evaluate the clinical significance of CD147+ EVs in plasma, we stratified patients into high-CD147+ EVs and low-CD147+ EVs groups based on the median positivity rate of CD147 in plasma EVs. Elevated CD147+ EVs levels were significantly associated with advanced T stage, nodal metastasis, distant metastasis, higher pathological stage, increased lymphatic invasion, and poor differentiation(Table 1).
Table 1 Correlation between plasma extracellular vesicle CD147 expression and clinicopathological characteristics of gastric cancer patients.Receiver operating characteristic analysis demonstrated that the expression levels of CD147 mRNA in gastric tissue (healthy = 32, GC = 375) from the TCGA database indicated moderate diagnostic accuracy for GC (AUC = 0.789) (Fig. 6J), while CD147 protein levels in plasma EVs (healthy = 34, GC = 67) exhibited higher diagnostic accuracy (AUC = 0.984, Fig. 6K). Kaplan–Meier analysis demonstrated that CD147-high gastric adenocarcinoma patients had significantly worse overall survival, faster disease progression, and reduced post-progression survival compared to CD147-low counterparts (all log-rank p < 0.001; Fig. 6L–N). Cox proportional hazards regression identified high CD147 expression in plasma EVs, lymph node metastasis, CA199, CEA, T stage, and differentiation status as independent predictors of poor prognosis in GC patients (p < 0.05; Fig. 6O). Multivariate analysis further confirmed that CD147 levels in plasma EVs, T stage, differentiation status, and CEA were significantly associated with poor prognosis (p < 0.05; Fig. 6P). High expression of CD147 in GC tissues and plasma EVs correlates with tumor progression and poor prognosis and shows promise as a diagnostic and prognostic biomarker for GC.
Comments (0)