
Remember me
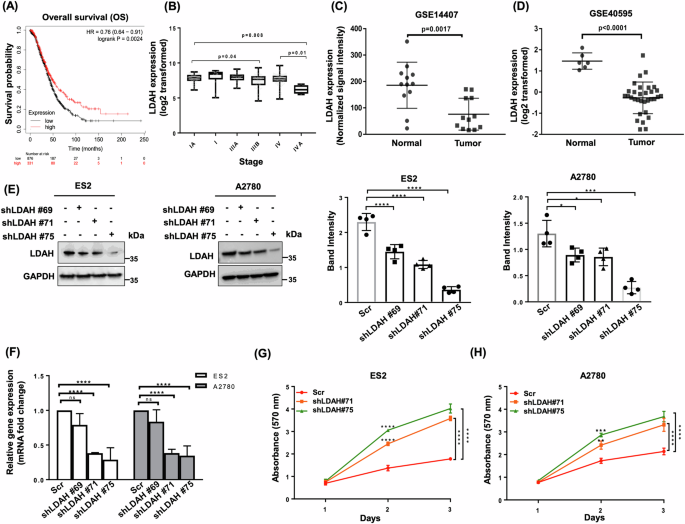
To determine the clinical significance of LDAH in ovarian cancer patients, we analyzed the correlation between LDAH expression and survival outcomes of 1207 ovarian cancer patients using Kaplan–Meier Plotter. We found that ovarian cancer patients with low levels of LDAH showed shorter overall survival (OS; HR = 0.76 (0.64–0.91), log-rank P = 0.0024) (Fig. 1A) and shorter progression free survival after platinum-based chemotherapy (PFS; HR = 0.74 (0.56–0.97), log-rank P = 0.031) (Supplementary Fig. 1A). We also found that LDAH expression was significantly decreased in advanced stage ovarian cancer (Fig. 1B). Analysis of GEO datasets (GSE14407, GSE40595, GSE115939) revealed that LDAH mRNA expression levels were significantly lower in ovarian cancer tissues than in normal ovary tissues (Fig. 1C, D, Supplementary Fig. 1B).
Fig. 1: Low LDAH levels are associated with poor prognosis in ovarian cancer.
A Kaplan-Meier survival curve of overall survival (OS) in 1207 serous ovarian cancer patients based on LDAH expression. Red indicates high LDAH expression. B Expression of LDAH in different stages of ovarian cancer (Stage IA, I, IIIA, IIIB, IV, IVA) in the GENT2 database. N = 272. Histological subtypes of samples are shown in Supplementary Table 3. C, D LDAH mRNA expression level in ovarian cancer and normal ovarian tissue of GEO datasets GSE14407 (normal vs serous ovarian cancer) (C) and GSE40595 (normal vs high grade serous ovarian cancer) (D). Students’s T-test. E Western blot of LDAH in scrambled control (Scr) and LDAH knockdown (ShLDAH#69, #71, #75) ES2 and A2780 cells. The quantification of band intensity normalized to GAPDH is shown on the right. One-way ANOVA followed by Tukey’s multiple test. F mRNA expression of LDAH in scrambled control (Scr) or LDAH knockdown (ShLDAH#69, #71, #75) ES2 and A2780 cells. Y axis, fold change compared to scrambled control. N = 3. Two-way ANOVA followed by Tukey’s test. The effect of LDAH knockdown (shLDAH#71, #75) on proliferation in ES2 (G) and A2780 cells (H) determined by MTT assay. N = 3. Student’s T-test. Error bars, SD. **, p < 0.01, ***, p < 0.001. ****, p < 0.0001.
To determine the effect of LDAH downregulation in ovarian cancer cells, we performed stable gene knockdown of LDAH using shRNA (shLDAH#69, shLDAH#71, and shLDAH#75) in ES2 and A2780 human ovarian cancer cell lines. The efficiency of LDAH knockdown was validated by western blotting and real-time PCR (Fig. 1E, F). The gene knockdown efficiency of shLDAH#75 was higher than shLDAH#69 and shLDAH#71 in ES2 and A2780 cells (Fig. 1E). Next, we determined the effect of LDAH knockdown (shLDAH#71, #75) on proliferation in ES2 and A2780 ovarian cancer cells and found that, compared to scrambled control, LDAH knockdown increased the proliferation of both cell lines (Fig. 1G, H). Collectively, our results showed that low LDAH expression was associated with poor prognosis in ovarian cancer patients, and LDAH downregulation promoted ovarian cancer cell proliferation.
LDAH knockdown promotes cisplatin resistance in ovarian cancer cellsSince low levels of LDAH are associated with shorter progression free survival (PFS) after platinum-based chemotherapy (Supplementary Fig. 1A), we sought to determine the effect of LDAH knockdown on cisplatin resistance. Our western blotting data showed that LDAH knockdown significantly decreased levels of cleaved caspase 3 after 16 µM cisplatin treatment compared to scrambled control in ES2 and A2780 cells (Fig. 2A, B). Similarly, MTT assay showed increased viability in LDAH knockdown ES2 and A2780 cells compared to scrambled control cells, both under basal conditions and under cisplatin treatment (Fig. 2C, D, Supplementary Fig. 2A, B). Consistently, Annexin V/7-AAD staining showed decreased percentages of apoptotic cells in LDAH knockdown ES2 and A2780 cells upon cisplatin treatment (Fig. 2E), indicating increased chemoresistance in LDAH knockdown cancer cells.
Fig. 2: LDAH knockdown promotes ovarian cancer cell proliferation and chemoresistance.
Western blot of LDAH in scrambled control or LDAH knockdown (shLDAH #69, #71 and #75) ES2 (A) and A2780 (B) ovarian cancer cell lines. The quantification of band intensity normalized to GAPDH is shown below. Two-way ANOVA followed by Tukey’s multiple comparison test. MTT assay to measure the effect of LDAH knockdown on proliferation in ES2 (C) and A2780 (D) cancer cells with or without cisplatin treatment. N = 3. Student’s T-test. E Annexin V/7-AAD apoptosis analysis of scrambled control or LDAH knockdown ES2 and A2780 cancer cells after cisplatin treatment. N = 3. Student’s T-test. F Representative images of excised tumors from xenograft mouse models. G Volume of excised tumors from (F). One-way ANOVA followed by Tukey’s multiple comparison test. Error bars, SD. *, p < 0.05, **, p < 0.01, ***, p < 0.001. ****, p < 0.0001. ns, not significant.
To further investigate the role of LDAH in chemoresistance in vivo, we established a xenograft model. We injected scrambled or LDAH-knockdown ES2 ovarian cancer cells subcutaneously into female nude mice. After palpable tumors were formed, mice were injected intraperitoneally with saline (vehicle) or 3 mg/kg cisplatin three times a week for 2 weeks (Fig. 2F; Supplementary Fig. 2C). In untreated mice, LDAH knockdown significantly increased tumor volume (Fig. 2F, G). Interestingly, LDAH knockdown also conferred resistance to cisplatin treatment, and while cisplatin significantly reduced the volume of scrambled tumors, it did not significantly affect the growth of tumors with LDAH knockdown (Fig. 2F, G). Taken together, our in vitro and in vivo studies suggest that LDAH knockdown enhances the viability of ovarian cancer cells and impacts their response to cisplatin treatment. Next, we sought to investigate the mechanisms.
LDAH knockdown inhibits ER stress-mediated apoptosis in ovarian cancer cellsLDAH is reported to be localized in the cytoplasm in close association with the endoplasmic reticulum (ER) in HEK293 cells in standard culture conditions [12]. To determine the localization of LDAH in ovarian cancer cells, we co-transfected ES2 cells with the ER marker DsRed2-ER5 [18] and LDAH-GFP [12]. Our results showed co-localization of LDAH-GFP and DsRed2-ER5 (Fig. 3A), suggesting LDAH expression in the ER of ovarian cancer cells. Since ER stress can promote apoptosis of tumor cells, we examined the effect of LDAH knockdown on ER stress. Western blotting data showed that LDAH knockdown ES2 and A2780 cancer cells had decreased expression of the ER stress markers (Ero1a, IREI, PERK, PDI) than scrambled control cells, with and without cisplatin treatment (Fig. 3B, Supplementary Fig. 3A). Similarly, immunofluorescence and western blotting data showed decreased PDI and CHOP in LDAH knockdown ES2 and A2780 cells with and without cisplatin treatment as compared to scrambled control cells (Fig. 3C, Supplementary Fig. 3B–D). These data suggests that LDAH knockdown inhibits ER stress in ovarian cancer cells.
Fig. 3: LDAH knockdown inhibits ER stress-mediated apoptosis in ovarian cancer cells.
A Immunofluorescence images of DsRed2-ER5 (red) in LDAH-GFP expressing ES2 cells. Blue, DAPI. Scale bars, 20 µm. B Western blot of ER stress markers (Ero 1a, IREI, PDI, PERK) in scrambled control and LDAH knockdown ES2 cells, with or without cisplatin treatment. The quantification of band intensity normalized to GAPDH is shown on the right. Two-way ANOVA followed by Tukey’s multiple comparison test. C Immunofluorescence images of PDI (red) in scrambled control and LDAH knockdown ES2, with or without cisplatin treatment. Blue, DAPI. Scale bars, 50 µm. D Western blot of Bak1 in scrambled control and LDAH knockdown ES2cells, with or without cisplatin treatment. The quantification of band intensity normalized to GAPDH is shown on the right. One-way ANOVA followed by Tukey’s multiple comparison test. E, F qPCR analysis showing mRNA expression of Bak1 (E; pro-apoptotic) and BIRC2 (F; anti-apoptotic) in scrambled control and LDAH knockdown ES2, with and without cisplatin treatment. One-way ANOVA followed by Tukey’s multiple comparison test. G Immunofluorescence images of LDAH and PERK in scrambled control and LDAH overexpressing ES2 cancer cells. Scale bars, 20 µm. Quantification of PERK signal is shown on the right. Student’s T-test. H Western blot of cleaved caspase 3, p-PERK, PERK, and LDAH in scrambled and LDAH overexpressing cells after treatment with vehicle, cisplatin alone, or in combination with a PERK inhibitor GSK2606414. GAPDH, a loading control. The quantification of band intensity normalized to GAPDH is shown on the right. One-way ANOVA followed by Tukey’s multiple comparison test. I mRNA expression level of Bak1 (pro-apoptosis) in LDAH overexpressing cells after treatment with vehicle, cisplatin alone or combination of in combination with a PERK inhibitor GSK2606414. One-way ANOVA followed by Tukey’s multiple comparison test. Error bars, SD. *, p < 0.05, **, p < 0.01, ***, p < 0.001. ****, p < 0.0001. ns, not significant.
To further investigate the impact of LDAH knockdown in apoptosis, we measured the expression levels of pro-apoptotic (BAK1) and anti-apoptotic (BIRC2) proteins in scrambled and LDAH knockdown cells. The protein levels of the BAK1 were lower in LDAH knockdown ES2 and A2780 cancer cells than in scrambled controls, with and without cisplatin treatment (Fig. 3D, Supplementary Fig. 3E). qPCR analyses also showed lower BAK1 and higher BIRC2 mRNA levels in LDAH knockdown in ES2 and A2780 cells, with and without cisplatin treatment (Fig. 3E, F, Supplementary Fig. 3F, G).
Based on the results under LDAH knockdown, we asked whether LDAH upregulation would enhance cisplatin-induced apoptosis through increasing ER stress. We overexpressed LDAH in ES2 cells and found that LDAH overexpression significantly increased the immunofluorescence intensity of an ER stress marker PERK (Fig. 3G, Supplementary Fig. 3H). Next, we treated LDAH overexpressing ES2 cells with cisplatin alone or in combination with a PERK inhibitor GSK260641,4 and measured the levels of p-PERK and cleaved caspase 3. Compared to scrambled cells, LDAH-overexpressing ES2 cancer cells showed a marked increase in cleaved caspase 3 after cisplatin treatment, which was attenuated by GSK2606414 (Fig. 3H). Similarly, LDAH overexpressing ES2 cells showed increased BAK1 mRNA levels upon cisplatin treatment, which was also abrogated by GSK2602414 treatment (Fig. 3I). Altogether, studies on LDAH downregulation and overexpression suggest that LDAH knockdown mitigates ER stress and increases resistance to cisplatin-induced apoptosis.
LDAH knockdown increases TAG hydrolysis in ovarian cancer cellsOvarian cancer cells often upregulate de novo fatty acid synthesis and store excess fatty acids in the form of triglyceride (TAG) in lipid droplets (LDs) [10, 11, 19,20,21]. Since LDAH enhances LD accumulation in HEK293 cells loaded with oleic acid [12], we asked if LD formation was altered in scrambled, LDAH overexpressing, and LDAH knockdown ovarian cancer cells. Similar to the results from HEK293 cells [12], we observed that, compared to controls, LDAH overexpression and knockdown in ES2 cells resulted in accumulation of larger and smaller LDs, respectively (Fig. 4A, Supplementary Fig. 4A). Consistently, LDAH knockdown cancer cells showed decreased TAG levels while LDAH overexpressing cancer cells showed increased TAG levels than scrambled control (Fig. 4B).
Fig. 4: LDAH knockdown increases TAG hydrolysis in ovarian cancer cells.
A BODIPY 493/503 staining (green) of lipid droplets in scrambled, LDAH knockdown (shLDAH), and LDAH overexpressing (OE) ES2 cancer cells. Blue, DAPI. Scale bars, 10 µm. Quantification of BODIPY signals is shown on the right. One-way ANOVA followed by Tukey’s multiple comparison test. B TAG levels (mg/dl) in scrambled, LDAH knockdown (shLDAH), and LDAH overexpressing (OE) ES2 cancer cells. One-way ANOVA followed by Tukey’s multiple comparison test. Western blot of CPT1A in scrambled control and LDAH knockdown ES2 (C) and A2780 (D) cancer cells with or without cisplatin treatment. The quantification of band intensity normalized to GAPDH is shown below. One-way ANOVA followed by Tukey’s multiple comparison test. Western blot of p-NF-kB and total NF-kB in scrambled control and LDAH knockdown ES2 (E) and A2780 (F) cancer cells with or without cisplatin treatment. The quantification of band intensity normalized to GAPDH is shown below. One-way ANOVA followed by Tukey’s multiple comparison test. Error bars, SD. *, p < 0.05, **, p < 0.01, ***, p < 0.001, ****, p < 0.0001.
The differences in LD size and TAG content in LDAH knockdown cells could be due to changes in TAG biogenesis, hydrolysis, or both. To address this question, we synchronized ES2 scrambled or shLDAH cancer cells by incubating them with charcoal stripped lipid-free medium for 24 h, followed by treatment with Triacsin C, an inhibitor of TAG synthesis. After 16 h of treatment with Triascin C, we incubated the cells with lipid-containing FBS medium, and cells were collected and fixed at different time points (4 h, 8 h, 12 h, 24 h) for BODIPY staining and TAG analysis. Our results showed no difference in BODIPY staining and TAG level (mg/dl) up to 12 h. We observed a significant decrease in BODIPY staining and TAG levels in shLDAH cells after 24 h (Supplementary Fig. 4B, C). Furthermore, western blotting data showed no difference in expression of diacylglycerol O-acyltransferase 1 (DGAT1; a key enzyme involved in TAG biogenesis) in Scr and shLDAH cells in ES2 and A2780 cell lines (Supplementary Fig. 4D). These results suggest that LDAH does not affect TAG biogenesis, and reduced size of LDs in shLDAH cancer cells is due to increased TAG hydrolysis.
Based on this reduction in TAG levels, we speculated that LDAH could affect fatty acid oxidation (FAO), a major metabolic pathway that breaks down free fatty acids and helps cancer cells meet their energetic and metabolic needs [9]. Consistent with decreased TAG levels, the expression of CPT1A, a rate-limiting enzyme of FAO, was increased in LDAH knockdown ES2 and A2780 cells compared to scrambled cells (Fig. 4C, D). When TAGs are hydrolyzed to free fatty acids, it can trigger the activation of NF-κB, a crucial transcription factor which promotes tumor growth and chemoresistance [22]. Our results showed increased p-NF-kB (indicative of NF-kB activation) in LDAH knockdown ES2 and A2780 cells compared to scrambled control, irrespective of cisplatin treatment (Fig. 4E, F). Collectively, our data suggests that LDAH knockdown cancer cells exhibit reduced TAG levels and increased FAO and NF-ĸB activity.
ATGL expression is increased in LDAH knockdown cells and is linked to poor prognosisIt has been reported that LDAH promotes LD accumulation by increasing proteasomal degradation of ATGL (the primary enzyme responsible for TAG hydrolysis) in HEK293 cells [12]. Since TAG levels were reduced in LDAH knockdown cells, we asked whether these cells have increased ATGL expression. Confirming this, western blotting data showed increased ATGL expression in LDAH knockdown ES2 and A2780 cancer cells compared to scrambled control (Fig. 5A, Supplementary Fig. 5A) with or without cisplatin treatment. Furthermore, MG132 (a proteasome inhibitor) treatment increased ATGL expression in both ES2 scr and shLDAH cells (Supplementary Fig. 5B), suggesting that LDAH decreases ATGL expression in ovarian cancer cells potentially via proteasomal degradation.
Fig. 5: LDAH knockdown increases chemoresistance through ATGL upregulation.
A Western blot of ATGL in scrambled and LDAH knockdown ES2 cancer cells with or without cisplatin treatment. GAPDH, a loading control. B Cells viability of scrambled control (SCR), LDAH knockdown (shLDAH), and ATGL overexpressing (ATGL OE) ES2 cancer cells. Student’s T-test. TAG levels (mg/dl) (C) and Western blot of CPT1A, ATGL, pNF-ĸB, and NF-ĸB (D) in scrambled control and ATGL-overexpressing ES2 cells. Student’s T-test. E Immunofluorescence images of LDAH, ATGL, and cleaved caspase 3 in excised subcutaneous tumors from Fig. 2F. Scale bars, 100 µm (LDAH/ATGL IF), and 50 µm (cleaved caspase 3 IF). Quantification of fluorescence intensity of ATGL and cleaved caspase 3 are shown on the right. One-way ANOVA followed by Tukey’s multiple comparison test. F Cell viability of scrambled, LDAH knockdown (shLDAH), and atglistatin (50 µM)- treated shLDAH ES2 cells after 8 µM cisplatin treatment for 3 days. Student’s T-test. G BODIPY 493/503 staining (green) of lipid droplets in scrambled, LDAH knockdown (shLDAH), and atglistatin (50 µM)-treated shLDAH ES2 cancer cells. Blue, DAPI. Scale bars, 10 µm. H Western blot of CPT1A, pNFĸB, and NFĸB in scrambled, LDAH knockdown (shLDAH), and atglistatin (50 µM)-treated shLDAH ES2 cancer cells. I Kaplan-Meier survival curve of overall survival (OS) in 212 ovarian cancer patients based on ATGL expression. Red indicates high ATGL expression. *, p < 0.05, ***, p < 0.001. ****, p < 0.0001.
Next, we asked whether ATGL upregulation causes similar phenotypes as LDAH knockdown in ovarian cancer cells. We overexpressed ATGL in ES2 and A2780 cells (Supplementary Fig. 5C) and examined cancer cell viability after cisplatin treatment, TAG levels, FAO, and NF-ĸB activation. Our results showed that ATGL overexpression increased cancer cell viability upon cisplatin treatment (Fig. 5B). Similar to LDAH knockdown cancer cells, ATGL overexpressing cancer cells also showed decreased TAG levels and increased expression of CPT1A and p-NF-kB (Fig. 5C, D, Supplementary Fig. 5D, E).
Consistent with our in vitro data, both immunohistochemistry and immunofluorescence staining of ATGL in scrambled control or LDAH knockdown tumors (Fig. 2F) showed increased ATGL expression in LDAH knockdown tumors than control tumors (Fig. 5E, Supplementary Fig. 6). Importantly, cleaved caspase 3 staining significantly decreased in LDAH knockdown tumors compared to scrambled tumors upon cisplatin treatment (Fig. 5E), showing inverse relationship between ATGL expression and cleaved caspase 3 levels in tumors.
To determine if ATGL inhibition can attenuate the effects of LDAH knockdown in ovarian cancer cells, we utilized atglistatin, a pharmacological inhibitor of ATGL. Cell viability of cisplatin-treated LDAH knockdown ES2 cancer cells was significantly attenuated by atglistatin treatment (Fig. 5F). BODIPY staining showed that atglistatin treatment increased LD size in LDAH knockdown ES2 cancer cells (Fig. 5G). Furthermore, atglistatin-treated LDAH knockdown cancer cells also showed decreased expression of CPT1A and pNF-kB (Fig. 5H). Finally, we sought to determine the clinical significance of ATGL in ovarian cancer patients. Analysis of the TCGA dataset revealed that high levels of ATGL were associated with shorter overall survival in ovarian cancer patients (Fig. 5I).
Collectively, these data suggest that LDAH expression is downregulated in ovarian cancer cells, which leads to increased tumor growth and chemoresistance due to the upregulation of ATGL-mediated TAG hydrolysis. Our results provide novel insights on how ovarian cancer cells regulate ER stress and TAG hydrolysis through LDAH downregulation to promote tumor growth and chemoresistance.
Comments (0)