
Remember me


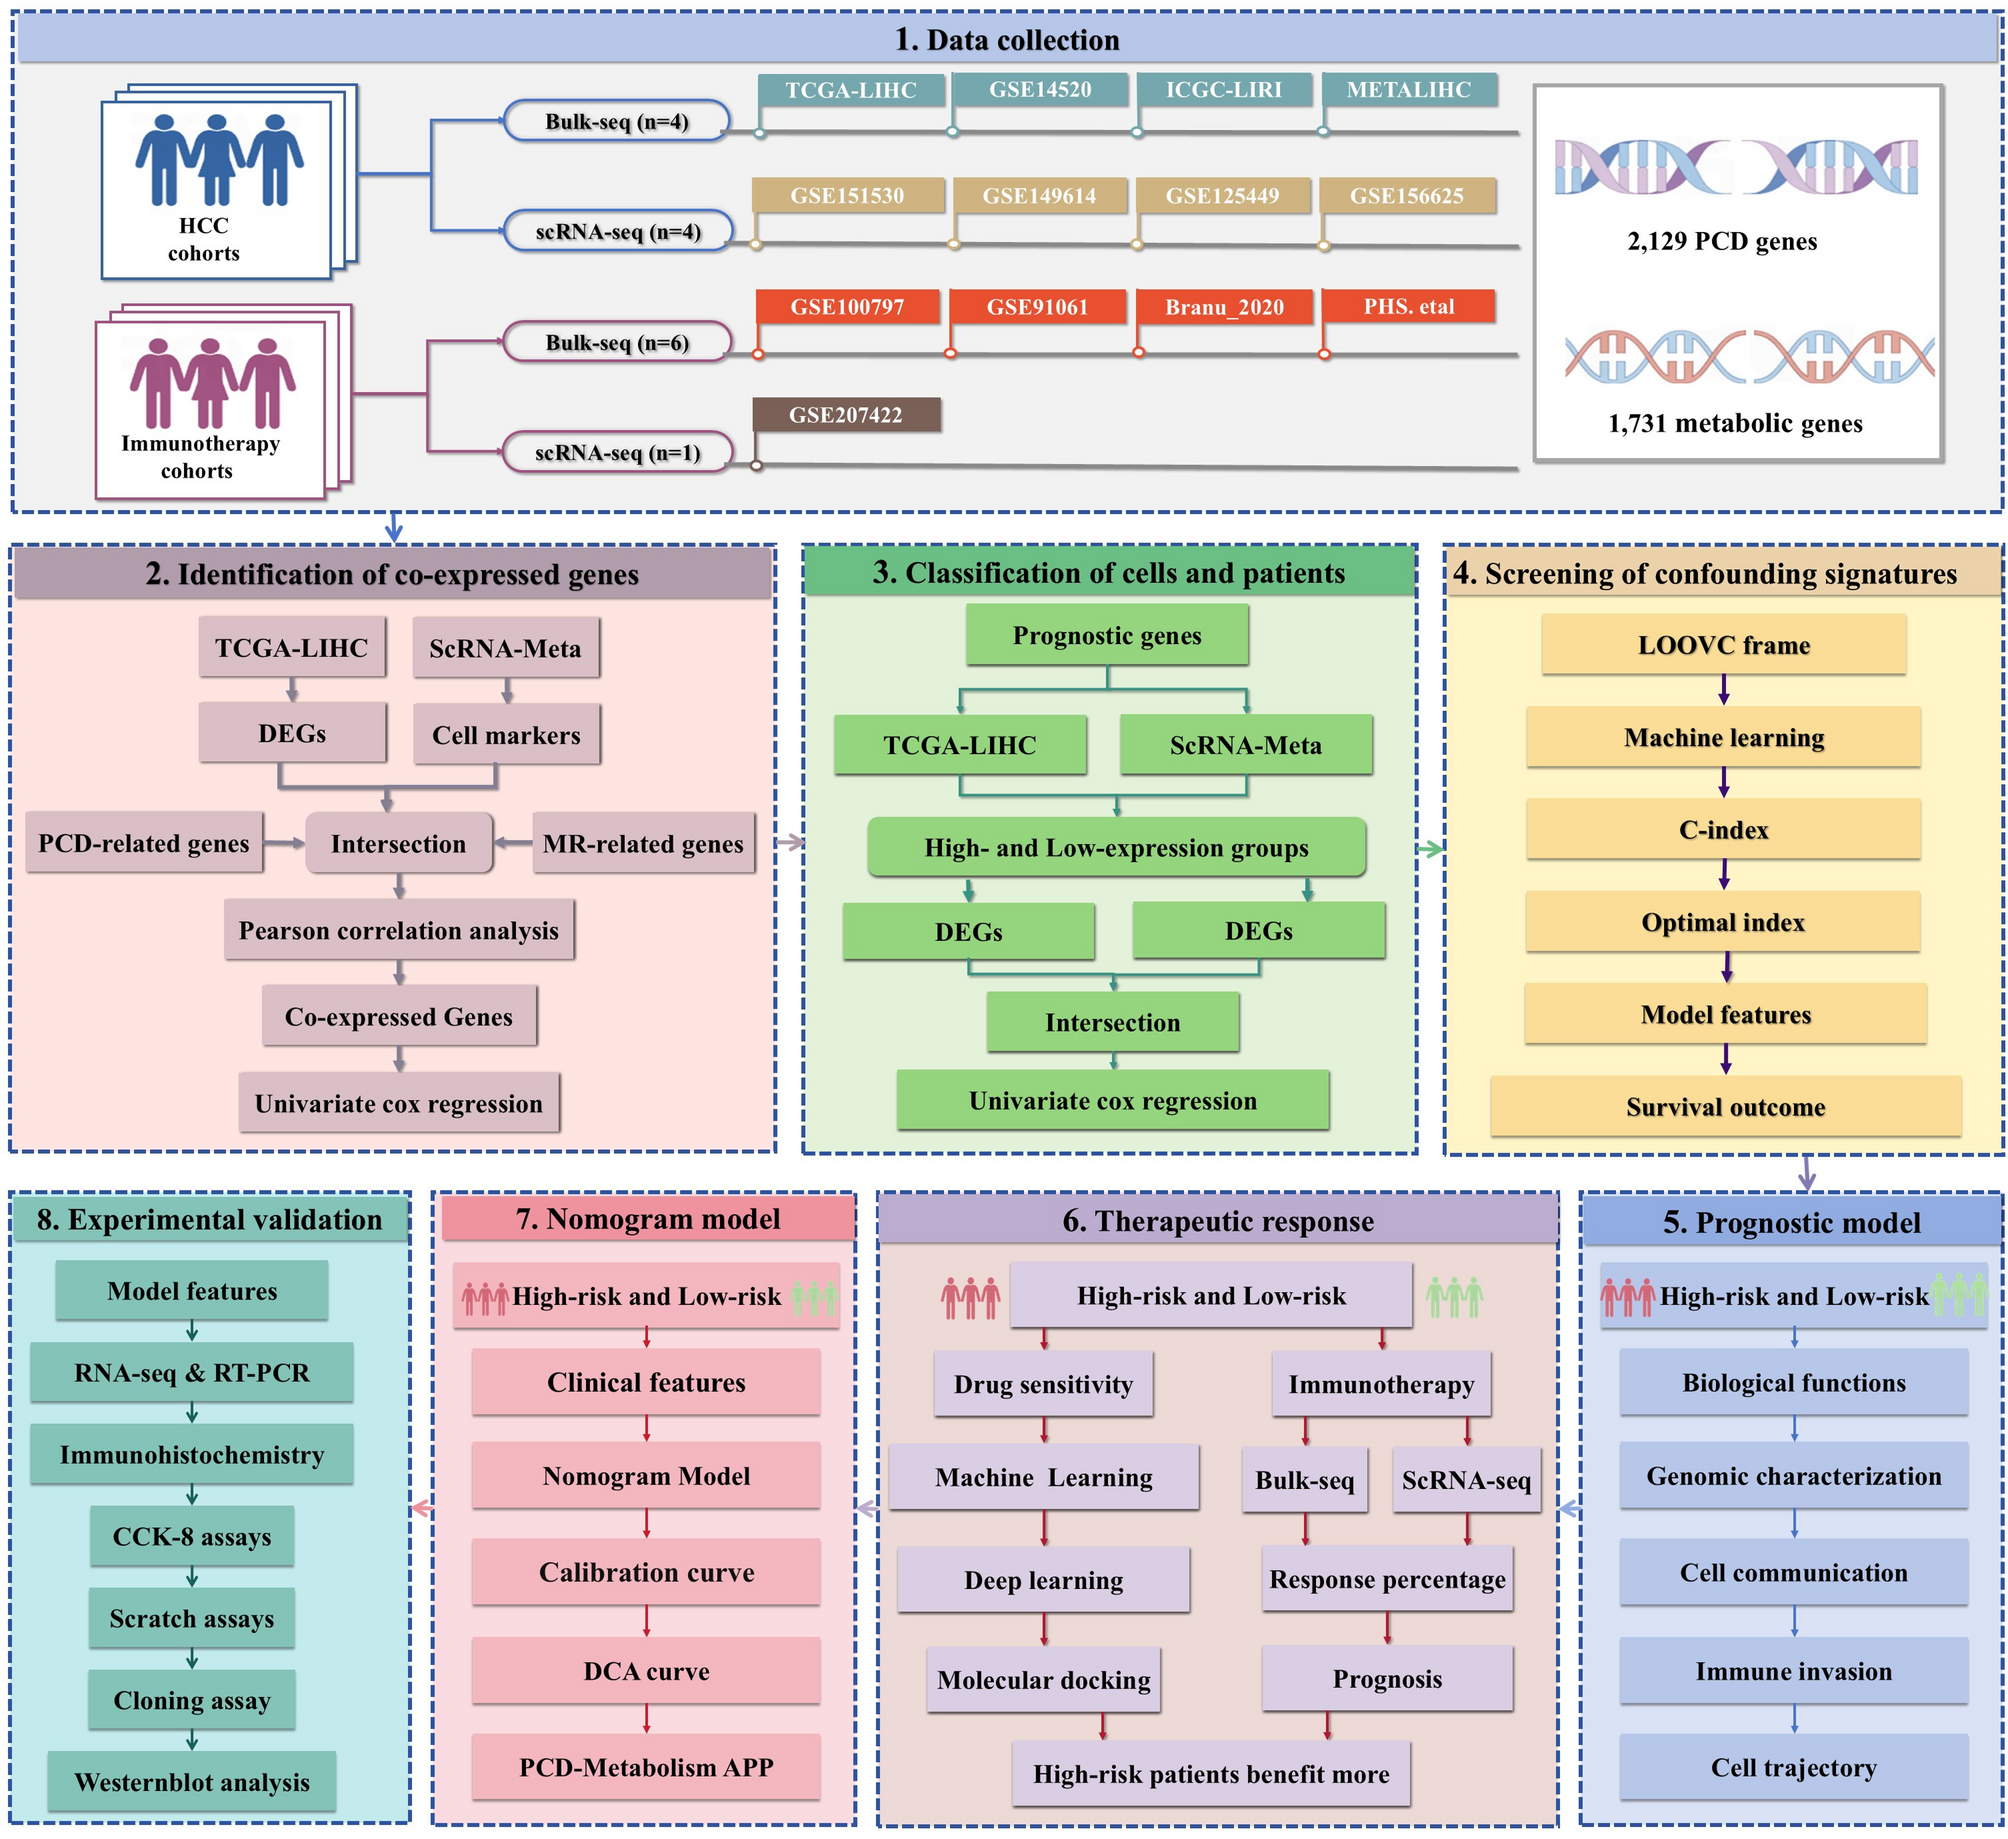

To investigate the relationship between PCD and metabolic processes in HCC progression, we first integrated four distinct scRNA-seq datasets (GSE151530, GSE149614, GSE125449, and GSE156625) into the scRNA-Meta cohort (Fig. 2A), comprising 58 HCC patients. After pre-processing and quality control, 118,306 high-quality cells were retained, clustered using PCA, and visualized via t-SNE. Based on established cell-type-specific markers, we annotated nine cell types: hepatocytes (ALB, TTR, APOA1), hepatocyte progenitor cell (HPC)-like cells (CD24, KRT19, SPP1), myeloid cells (CD68, C1QA, C1QB, C1QC), natural killer (NK) cells (NKG7, KLRD1, GNLY), T cells (CD2, CD3D, CD3E), fibroblasts (ACTA2, NOTCH3, PDGFRB), endothelial cells (PLVAP, PECAM1, VWF), plasma B cells (JCAHIN, MZB1, IGHG3), and B cells (CD79A, BANK1, MS4A1). The distribution of these cell types varied by region, age, sex, and disease stage (Fig. 2B).
Fig. 2
Identification of co-expressed PCD-Metabolism genes in the ScRNA-Meta and TCGA-LIHC cohorts. A t-SNE visualization of 118,306 cells from the ScRNA-Meta cohort, color-coded by cell type. The ScRNA-Meta cohort was constructed by integrating four independent scRNA-seq datasets (GSE151530, GSE149614, GSE125449, and GSE156625) via the Harmony algorithm. B Clinicopathological characteristics of HCC patients in the ScRNA-Meta cohort, and the number or proportion of cell types in the individual datasets (GSE151530, GSE149614, GSE125449, and GSE156625). C Identification of cell-type-specific markers in the ScRNA-Meta cohort using the FindAllMarkers function. D Differential expression analysis of normal and HCC tissues in the TCGA-LIHC dataset. E Major sources of PCD- and metabolism-related genes and their clinical relevance in HCC. F Overlapping genes among PCD-related genes, metabolism-related genes, and DEGs. G Univariate Cox regression analysis of co-expressed PCD-Metabolism genes associated with HCC prognosis. ***P < 0.001
We next identified 3,198 cell markers from the scRNA-Meta cohort and 7,892 DEGs from the TCGA-LIHC cohort (Fig. 2C-D). Genes overlapping between cell markers and DEGs were further analyzed to identify those linked to PCD and metabolic pathways. Given previous studies highlighting crosstalk between PCD and metabolism in HCC diagnosis, prognosis, treatment response, and drug resistance curated relevant genes from the KEGG, Reactome, and GSEA databases, as well as from published literature (Fig. 2E and Table S1). Pearson correlation analysis identified 205 genes co-expressed with PCD and metabolic processes (Fig. 2F and Table S3). Spearman correlation analysis further validated the co-expression patterns, highlighting the consistency and robustness of these associations. Of the 205 genes, 105 showed significant correlations with HCC patient prognosis (P < 0.05, Fig. 2G and Table S4).
Collectively, we identified 205 PCD-Metabolism co-expressed genes, 105 of which were significantly associated with HCC prognosis. These findings may contribute to understanding the distinction between activation and non-activation states at both the patient and cellular levels.
Identification of Activation and non-activation States across Patients and Cells Based on co-expressed GenesIn the TCGA-LIHC cohort, we employed ssGSEA analysis to quantify PCD-Metabolism activity and stratify HCC patients into activation and non-activation subgroups based on the median activity score (Fig. 3A). Differential expression analysis using the Wilcoxon rank-sum test identified 4,356 upregulated and 1,389 downregulated genes between the two groups (Fig. 3B).
Fig. 3
Shared PCD-Metabolism signatures across single-cell and bulk transcriptomes. A PCA analysis of TCGA-LIHC samples, classified based on co-expressed PCD-Metabolism genes. B Volcano plot showing DEGs between high and low PCD-Metabolism activity samples in the TCGA-LIHC cohort. C Classification of PCD-Metabolism states in the ScRNA-Meta cohort using the AddModule algorithm, visualized by t-SNE. D Volcano plot showing DEGs between high and low scoring cells in the ScRNA-Meta cohort
Concurrently, in the scRNA-Meta cohort, PCD-Metabolism activity was assessed at the single-cell level using the AddModule algorithm (Fig. 3C). Differential expression analysis via the FindMarkers function revealed 357 upregulated and 605 downregulated genes between the high- and low-scoring groups (Fig. 3D).
Genes consistently dysregulated across both cohorts were defined as PCD-Metabolism crosstalk features (Fig. S1A-B). Of these, 53 signatures were significantly associated with patient prognosis in the TCGA-LIHC and GSE14520 cohorts (Fig. S1C).
Collectively, we identified distinct PCD-Metabolism activation patterns in HCC patients across two cohorts, with 53 consistent prognostic signatures, suggesting a potential association between PCD-Metabolism crosstalk and HCC progression and prognosis.
PCD-Metabolism Risk Scoring System as a Predictor of Patient OutcomesTen machine learning algorithms were applied to construct the PCD-Metabolism signature, and their performance was systematically evaluated using the TCGA-LIHC cohort and three external validation datasets (ICGC, GSE14520, and METALIHC) to identify the optimal model. The model with the highest average C-index across all four cohorts was selected (Fig. 4A and Table S5). The final StepCox + RSF model selected 18 key genes comprising the PCD-Metabolism signature, including SPP1, HSP90B1, TUBB, CCT3, LDHA, POP7, LGALS3, MARCKS, STMN1, CKS1B, CDK4, CNIH4, DAB2, CTSC, HDAC2, RCN2, EEF1E1, and ALDOA (Fig. S2A). This gene signature demonstrated high diagnostic specificity for HCC in the evaluated datasets (Fig. S2B-C).
Fig. 4
Screening of PCD-Metabolism model genes and their prognostic relevance. A Top 10 machine learning algorithm combinations based on the C-index for feature selection in the PCD-Metabolism risk scoring system. B Kaplan-Meier survival curves for the TCGA-LIHC, ICGC-LIRI-JP, GSE14520, and METALIHC cohorts based on PCD-Metabolism risk score. C Receiver operating characteristic (ROC) curves for 1-year, 2-year, 3-year, and 4-year OS in each bulk-seq dataset
Using the selected genes and corresponding regression coefficients, we developed a PCD-Metabolism risk scoring system. Patients were stratified into high- and low-risk subgroups based on the median risk score. Prognostic analysis in the TCGA-LIHC, GSE14520, ICGC-LIRI-JP, and METALIHC datasets showed that a high PCD-Metabolism risk score correlates with shorter OS, disease-specific survival (DSS), progression-free interval (PFI), and recurrence-free interval (RFI) (Fig. 4B). The risk score showed favorable and consistent predictive performance for 1-, 2-, 3-, and 4-year survival across all cohorts, with AUC values ranging from 0.695 to 0.976 (Fig. 4C).
These findings suggest that dysregulation of PCD-Metabolism may be involved in HCC progression and support the potential prognostic value of the PCD-Metabolism risk score.
Functional Enrichment Analysis of the PCD-Metabolism Gene ModelTo explore the molecular differences between high- and low-risk subgroups, we performed WGCNA analysis to identify subgroup-specific gene modules. A soft-thresholding power of 9 was applied to construct a scale-free co-expression network (Fig. 5A). The blue module was positively correlated with the high-risk group, whereas the grey module correlated with the low-risk group (Fig. 5B). Kyoto Encyclopedia of Genes and Genomes (KEGG) pathway analysis revealed that the blue module was enriched in cell cycle–related pathways, including DNA replication and cellular senescence. Gene Ontology (GO) terms for this module included protein binding, nuclear components, and the nucleoplasm (Fig. 5C). In contrast, the grey module associated with the low-risk group was enriched in metabolic pathways, steroid hormone biosynthesis, and chemical carcinogenesis. GO analysis identified terms such as protein binding, extracellular exosomes, and plasma membrane localization (Fig. 5D).
Fig. 5
WGCNA analysis and functional enrichment of High- and Low-Risk Groups. A Selection of the soft-thresholding power in WGCNA. B Module-trait relationships identified in WGCNA. C KEGG and GO enrichment analysis of the blue module in WGCNA. D KEGG and GO enrichment analysis of the grey module in WGCNA
Collectively, these findings suggest the presence of distinct transcriptional programs associated with molecular risk stratification in HCC.
PCD-Metabolism Risk Score Was Linked To the Progression in HCCTo further investigate the biological relevance of the PCD-Metabolism risk model, we assessed its association with hallmarks of tumor aggressiveness, including genomic instability, stemness, and proliferative capacity. Copy number alterations (CNAs), microsatellite instability (MSI), and stemness indices are well-established indicators of genomic instability and intratumoral heterogeneity [51,52,53], both of which contribute to tumor progression and therapeutic resistance [54,55,56]. In the TCGA-LIHC cohort, GISTIC scores, which quantify the frequency and amplitude of somatic copy number changes [57], were significantly elevated in the high-risk group within the TCGA-LIHC cohort. Similarly, MSI scores and mRNAsi levels were higher in the high-risk group, suggesting increased genomic instability (Fig. 6A).
Fig. 6
Genomic and functional characterization across different PCD-Metabolism risk levels. A GISTIC scores (amplified and deleted regions), MSI scores, and mRNAsi levels in high- and low-PCD-Metabolism risk patients from the TCGA-LIHC cohort. B Proportion of malignant cells in high- and low-PCD-Metabolism subgroups from the scRNA-Meta cohort. C Proliferation and cell cycle activation in malignant cells with elevated PCD-Metabolism scores. D-E GSVA enrichment analysis showing significant pathway enrichment in the malignant cells of the high-risk subgroup compared to the low-risk subgroup, including oxidative phosphorylation, DNA damage response, and unfolded protein response. F NMF clustering analysis identifying metaprogram modules in malignant cells of the high-risk group. G GO enrichment analysis of metaprogram modules
Next, using the AUCell tool, we computed PCD-Metabolism scores for each cell in the scRNA-seq dataset. Cells were then classified into high- and low-expression groups based on the median AUCell score across all cells in the dataset. R-loop accumulation, a hallmark of transcription-associated genomic stress [58], was significantly elevated in the high-expression group, alongside increased stemness and a higher proportion of malignant cells (Fig. 6A-B, Fig. S3). Furthermore, high-expression cells demonstrated transcriptional signatures associated with enhanced proliferation and increased cell cycle activity (Fig. 6C).
Gene set variation analysis (GSVA) indicated that oxidative phosphorylation, DNA damage response, unfolded protein response, and PI3K–AKT–mTOR signaling pathways were enriched in high-expression Acells (Figs. 6D-E). These pathways are frequently associated with tumor survival and progression. Non-negative matrix factorization (NMF) clustering identified several metaprogram modules within high-risk malignant cells (Fig. 6F). GO analysis of six co-expression modules revealed enrichment in processes related to cell division, nuclear structure, exosomal signaling, and protein interactions (Fig. 6G).
The findings support an association between elevated PCD-Metabolism activity and molecular features characteristic of tumor aggressiveness. Although intrinsic cellular programs contribute to malignant phenotypes, the tumor microenvironment also plays a critical role in shaping tumor progression.
Intercellular Communication Landscape Associated with PCD-Metabolism ScoreTo assess the association between PCD-Metabolism activity and intercellular communication within the TME, we examined its relationship with immune and stromal cell signalling networks [58]. TME heterogeneity is a key factor influencing tumour progression and therapeutic outcome. Using the CellChat algorithm, we reconstructed predicted cell–cell communication networks from single-cell transcriptomic profiles [30].
Cells with high PCD-Metabolism scores were associated with more frequent and intense predicted intercellular interactions compared to the low-score group (Fig. 7A-B). Notably, hepatocytes exhibited stronger outgoing communication toward myeloid cells and T cells in the high-score group (Fig. 7C). In addition, fibroblasts, endothelial cells, and plasma B cells demonstrated increased inferred signalling toward hepatocytes, suggesting more active stromal and immune interactions with tumour cells.
Fig. 7
Cell–cell communication analysis between high- and low-risk groups. A The number and strength of cell interactions mediated by individual signal pathways in high-risk and low-risk groups. B Circle plots of communication numbers and strength between immune cells and hepatocytes. C Heatmap of cell–cell communication number and strength. Blue indicated reduced intercellular communication in the high-risk group compared to the low-risk group, while red indicated enhanced intercellular communication. D The ranking bar chart showed the signal axes of interactive networks in high- and low-risk groups. The signaling pathway with red labels was more abundant in the low-risk group, the signaling pathway marked black was equally abundant in both groups, and the signaling pathway with green labels was more enriched in the high-risk group. E Bubble map of altered cell–cell communication mediated by individual signaling axes, with the horizontal axis showing the cell class that initiates and receives the signal, and the vertical axis showing receptor-ligand pairs of the signaling pathway
To further investigate these differences, we quantified the predicted information flow of individual signalling pathways between hepatocytes and other cell types. In the high-PCD-Metabolism group, predicted signalling activity was elevated in several pathways, including MK, MIF, and SPP1, while SELL and CD99 pathways showed reduced activity (Fig. 7D, Fig. S4A). Focused analysis of MK, CD99, and SPP1 pathways revealed distinct cell–cell communication patterns across multiple cell populations between the two risk groups (Fig. S4B).
High PCD-Metabolism scores were also associated with increased expression of ligand–receptor pairs linking hepatocytes to plasma cells, myeloid cells, T cells, and endothelial cells (Fig. 7E). By contrast, predicted signalling via CD74-CXCR4 and CD74-CD44 interactions between hepatocytes and myeloid or T cells was reduced in the low-score group. These results suggest that PCD-Metabolism activity is linked to distinct intercellular communication states, which may reflect broader differences in metabolic programming and immune contexture in HCC.
Associations between PCD-Metabolism Scores and the Immune Landscape of the TMEGiven the observed differences in intercellular communication and signaling pathway activity between the high- and low-score groups, we next examined their association with immune cell composition and functional dynamics within the tumor microenvironment (TME). Comparative analysis revealed that the high-score group contained a higher proportion of stromal and epithelial cells, alongside a lower proportion of immune cells, relative to the low-score group (Fig. 8A). Within the high-score group, plasma B cells and myeloid cells represented the predominant immune cell populations (Fig. 8B).
Fig. 8
Immune landscape in high- and low-risk groups. A Proportions of immune cells, stromal cells, and epithelial cells in samples with high and low PCD-Metabolism risk subgroups. B Comparison of immune cell proportions between high- and low-score groups, showing five immune cell types (T cells, NK cells, plasma B cells, myeloid cells, and B cells). C Comparison of TIDE scores, exhaustion scores, and exclusion scores between high- and low-risk subgroups. D AUCell analysis of immune evasion-related gene expression across different cell types in the ScRNA-Meta cohort. E Comparison of TAA activity in myeloid subpopulations. F Dimensionality reduction and clustering analysis of fibroblasts. G Pseudotime analysis showing the differentiation trajectory among fibroblast subtypes. ***P < 0.001
Analysis of TIDE scores showed that patients in the high-score group exhibited elevated TIDE, immune exclusion, and MDSC scores, suggesting a tumor environment with increased potential for immune evasion (Fig. 8C). Further AUCell analysis, based on immune evasion-associated gene sets identified by Lawson et al. via CRISPR-Cas9 screening [45], revealed significant enrichment of these genes in plasma B cells and myeloid cells (Fig. 8D and Fig. S5A). These cell types may contribute to immune evasion through altered antigen processing and presentation pathways (Fig. S5 B-C).
To further resolve myeloid cell heterogeneity, we applied dimensionality reduction and clustering, identifying nine distinct subpopulations: cDC1 cells, cDC2 cells, DC3 cells, FOLR2⁺ macrophages, SPP1⁺ macrophages, FOLR2⁺SPP1⁺ macrophages, mast cells, monocytes, and pDCs (Fig. S6). Among these, cDC1 cells displayed the highest levels of tumor-associated antigen (TAA)-related activity (Fig. 8E).
We also investigated interactions between fibroblasts and immune cells and observed strong communication, particularly between fibroblasts and myeloid cells, which may contribute to an immunosuppressive microenvironment (Fig. 7B). Clustering analysis identified four fibroblast subtypes: matrix CAFs (matCAF), myofibroblastic CAFs (myCAF), heat shock protein-associated CAFs (HspCAF), and lipid-processing matrix-associated CAFs (LpmCAF) (Fig. 8E and Fig. S7A). Trajectory analysis indicated a continuum of gene expression changes during fibroblast differentiation toward the LpmCAF phenotype, with upregulation of genes such as SPP1, RCN2, CTSC, and DAB2 (Fig. S7B). These genes are involved in extracellular matrix remodeling, cellular stress responses, and metabolic adaptation, processes that are relevant to tumor progression and immune regulation.
Pseudotime analysis suggested that myCAF and HspCAF populations may transition toward matCAF and LpmCAF states (Fig. 8F), with a more frequent trajectory toward the LpmCAF subtype in the high-score group (Fig. 8G). This observation suggests a potential link between the PCD-Metabolism score and specific fibroblast differentiation patterns. Metabolic profiling further revealed that LpmCAF cells exhibited higher activity across multiple metabolic pathways compared to other fibroblast subtypes (Fig. S7C).
To explore the transcriptional networks associated with fibroblast heterogeneity, we performed hdWGCNA analysis using a soft-threshold power of 2, resulting in the identification of 13 gene modules (Fig. S7D). Modules 3, 6, 8, and 12 were most closely associated with the LpmCAF phenotype (Fig. S7E). In particular, module 3 included hub genes such as CD36 and FTH1, which were enriched in pathways related to iron ion sequestration and autolysosome formation (Fig. S7F–G). These genes may participate in metabolic reprogramming that supports the adaptation of LpmCAF cells to the altered conditions of the TME and may contribute to immune modulation. For example, CD36 is implicated in lipid uptake and inflammation, while FTH1 is involved in iron homeostasis, a process linked to both tumor cell proliferation and immune response regulation.
Collectively, these results highlight associations between PCD-Metabolism scores and the cellular and metabolic features of the TME, including immune evasion and fibroblast remodeling, providing a framework for further investigation.
PCD-Metabolism Predicted Immune Therapy ResponseImmune checkpoint inhibitors (ICIs) have reshaped the treatment landscape for several cancer types, yet predictive biomarkers for patient response remain limited. In the TCGA LIHC cohort, patients with lower PCD-Metabolism scores had significantly higher IPS scores compared to those with higher scores (Fig. S8), indicating a potentially more favorable immune microenvironment in the low-score group.
To assess the predictive relevance of the PCD-Metabolism score, we analyzed six bulk RNA-sequencing immunotherapy datasets and one single-cell RNA-sequencing dataset. Patients were stratified into high- and low-score groups based on the median score within each dataset. Across all six bulk RNA sequencing datasets, including GSE91061 (melanoma), Branu 2020 (renal cell carcinoma), PRJEB23709 (melanoma), PHS000452 (melanoma), Nathanson 2017 (melanoma), and GSE100797 (melanoma), patients in the low score group consistently showed better overall survival than those in the high score group (Fig. 9A). We also examined clinical response rates. Consistent with the survival data, a greater proportion of patients in the high-score group experienced limited clinical benefit, with higher frequencies of progressive and stable disease, compared to the low-score group (Fig. 9B). These results suggest that the PCD-Metabolism score may capture transcriptomic features of the TME associated with differential responses to immune checkpoint therapy. Although additional validation is needed, this score may serve as a candidate biomarker for identifying patients less likely to benefit from ICIs.
Fig. 9
PCD-Metabolism score as a predictor of immunotherapy response and survival outcomes. A Survival analysis in six independent immunotherapy cohorts (GSE91061, Branu_2020, PRJEB23709, PHS000452, Nathanson_2017, and GSE100797), showing significant differences in overall survival between high and low PCD-Metabolism score groups. B Comparison of the proportion of patients achieving PD + SD between the high and low PCD-Metabolism score groups. C ScRNA-seq analysis (GSE207422) showing the distribution of PCD-Metabolism scores across various cell types. D PCD-Metabolism scores of malignant cells from responders and non-responders to neoadjuvant immunotherapy. E Malignant cells exhibiting significantly higher PCD-Metabolism scores compared to other cell types. F Clustering analysis of malignant cells from immunotherapy responders, showing that these cells predominantly cluster within the low PCD-Metabolism score subgroup. *P < 0.05; ***P < 0.001; ****P < 0.001
To further explore this association, we examined single-cell RNA-seq data from GSE207422. Following dimensionality reduction, clustering, and cell-type annotation, we calculated PCD-Metabolism scores for each cell type (Fig. 9C). Malignant cells from responders exhibited significantly lower PCD-Metabolism scores compared to those from non-responders (Fig. 9D). Furthermore, among all cell populations, malignant cells had the highest PCD-Metabolism scores (Fig. 9E). Notably, malignant cells from patients who responded to neoadjuvant immunotherapy were predominantly located within the low-score subgroup (Fig. 9F).
In summary, lower PCD-Metabolism scores were associated with more favorable immunotherapy outcomes. These findings support the potential utility of this score as a predictive tool for immunotherapy response, pending further experimental and clinical validation.
Drug Repurposing Based on the PCD-Metabolism Model Using Computational ApproachesGiven the poor immunotherapy response observed in patients with high PCD-Metabolism scores, we sought to explore candidate treatment options that may be more effective for this group. To this end, we assessed the predicted drug sensitivities of HCC patients across different PCD-Metabolism score groups by analyzing response to commonly used chemotherapeutic and targeted agents.
We utilized the CTRP version 2.0 database (comprising 481 compounds across 835 cancer cell lines) and the PRISM database (1,439 compounds across 482 cancer cell lines), both of which provide gene expression and drug sensitivity profiles. Drug response was modeled using the pRRophetic algorithm based on purified gene expression data from patient samples, and the area under the curve (AUC) values were calculated for each compound. Compounds that showed significantly lower AUC values and a negative correlation with the PCD-Metabolism score were considered as potentially more effective in the high-score group. Using this approach, we identified five compounds from the CTRP database (Fluvastatin, GSK461364, Triazolothiadiazine, Nakiterpiosin, and SB743921) and four from the PRISM database (Volasertib, Epothilone B, LY2606368, and Lspinesib) (Fig. 10A-B).
Fig. 10
Evaluation of drug response and binding potential in HCC patients with different PCD-Metabolism scores. A Spearman correlation between risk score and estimated AUC of nine CTRP-derived drugs, and comparison between high- and low-risk groups. B Spearman correlation between risk score and estimated AUC of ten PRISM-derived drugs, and comparison between high- and low-risk groups. C Evaluation of binding scores between PCD-Metabolism model gene corresponding proteins and CTRP-derived and PRISM-derived drugs using deep learning algorithms. D Evaluation of binding scores between PCD-Metabolism model gene corresponding proteins and CTRP-derived and PRISM-derived drugs using molecular docking. E Binding energy of triazolothiadiazine with RCN2 and fluvastatin with CDK4. ***P < 0.001; ****P < 0.001
To further explore these candidate agents, we applied deep learning frameworks to predict the top-ranking drug–protein interactions and subsequently performed molecular docking simulations. The average binding scores from six docking algorithms suggested that Triazolothiadiazine had a strong predicted affinity for MARCKS, while Fluvastatin showed notable binding to LDHA and CDK4 (Fig. 10C). Among the top ten predicted drug–protein pairs, Triazolothiadiazine and Fluvastatin were frequently represented.
Molecular docking simulations further indicated that Triazolothiadiazine was predicted to have a stronger binding affinity to RCN2 (− 5.40 kcal/mol) than to MARCKS or LDHA. Fluvastatin demonstrated the strongest predicted binding to CDK4 (− 8.5 kcal/mol), outperforming its docking scores with LDHA, MARCKS, STMN1, and RCN2 (Fig. 10D-E).
Collectively, these results highlight several candidate compounds that may hold therapeutic potential for patients in the high PCD-Metabolism score group. In addition, the predicted drug–target interactions provide a valuable resource for future preclinical validation and mechanistic investigations.
Establishment and Assessment of the Nomogram Survival ModelTo evaluate the clinical relevance of the PCD-Metabolism risk score, we compared clinicopathological characteristics between the high- and low-risk groups. Significant differences in tumor stage distributions were observed between the two groups, with high-risk patients more frequently associated with advanced tumor stage and histological grade (Fig. 11A).
Fig. 11
Clinical relevance and prognostic value of the PCD-Metabolism risk score. A Distribution of tumor stage between high- and low-risk groups, showing a significant association with advanced stage in the high-risk group. B Univariate Cox regression analysis identified PCD-Metabolism as a significant risk factor for overall survival. C Multivariate Cox regression analysis confirms that PCD-Metabolism remains an independent prognostic factor for HCC after adjusting for potential confounders. D Nomogram model incorporating the PCD-Metabolism risk score and other clinicopathological factors for predicting patient prognosis. E Calibration curves demonstrating excellent agreement between predicted and observed survival probabilities at 1-, 2-, 3-, and 4-year intervals. F-G Survival (F) and ROC (G) analysis showing worse clinical outcomes in patients with high nomogram scores compared to those with low scores. H DCA shows that both the nomogram model and the independent PCD-Metabolism risk model provide greater net clinical benefit than the traditional clinical model at all time points (1-, 2-, 3-, and 4-year intervals). I User-friendly website for clinicians, where input data (age, gender, stage, and PCD-Metabolism) are used to generate survival plots and predicted survival times automatically. *P < 0.05
To determine whether the PCD-Metabolism risk score could serve as an independent prognostic factor, univariate and multivariate Cox regression analyses were performed. The univariate model identified the risk score as significantly associated with overall survival, where higher values correlated with poorer prognosis (Fig. 11B). This association remained significant after adjustment for clinical covariates, supporting the role of the PCD-Metabolism score as an independent prognostic indicator in HCC (Fig. 11C).
To integrate the PCD Metabolism score with clinical variables, we developed a nomogram model incorporating the score alongside relevant pathological features (Fig. 11D). Calibration plots showed good agreement between predicted and observed survival at 1-, 2-, 3-, and 4-year time points (Fig. 11E), supporting the predictive consistency of the model. Patients with higher nomogram scores tended to experience poorer outcomes (Fig. 11F-G). Furthermore, decision curve analysis (DCA) indicated that both the nomogram and the PCD Metabolism score alone provided higher net clinical benefit than models based solely on conventional clinical parameters (Fig. 11H).
To enhance accessibility, we created an interactive web platform (https://hcc-PCD-Metabolism.shinyapps.io/pcdmetabolismhcc/), allowing clinicians to input patient data (age, gender, stage, and PCD Metabolism score) and obtain individualized survival estimates (Fig. 11I).
In summary, this nomogram model, incorporating the PCD -Metabolism score, may serve as a useful prognostic tool to support risk stratification and clinical decision-making in hepatocellular carcinoma management.
Consensus Clustering Analysis of PCD-Metabolism Model GenesTo further explore the potential molecular subtypes associated with the PCD-Metabolism signature, we performed unsupervised consensus clustering. based on the expression of key model genes across four independent cohorts (TCGA-LIHC, GSE14520, ICGC-LIRI-JP, and METALIHC). The clustering was conducted using the ConsensusClusterPlus R package, and a range of k values (number of clusters) was systematically evaluated.
The optimal number of clusters (k = 2) was selected based on an integrated assessment of multiple diagnostic indicators. The consensus matrix heatmap for k = 2 showed two separated and internally coherent blocks, indicating strong intra-cluster consistency and high stability (Fig. 12A). The CDF curve further supported this selection by revealing that the relative increase in consensus began to plateau beyond k = 2, suggesting diminishing returns with higher k values (Fig. 12B). Consistently, the Delta Area plot showed that the largest gain in consensus occurred from k = 2 to k = 3, with minimal improvement thereafter (Fig. S10A). Importantly, the Proportion of Ambiguous Clustering (PAC) score was lowest at k = 2, indicating minimal cluster assignment ambiguity and the highest classification confidence among the tested values (Fig. S10B), and item-consensus scores were highest at k = 2, reflecting greater within-cluster consi
Comments (0)