
Remember me
The baseline characteristics of the 839 patients meeting the inclusion criteria are outlined in Table 1. Patients were classified into three groups based on the presence of measurable M-protein in serum and/or urine as defined by electrophoresis as described before. A total of 52.4% (n = 440) had measurable M-protein in serum, 27.2% (n = 228) had measurable M-protein in both serum and urine, and 24% (n = 171) had measurable M-protein only in the urine. Among patients with measurable paraprotein available only in serum at diagnosis, 60% had no measurable urine M-protein at baseline, while 40% did not have urine samples collected at the time of diagnosis. Within the total study population, nearly half of the patients, 47.6% (399), had measurable urine M-protein at baseline, 30.6% (257) had no measurable urine M-protein, and 21.8% (183) did not have urine samples available at diagnosis. In the urine-only group, we observed a higher median difference in FLC (303 mg/dL), creatinine levels (1.3 mg/dL), and monoclonal proteinuria (1.89 g/24 h), along with the lowest level of IgG (515 mg/dL).
Table 1 Baseline characteristics. Median and interquartile ranges, numbers, and percentages are presented.As first-line treatment, the most common regimen consisted of a combination of novel agents, such as monoclonal antibodies (daratumumab), proteasome inhibitors (bortezomib, carfilzomib, ixazomib), immunomodulators (lenalidomide, pomalidomide), alkylating agents (cyclophosphamide), and dexamethasone within or outside of clinical trials. A total of 68.5% of patients underwent autologous transplants as part of first-line therapy. Overall, 17% of all patients had t (11; 14) at diagnosis; however, in the LCMM group, this percentage was higher (33%).
Response assessmentThe overall response rates (ORR) were compared directly across three biomarkers after each cycle during the first four cycles of induction and at the time of the best response (Fig. 1). We evaluated each FLC response for association with each paraprotein response at the five time points.
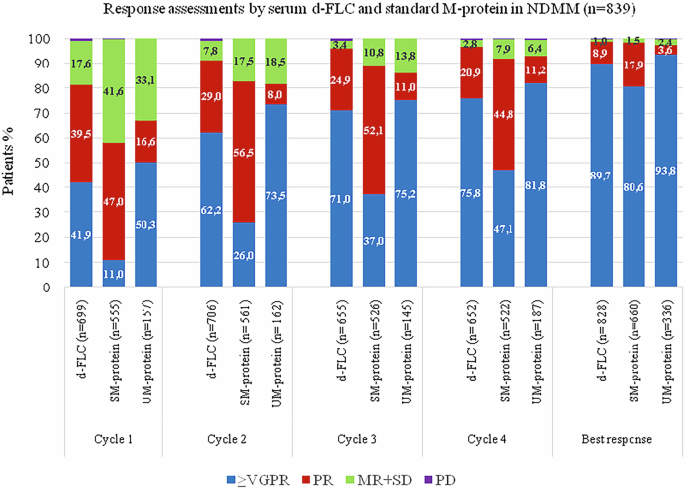
Fig. 1: Response assessments by serum dFLC and standard M-protein in NDMM (n = 839).
*Response rate is calculated by the number of patients in each response category/number of samples available ×100. **VGPR very good partial response, PR partial response, MR minor response, SD stable.
After the first cycle of treatment, response rates for ≥very good partial response (VGPR) and partial response (PR) were as follows: based on serum dFLC (41.9%, 39.5%), serum M-protein (11%, 47%), and urine M-protein (50.3%, 16.6%). According to IMWG criteria, an ORR of ≥90% for dFLC was achieved after the second cycle, while for serum and urine paraprotein, measured by electrophoresis, this level was achieved after the fourth cycle of treatment.
We performed an additional analysis to evaluate alternative cutoffs for urine M-protein response, comparing them to serum markers. We examined a cutoff of ≥90% reduction in urine M-protein for VGPR-uPEP and a reduction between ≥50% and ≤90% for PR-uPEP. (Supplementary Fig. 1). Based on this modified criterion, the ORR for urine M-protein after each induction cycle was consistently higher than those assessed based on the standard IMWG criteria and more closely aligned with FLC response trends. A reduction of ≥90% for urine M-protein was observed after the second cycle of induction, as with sFLC.
At the time of best response, 98% of patients (824/839) achieved at least a PR based on sPEP/uPEP. Similarly, among the 817 samples available for FLC response assessment, 98% (810/817) also showed at least a PR at the time of best electrophoretic response. Among the 824 patients who achieved ≥PR by sPEP/uPEP, only 7 (<1%) patients did not achieve ≥PR by sFLC, including one patient who met the FLC progression criteria. Similarly, among the 810 patients who achieved ≥PR by sFLC, 7 (<1%) patients did not have an electrophoretic response.
Among the 83% (696/839) of patients who achieved ≥VGPR by sPEP/uPEP at their best response, 95% also achieved sFLC-VGPR. In contrast, among the 17% (141/839) of patients who did not achieve VGPR by sPEP/uPEP, 57% (80/141) had sFLC-VGPR. These results demonstrate that nearly half of the patients with less than VGPR by sPEP/uPEP, at their time of best response, had at least a 90% decline in monoclonal sFLC.
We also demonstrated that achieving an early FLC response (≥PR), after two cycles of induction, is a strong predictor of subsequent serological responses assessed by electrophoresis (sPEP/uPEP), with an odds ratio of 9.33 (95% CI: 2.76–31.5; P = 0.001). This early FLC response was also associated with a moderate reduction in the risk of progression with a hazard ratio of 0.77 (95% CI: 0.61–0.99; p = 0.046). Ninety-nine percent of early FLC responders (638/644) after the second cycle of induction eventually achieved an overall electrophoretic response.
Focusing on the 47.5% (399/839) of the total study population with measurable urine at diagnosis, 98% achieved at least a PR by sPEP/uPEP; all except two patients had also sFLC-PR. In the LCMM group, 99% (169/171) eventually achieved at least a PR based on uPEP. Furthermore, all LCMM responders by uPEP also had an FLC response during the first-line therapy. Additionally, when assessing the VGPR rate in LCMM patients, 96% of uPEP responders also achieved VGPR based on FLC evaluation.
Correlating responses and survival outcomesWe compared the impact of achieving VGPR based on dFLC, serum M-protein by sPEP, and urine M-protein by uPEP on progression-free survival (PFS) after four cycles of induction treatment (Fig. 2A) for all cohorts and by splitting by monoclonal measurable groups (Fig. 2B). This analysis revealed that there were no statistically significant differences in PFS between VGPR responses assessed by dFLC, sPEP, and uPEP in all patients (p = 0.538) and by subgroups.
Fig. 2: Median Progression-Free Survival (PFS) according to VGPR achievement, assessed by Serum-free light chain (dFLC), Serum/Urine M-protein by Electrophoresis (SM-protein/ UM-protein).
A Median progression-free survival (PFS), in patients achieving VGPR by serum-free light chain (sFLC), serum and urine M-protein by electrophoresis (SM-protein/UM-protein), after the fourth cycle of induction therapy. (All cohort). B Median progression-free survival (PFS), in patients achieving VGPR by serum-free light chain (sFLC), serum and urine M-protein by electrophoresis (SM-protein/UM-protein), after the fourth cycle of induction therapy. (Splitting by measurable M-protein).
Correlation between serum FLC and 24-h urine M-proteinThe median percentage changes of dFLC and 24-h urine M-protein were analyzed and compared after each cycle of treatment during the induction. After the first cycle of treatment, we demonstrated a substantial median reduction in dFLC of 86%, with a comparable median percentage decline of 90% in 24-h urine M-protein. The median percentage reductions in subsequent cycles of therapy showed parallel trends, indicating consistent and similar reductions across both markers over time (Fig. 3). The correlation coefficients between changes in the absolute values of serum FLC and 24 h of urine M-protein after each cycle of treatment showed a moderate-strong correlation; cycle 1 (r 0.791, p < 0.001), cycle 2 (r 0.597, p < 0.001), cycle 3 (r 0.597, p < 0.001), and cycle 4 (r 0.540, p < 0.001). A strong correlation was also detected between dFLC and 24-h urine M-protein in the LCMM group, with coefficients ranging from 0.616 to 0.771. A similar analysis was conducted in the subgroup of patients with measurable urine M-protein at baseline (N = 399), where the correlation remained robust, ranging from 0.601 to 0.787. Consistent results were also observed in patients with renal insufficiency (creatinine ≥2 at diagnosis), with correlation coefficients ranging from 0.617 to 0.781 (Table 2).
Fig. 3: The median percentage changes of dFLC and urine M-protein over time in response to treatment during the induction therapy in NDMM.
(All cohorts, n = 839). *Percent change = 100× (Value in each cycle − baseline)/baseline.
Table 2 Correlation coefficients between absolute values of dFLC and urine M-protein during the induction, Spearman correlation coefficient.Time to responseThe number of patients assessed for response by dFLC, serum M-protein, and urine M-protein was 839 (100%)/668 (79.62%)/399 (47.56%). Patients were assessed for overall response (≥PR) and at least a very good partial (≥VGPR), resulting in 787/593/269 and 615/290/239 for dFLC, serum M-protein, and urine M-protein, respectively. The median time to partial response for all cohorts, detected earlier by dFLC (1.1 months, 95% CI: 1.06–1.17), in comparison with serum M-protein (1.5 months, 95% CI: 1.40–1.62) and urine M-protein (2.8 months, 95% CI: 2.42–3.10), with p < 0.001. (Fig. 4A). The median time to VGPR for all patients was significantly shorter for dFLC (2.00 months, 95% CI: 1.87–2.13) compared to serum M-protein (4.37 months, 95% CI: 4.072–4.67) and urine M-protein (3.12 months, 95% CI: 2.73–3.52) with p < 0.001. (Fig. 4B). Furthermore, the study demonstrated that the median time to VGPR was significantly shorter for urine M-protein, compared to serum M-protein (p < 0.001). (Fig. 4B). Table 3 presents a summary of the median time to responses.
Fig. 4: Time to Treatment Response Measured by Difference serum-free light chain (dFLC), Serum and Urine M-protein by Electrophoresis (SM-protein/ UM-protein).
A Time to partial response (months). Kaplan–Meier plots (All cohorts). B Time to very good partial response (months). Kaplan–Meier plots (All cohorts).
Table 3 Time to major response and VGPR measured by difference (FLC), serum M-protein, and urine M-protein (All cohorts).We additionally analyzed the median time to partial response based on subcategories.
For the serum M-protein measurable by sPEP group, the median time to PR by dFLC was 1.2 months (95% CI: 1.06–1.24), which was significantly shorter than that observed by serum M-protein (1.48 months, 95% CI: 1.34–1.62) with (p < 0.001). Among patients with measurable M-protein in both serum and urine, the median time to response (TTR) by dFLC was 1.08 months (95% CI: 1.01–1.16), which was detected earlier compared to serum M-protein (1.51 months, 95% CI: 1.31–1.71), and urine M-protein (3.19 months, 95% CI: 2.57–3.80), p < 0.001. In patients with measurable urine-only M-protein at baseline, earlier detection of response by dFLC (1.12 months, 95% CI: 1.00–1.23) was observed, compared to urine M-protein (2.37 months, 95% CI: 2.00–2.73), p < 0.001 (Table 4).
Table 4 Median time to major response, stratified by measurable M-protein by sPEP/uPEP at baseline (months).Progression assessmentWith a median follow-up of 53.3 (IQR 31.5–77.4) months, 54% (452/839) of patients experienced progression of disease (PD) by at least one of the biomarkers, as described previously. The median time from disease progression to the initiation of second-line therapy was 7 (IQR 0–17.7) days. At the time of the second line of treatment, the proportion of patients with sFLC-PD was higher than those with serum and urine electrophoretic PD, respectively (61%, 51%, and 24%, p = 0.001).
Among patients with confirmed PD based on sFLC (261/427), 24% (103/427) met PD criteria exclusively by sFLC per IMWG criteria. Of these 103 patients, none had PD criteria by sPEP, 48% (49/103) did not meet progression criteria by uPEP, and 52% (54/103) had no urine sample available; if we evaluate only those patients who had both serum and urine samples available at the time of assessing disease progression (excluding those with missing urine samples [54]), in 12% (49/427) of total patients with PD, sFLC was the only detectable tumor marker at the time of initiating a new line of treatment. Of these patients, 45% underwent bone marrow evaluation at the time of second line, which revealed >10% clonal plasma cells. Patients with sFLC-PD subsequently initiated a second line of therapy. Almost half of these patients were in the LCMM group.
Among patients with measurable M-protein in urine only (LCMM) at diagnosis, 52% (89/171) experienced PD. Within this group, 84% (75/89) showed PD by sFLC, and only 39% (26/67 available urine samples) by uPEP. All patients who met the urine progression criteria also met the PD criteria based on sFLC.
In patients with measurable urine M-protein at baseline, 59% (235/399) developed PD. However, only 19.5% (45/235) showed PD based on uPEP, while 67.6% (158/235) presented PD by sFLC. (Supplementary Table 2). All patients with progression by uPEP also had sFLC-PD; however, among 158 patients with sFLC-PD, only 28% (45/158) met the criteria for PD by uPEP, 57 patients (nearly one-third) did not fulfill PD criteria by urine M-protein, and another 56 (35%) did not have urine samples at the time of second line of treatment.
We next evaluated the clinical impact of PD type, comparing patients with sFLC-PD only to those with PD detected by uPEP, with or without sFLC-PD. The median second progression-free survival (PFS-2) for patients with only sFLC-PD was similar to those with urine M-protein PD with or without sFLC-PD (HR 1.28, 95% CI = 0.77–2.13, p 0.334). (Fig. 5A). However, the median overall survival (OS) from the first relapse was significantly better for patients with only sFLC-PD, compared to those with urine M-protein PD with or without sFLC-PD (HR 1.87, 95% CI = 1.07–3.27, p 0.026). (Fig. 5B), which may reflect the impact of earlier initiation of therapy, although it could also suggest differences in disease biology.
Fig. 5: Outcomes according to the pattern of progression disease; comparing patients with progression disease only by serum-free light chain (sFLC-PD) and patients with urine M-protein progression disease, measured by urine electrophoresis (urine PD), with or without sFLC-PD.
A Median Second Progression-Free Survival. B Median Overall survival from first relapse. CI confidence interval, PD progressive disease, sFLC serum-free light chain, PFS progression-free survival, OS overall survival.
We evaluated the association between each sFLC-PD and paraprotein-PD at 3-time points before confirmation of PD and at the time of second-line therapy. The evaluation cutoff was defined as the point at which one or more biomarkers met the progression criteria before starting second-line treatment (Fig. 6). The median time between the first, second, and third detection of PD by any of the three biomarkers and the initiation of second line of therapy was 93, 60, and 42 days, respectively. In 34% (89/261) of patients with sFLC-PD, disease progression preceded electrophoretic progression with a median of 3 months, and all patients eventually had confirmed electrophoretic PD, except for two patients who were lost the follow-up. Serial measurement of serum FLC showed the earlier detection of relapse by sFLC compared to standard electrophoretic measurements.
Fig. 6: Progression assessments by serum FLC, serum, and urine M-protein by electrophoresis, over time.
*Time: The evaluation cutoff, when one or more of the biomarkers meet the progression criteria before starting the 2nd line of therapy (last cluster bars). **The median time between the first, second, and third detection of progressive disease and the start of the second line of therapy: . ***Percentage is calculated by the number of patients with criteria of progression/number of samples available at each time point. PD progression disease.
Comments (0)