
Remember me
The AMWG cohort comprised 1225 patients with primary MDS enrolled from three tertiary referral centers in Asia between 1 January 2006 and 30 May 2021 (Supplementary file 3 and Table 1). There were 778 men (63.5%) and 447 women (36.5%) with a median age of 68 years (interquartile range, IQR: 57.1–77.4 years) at diagnosis. The median duration of follow-up was 2.9 years (IQR: 1–7.1 years). Cytogenetic risks grouped by IPSS-R were very good (N = 20, 1.6%), good (N = 619, 50.5%), intermediate (N = 241, 19.7%), poor (N = 70, 5.7%), and very poor (N = 193, 15.8%). The IPSS-R risk scores were very low (N = 49, 4%), low (N = 281, 22.9%), intermediate (N = 279, 22.8%), high (N = 258, 21.1%), and very high (N = 269, 20%). The IPSS-M risk scores were very low (N = 1, 0.1%), low (N = 36, 2.9%), moderately low (N = 55, 4.5%), moderately high (N = 81, 6.6%), high (N = 245, 20%), and very high (N = 670, 54.7%). Mutations were identified in one or more cases for each of the 54 genes in the panel (Fig. 1 and Supplementary files 4–6). Three hundred and ninety-seven patients (32.4%) received hypomethylating agents (HMA) (azacitidine, N = 370; decitabine, N = 27). One hundred and fifty-eight patients (12.9%) underwent allo-HSCT. Two hundred and eighty-four patients developed sAML.
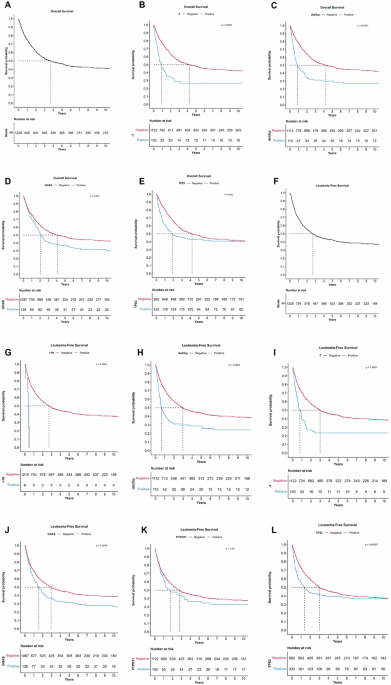
Fig. 1: Kaplan-Meier analysis of overall survival (OS), leukemia-free survival (LFS) and the impact of genomic factors on OS and LFS in 1225 patients with primary myelodysplastic neoplasm (MDS) in Asia.
A Overall survival of primary MDS in Asia; B Adverse prognostic impact of monosomy 7 (-7) on overall survival in primary MDS in Asia; C Adverse prognostic impact of del(5q) on overall survival in primary MDS in Asia; D Adverse prognostic impact of GNAS mutations on overall survival in primary MDS in Asia; E Adverse prognostic impact of TP53 mutations on overall survival in primary MDS in Asia; F Leukemia-free survival of primary MDS in Asia; G Adverse prognostic impact of trisomy 19 (+19) on leukemia-free survival in primary MDS in Asia; H Adverse prognostic impact of 5q deletion [del(5q)] on leukemia-free survival in primary MDS in Asia; I Adverse prognostic impact of monosomy 7 (-7) on leukemia-free survival in primary MDS in Asia; J Adverse prognostic impact of GNAS mutations on leukemia-free survival in primary MDS in Asia; K Adverse prognostic impact of PTPN11 mutations on leukemia-free survival in primary MDS in Asia; L Adverse prognostic impact of TP53 mutations on leukemia-free survival in primary MDS in Asia. All P-values were obtained using log-rank test. The genomic factors shown were significant on multivariable analysis (see Table 2).
Table 1 Clinicopathologic features of 1225 patients with primary myelodysplastic neoplasm.Genomic landscapeGene mutations were identified in 1177 patients (96%), with 1059 patients (86%) harboring ≥2 mutations (Supplementary files 4–6). The most commonly mutated genes were TET2, DNMT3A, and ASXL1 (Supplementary files 4–6). Mutation enrichment analysis for MDS subgroups based on the WHO 2016 classification showed significant enrichment of mutations of SF3B1, KMT2A, TET2, NOTCH1 and MYD88 in MDS with ring sideroblasts and single lineage dysplasia; CDKN2A, CUX1, STAG2, KDM6A, RUNX1 and ASXL1 in MDS with excess blasts-1 (MDS-EB-1); and TP53, GATA1, BRAF, CSF3R, IDH2, EZH2 and PHF6 in MDS-EB-2 (Supplementary files 5 and 7). Mutation enrichment analysis in MDS subgroups based on the WHO 2022 classification showed significant enrichment of mutations of SF3B1, BCOR, BCORL1, GNAS, KMT2A, CSF3R, ABL1 and IDH1 in MDS with low blasts and SF3B1 mutation; and TP53, ASXL1, IKZF1, NOTCH1, TET2, SMC1A, DMNT3A, IDH1, ATRX, PDGFRA, CUX1 and CEBPA in MDS with biallelic TP53 inactivation (Supplementary files 5 and 7). TET2 mutations significantly co-occurred with IKZF1, ATRX, ASXL1 and DMNT3A mutations (P < 0.05) (Supplementary file 8). Mutations of DNMT3A and EZH2 and mutations of RUNX1, GATA2, and ZRSR2 were mutually exclusive (Supplementary file 8). Characteristics of variants for each of the sequenced genes were shown in Supplementary file 9.
Impact of ASXL, SF3B1 and TP53 mutationsASXL1 variant allele frequency of ≥0.2 was independently associated with inferior OS (P < 0.001), LFS (P < 0.001), and TTP-sAML (P = 0.005) (Supplementary file 10). ASXL1 frameshift variants were associated with significantly inferior OS (P < 0.001) and LFS (P < 0.001) (Supplementary file 11). SF3B1 co-mutations did not significantly impact on OS, LFS, and TTP-sAML (Supplementary file 11). A TP53 variant allele frequency of ≥0.2 was independently associated with inferior OS, LFS, and TTP-sAML (P < 0.001) (Supplementary file 12). There was no significant difference in OS, LFS, and TTPs-AML between monoallelic and multiallelic/multihit TP53 mutations (Supplementary file 12). TP53 frameshift and splicing co-mutations were associated with a significantly inferior OS (P = 0.02), LFS (P = 0.03), and TTP-sAML (P = 0.002) (Supplemental file 13).
Validation of the IPSS-R and the IPSS-M in the current Asian cohortThe IPSS-R and the IPSS-M were validated using the current Asian cohort (Supplementary files 14 and 15). Separation of prognostic categories was observed (Supplementary file 15). The C-indices obtained for IPSS-R were 0.68 for OS, 0.68 for LFS, and 0.71 for TTP-sAML; whereas those obtained for IPSS-M were 0.57 for OS, 0.59 for LFS, and 0.65 for TTP-sAML (Supplementary file 14).
OutcomeThe median OS of the cohort was 3.7 years (95% confidence interval, C.I.: 2.90–4.54). The 5-year and 10-year OS were 46.7% and 41% respectively (Fig. 1A). Genomic factors associated with inferior OS on multivariable analysis included monosomy 7, del(5q), and mutations in GNAS and TP53 (Table 2 and Fig. 1B–E). The median LFS of the cohort was 2.5 years (95% CI: 2.19–3.19). The 5-year and 10-year LFS were 42.4% and 37.2% respectively (Fig. 1F). Genomic factors associated with inferior LFS on multivariate analysis included trisomy 19, del(5q), monosomy 7, and mutations in GNAS, PTPN11, and TP53 (Table 2 and Fig. 1G–L). The 5-year and 10-year cumulative risk of progression to sAML was 28.8% and 29.5% respectively (Fig. 2A). Genomic factors associated with inferior TTP-sAML on multivariate analysis include i(17q), del(5q), and mutations in NPM1, NRAS, GNAS, IDH2, SF3B1, and RUNX1 (Table 2 and Fig. 2B–I). Increasing age, as a continuous variable, was associated with worse OS and LFS (Table 2). Male sex was associated with worse OS, LFS, and TTP-sAML (Table 2). Increasing peripheral blood blast percent, as a continuous variable was associated with worse LFS and TTP-sAML (Table 2).
Fig. 2: Kaplan-Meier analysis of time to progression (TTP) to secondary acute myeloid leukemia (AML) in 1225 patients with primary myelodysplastic neoplasm (MDS) in Asia.
A Time to progression to secondary AML in primary MDS in Asia; B Adverse prognostic impact of isochromosome 17q [i(17q)] on time to progression to secondary AML in primary MDS in Asia; C Adverse prognostic impact of 5q deletion [del(5q)] on time to progression to secondary AML in primary MDS in Asia; D Adverse prognostic impact of NPM1 mutations on time to progression to secondary AML in primary MDS in Asia; E Adverse prognostic impact of NRAS mutations on time to progression to secondary AML in primary MDS in Asia; F Adverse prognostic impact of GNAS mutations on time to progression to secondary AML in primary MDS in Asia; G Adverse prognostic impact of IDH2 mutations on time to progression to secondary AML in primary MDS in Asia; H Adverse prognostic impact of SF3B1 mutations on time to progression to secondary AML in primary MDS in Asia; I Adverse prognostic impact of RUNX1 mutations on time to progression to secondary AML in primary MDS in Asia. All P values were obtained using log-rank test. The genomic factors shown were significant on multivariable analysis (see Table 2).
Table 2 Significant variables selected for prognostic models for outcome in primary myelodysplastic syndrome in Asia.Personalized prognostic modelVariables impacting on OS, LFS, and TTP-sAML on multivariate analysis had their C-indices determined (Supplementary files 16-18). Variables with the highest C-indices were selected for inclusion in the prognostic models for OS, LFS, and TTP-sAML (Table 2). A six-category risk stratification (Asian Prognostic Scoring System, APSS) was defined: very good, good, intermediate-1, intermediate-2, poor, and very poor. The risk categories allowed prognostic risk separation for all three clinical end-points (Table 3 and Fig. 3A–F). To facilitate clinical utility, an APSS Web calculator has been constructed (https://medicine-intranet.hku.hk/mds/index_v3.html). With patient-specific clinicopathologic, hematological, karyotypic, and molecular parameters, a specific APSS score, the corresponding risk category, and the median survival could be calculated.
Fig. 3: Outcome prediction and validation of the Asian Prognostic Scoring System (APSS).
A Prognostic risk categories for overall survival according to the APSS; B Distribution of prognostic risk categories for overall survival according to the APSS (X-axis represents the prognostic score); C Prognostic risk categories for leukemia-free survival according to the APSS; D Distribution of prognostic risk categories for leukemia-free survival according to the APSS (X-axis represents the prognostic score); E Prognostic risk categories for time-to-progression to secondary acute myeloid leukemia according to the APSS; F Distribution of prognostic risk categories for time-to-progression to secondary acute myeloid leukemia according to the APSS (X-axis represents the prognostic score); G Comparison of concordance (C) indices obtained using the APSS, molecular international prognostic scoring system (IPSS-M) and the Revised International Prognostic Scoring System (IPSS-R) in the current Asian primary myelodysplastic neoplasm cohort; H Validation of the APSS risk categories on overall survival (OS) in the external IPSS-M dataset; I Validation of the APSS risk categories on leukemia-free survival (LFS) in the external IPSS-M dataset; J Validation of the APSS risk categories on the time-to-progression (TTP) to secondary acute myeloid leukemia in the external IPSS-M dataset.
Table 3 Outcome according to Asian Prognostic Scoring System (APSS) risk groups in 1225 patients with primary myelodysplastic neoplasm in Asia.In this Asian primary MDS cohort, the C-indices for OS, LFS, and TTP-sAML obtained using IPSS-R (OS: 0.68; LFS: 0.68; TTP-sAML: 0.71) and IPSS-M (OS: 0.57; LFS: 0.59; TTP-sAML: 0.65) were lower than those obtained using the APSS (OS: 0.73; LFS: 0.72; TTP-sAML: 0.75) (Fig. 3G and Supplementary file 14).
Validation of the APSSThe APSS was externally validated using the publicly available IPSS-M dataset (https://github.com/papaemmelab/ipssm) from the International Working Group for Prognosis in MDS (IWG-PM) cohort [4]. The cohort comprised 2957 patients with MDS, with 102 patients from Taiwan [4]. The number of patients of Asian descent in the entire cohort was not specified [4]. It showed clear separation of prognostic subgroups for OS (C-index 0.70), LFS (C-index 0.71), and TTP-sAML (C-index 0.74) that were statistically significant (Fig. 3H–J and Supplementary file 19).
Restratification of patients from IPSS-M to APSSMapping was performed between the IPSS-M to APSS risk categories for overall survival (Supplementary files 20). In 1098 patients where IPSS-M was available, restratification occurred in 917 (83.5%) of patients. Of these, 775 patients (84.5%) were downstaged and 142 patients (15.5%) were upstaged.
Prognostic impact of APSS in untreated and treated patientsThe prognostic impact of the APSS was assessed in 3 subgroups of the current Asian cohort: primary untreated patients (N = 727); patients treated with HMA with data censored at the time of HSCT (N = 388); and patients receiving allogeneic HSCT (N = 122) (Supplementary files 21–23). The APSS was predictive of outcomes in all 3 groups of patients (Untreated patients: C-index for OS 0.74, C-index for LFS 0.74, C-index for TTP-sAML 0.79; patients treated with HMA: C-index for OS 0.69, C-index for LFS 0.64, C-index for TTP-sAML 0.66; patients receiving allo-HSCT: C-index for OS post-HSCT 0.61, C-index for LFS post-HSCT 0.63, C-index for TTP-sAML post-HSCT 0.62) (Supplementary files 21–23). The prediction was the best in primary untreated patients with clear separation of prognostic risk groups for OS, LFS, and TTP-sAML (P < 0.0001 for all 3) (Supplementary file 21). In patients treated with HMA, the APSS was significant for the prediction OS, LFS, and TTP-sAML (P < 0.001 for all) (Supplementary file 22). Nevertheless, in patients receiving HMA, there was overlap between the very good, good, and intermediate-1 risk categories for OS; between the very good, good, and intermediate-1 risk categories and between intermediate-2 and poor risk categories for LFS; and between the very good, good, and intermediate-1 risk categories for TTP-sAML. In patients receiving allo-HSCT, APSS was significantly predictive of post-HSCT OS (P = 0.01) and post-HSCT LFS (P = 0.001), but not TTP-sAML post HSCT (P = 0.24) (Supplementary file 23). In patients receiving allo-HSCT, there was overlap between the good, intermediate-1, intermediate-2, and poor risk categories for post-HSCT OS and post-HSCT LFS.
Comments (0)