
Remember me
After 1:1 PS-matching, baseline characteristics of patients from the ECLAP cohort (Table S1) were analyzed. The matched groups were all maintained with HCT < 45% either by phlebotomy alone (PHL, N = 207) or with HU (500–1500 mg/day, N = 207). PS matching ensured that the two groups were well balanced across key variables including demographics, prior thrombosis, median time since PV diagnosis, duration of follow-up, cardiovascular risk-factors, and blood counts. The only exception was a clinically insignificant difference in baseline HCT.
Events during follow-upAfter a median follow-up of 3 years (range 0.3–4.6) in the ECLAP study, outcomes and the effects of PHL or HU treatments on WBC, NLR, neutrophils, and lymphocytes were assessed at 12, 24, and 36 months. Total thromboses were registered in 44 patients (10.6%): of these, 24 events (5.8%) and 20 (4.8%) were arterial and venous, respectively. Disease progression was documented in 13 cases (3.1%): myelofibrosis in 11 (2.7%) and blast phase in 4 (1.0%). Solid tumors and deaths occurred in 18 (4.3%) and in 37 (8.9%) cases.
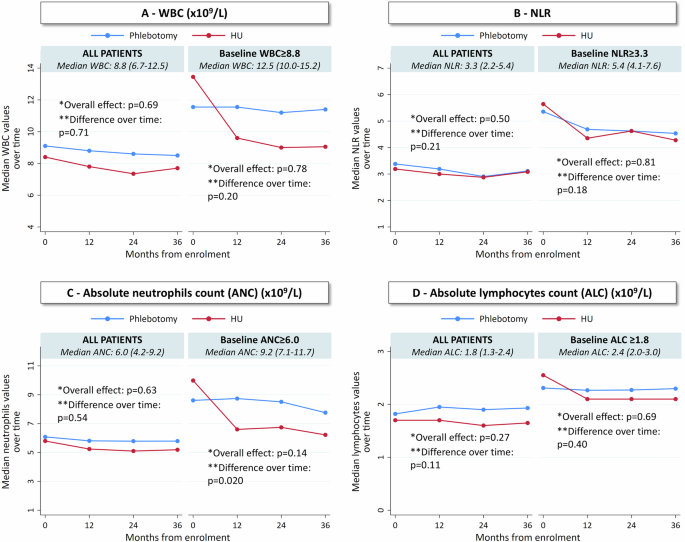
Effects of Phlebotomy and Hydroxyurea on Leukocyte BiomarkersFigure 1 shows 36-month trends in WBC, NLR, ANC, and ALC across the overall ECLAP cohort and in subgroups with elevated baseline values. PHL had no significant effects on any measure at any time. HU modestly reduced WBC over time, but this was not significantly different from PHL (p = 0.71, Fig. 1A). Neither PHL nor HU significantly reduced NLR in the full cohort (p = 0.21) or in those with elevated baseline NLR ≥ 3.3 (p = 0.18, Fig. 1B). HU significantly reduced ANC (p = 0.020) in patients with baseline ANC ≥ 6.0 × 10⁹/L, confirming its cytoreductive effect, but ANC remained stable in the full ECLAP cohort (p = 0.54, Fig. 1C). ALC remained largely unchanged (p = 0.11); however, in patients with baseline ALC ≥ 1.8 × 10⁹/L, HU drove a noticeable decline at 12 and 24 months, whereas PHL had no significant effect (Fig. 1D). As a result, HU’s reduction of ANC was offset by a parallel decrease in ALC, leading to no significant impact on NLR in patients with elevated baseline values.
Fig. 1: Longitudinal trend of WBC, NLR, neutrophils and lymphocytes in patients treated with hydroxyurea (HU) or phlebotomy (PHL), including subgroups with elevated baseline values (ECLAP database).
36-months trends of WBC (A), NLR (B), neutrophils (C), and lymphocytes (D) by treatment received in ECLAP database. The trend for the whole cohort and a focus on the subgroup of patients with high baseline values (above the median value) are reported in each panel. Global differences between the two treatments and differences over time were evaluated by a linear mixed-effect model with treatment, time and treatment-time interaction as fixed effects and patient as random intercept. *p-value for the main effect of treatment; **p-values for treatment-time interaction: a significant p-value indicates that the trend of each biomarker over time is different in the two arms, suggesting that the treatment affects how the parameter changes over time.
Figure S1 confirms these trends, showing that HU reduced WBC more significantly in patients with high baseline levels, where the relative reduction from baseline at 36 months was −27.4% compared to an increase of +5.2% in the PHL group (p < 0.001). While HU modestly lowered NLR (−10.4%) by 36 months, reductions in patients with high baseline NLR were not sustained. HU significantly reduced ANC, with the greatest decline (−32.6%) at 36 months in patients with baseline ANC ≥ 6.0 × 10⁹/L, whereas PHL had little effect (p < 0.001). ALC decline with HU was more pronounced at 12 and 24 months in patients with baseline ALC ≥ 1.8 × 10⁹/L but was not significantly different from PHL at 36 months (p = 0.19). HU lowered both ANC and ALC in parallel, limiting its ability to sustain NLR reduction. An initial NLR decline at 12 months, likely driven by ANC reduction, did not persist as ANC and ALC decreased together.
Impact leukocyte biomarkers on the risk of thrombosis and mortalityA multivariable Cox model (Fig. 2) showed that persistently high NLR ( ≥ 3.3) was significantly associated with increased mortality (HR: 3.59, p = 0.008) and total thrombosis (HR: 2.26, p = 0.013). As always, age was a risk factor for death (HR: 1.07, p = 0.001) and was borderline for thrombosis (p = 0.054). Cardiovascular risk factors strongly predicted thrombosis (HR: 4.92, p = 0.011). Changes in total WBC were not associated with these outcomes, highlighting NLR as a better risk predictor.
Fig. 2: Multivariable Cox model for the effect of inflammatory biomarkers on risk of total thrombosis and death (ECLAP database).
Estimates were obtained using a multivariable Cox regression model that included the effect of both WBC and NLR over time as time-dependent variables, adjusting for age, HU treatment, and cardiovascular (CV) risk factors (hypertension, hypercholesterolemia, diabetes, congestive heart failure, and smoking). Hazard ratios (HRs) for thrombosis (blue triangles) and mortality (red diamonds) were plotted with 95% confidence intervals (CIs) (solid lines). In this model, total thromboses were considered, rather than separating arterial and venous thromboses, to ensure adequate statistical power.
These results were confirmed using a joint model, which showed that higher longitudinal NLR values were associated with increased thrombotic and mortality risk (Table S4). Each unit increase in NLR corresponded to a 10% increase in the risk of thrombosis (HR 1.10, 95% CI: 1.02–1.18, p = 0.010) and death (HR 1.10, 95% CI: 1.02–1.17, p = 0.012).
Low-PV CohortBaseline characteristics of PHL and Ropeg groupsTable S2 compares baseline characteristics in the Low-PV database between PHL- and Ropeg-treated patients. The Ropeg group had more males (73% vs. 62%) and a slightly higher median age (52 vs. 48 years). Cardiovascular risk factors were similar (48% vs. 55%), with comparable frequency of hypertension, hypercholesterolemia, and diabetes. Hematologic parameters, including hematocrit, platelet, and leukocyte counts, were also similar.
Trends Over Time in Leukocyte-Derived Biomarkers comparing PHL vs. RopegFigure 3 shows 12-month trends in WBC, NLR, ANC, and ALC across the entire Low-PV cohort and in the subgroups with elevated baseline values. Across all patients, PHL had minimal effects on any of these measures but in those with elevated baseline values, WBC, ANC and NLR tended to increase over time. In contrast, Ropeg significantly reduced WBC, NLR, and ANC. WBC was stably reduced by Ropeg (p < 0.001), whereas PHL resulted in stable or slightly increasing levels. In patients with baseline WBC ≥ 8.8 × 10⁹/L, Ropeg produced a continuous decline, while PHL had little impact (p < 0.001, Fig. 3A). Ropeg progressively reduced NLR (p = 0.018), while PHL-treated patients showed stable or increasing values. In patients with baseline NLR ≥ 3.3, Ropeg’s effect was stronger, leading to a significant decline (p < 0.001, Fig. 3B), driven primarily by strong neutrophil suppression and relative lymphocyte sparing. Ropeg continuously suppressed ANC (p < 0.001), particularly in patients with baseline ANC ≥ 6.0 × 10⁹/L, where neutrophil levels declined progressively, while PHL had little effect or even a slight increase (Fig. 3C). Lymphocyte levels remained stable in both groups (p = NS, Fig. 3D).
Fig. 3: Longitudinal trend of WBC, NLR, neutrophils and lymphocytes in patients treated with Ropeginterferon (Ropeg) or phlebotomy (PHL), including subgroups with elevated baseline values (Low-PV database).
12-months trends of WBC (A), NLR (B), neutrophils (C), and lymphocytes (D) by treatment received in Low-PV database. The trend for the whole cohort and a focus on the subgroup of patients with high baseline values (above the median value) are reported in each panel. Global differences between the two treatments and differences over time were evaluated by a linear mixed-effect model with treatment, time and treatment-time interaction as fixed effects and patient as random intercept. *p-value for the main effect of treatment; **p-values for treatment-time interaction: a significant p-value indicates that the trend of each biomarker over time is different in the two arms, suggesting that the treatment affects how the parameter changes over time.
Figure S2 confirms these trends, showing the relative changes in biomarkers from baseline. Ropeg reduced WBC by −45.5% overall and −46.8% in patients with baseline WBC ≥ 8.8 × 10⁹/L, while PHL increased WBC by +11.3% (p < 0.001), confirming Ropeg’s strong cytoreductive effect. Ropeg decreased NLR by −26.6% overall and −36.3% in patients with baseline NLR ≥ 3.3, whereas PHL increased NLR by +5.4% (p < 0.001). Ropeg reduced ANC by −50.9% overall and −56.7% in high ANC patients, while PHL increased ANC ( + 18.9%) (p < 0.001), explaining most of the NLR decline. Although Ropeg also reduced ALC (−32.0% overall, −37.0% in high ALC patients), the NLR drop resulted from the relatively stronger neutrophil suppression compared to lymphocyte depletion.
Correlation between changes in Leukocyte-Derived Biomarkers and JAK2V617F VAFA significant correlation between changes in WBC, NLR, ANC and JAK2V617F allele burden (Pearson’s r = 0.43, r = 0.45 and r = 0.51; p < 0.001, p = 0.002 and p < 0.001) was found (Figure S4). In contrast, changes in ALC showed no statistically significant correlation with JAK2V617F VAF reduction (r = 0.20; p = 0.18), suggesting that the predictive utility of NLR is primarily driven by neutrophil dynamics. In the subgroup of patients with elevated baseline levels of inflammatory biomarkers, the same results were found (Figure S5).
Direct comparison of Ropeg versus HU within PROUD-PV/CONTINUATION-PV studiesBaseline characteristics of HU and Ropeg groupsBaseline patient characteristics (i.e. at screening in PROUD-PV) among patients who enrolled in the long-term CONTINUATION-PV study are shown in Table S3. The treatment arms were well balanced regarding demographic and other parameters such as time since diagnosis of PV and JAK2V617F VAF.
Head-to-Head Comparative trajectories in Leukocyte-Derived Inflammatory BiomarkersFigure 4 shows comparative 60-month trajectories in leukocyte-derived inflammatory biomarkers from the PROUD-PV/CONTINUATION-PV trial, aligning with findings from ECLAP for HU and Low-PV for Ropeg. Ropeg led to a more sustained WBC reduction than HU in both the overall cohort and in patients with baseline WBC ≥ 10.9 × 10⁹/L (p < 0.001, Fig. 4A). Ropeg progressively reduced NLR, while HU showed an initial decline followed by an increase (p = 0.004, Fig. 4B), with a stronger effect in patients with baseline NLR ≥ 4.3. Ropeg also stably and progressively reduced ANC, whereas HU initially lowered ANC but this effect was lost over time (p < 0.001, Fig. 4C), particularly in patients with baseline ANC ≥ 7.8 × 10⁹/L. Both treatments reduced ALC, and although Ropeg had a greater effect initially, especially in patients with baseline ALC ≥ 1.8 × 10⁹/L (Fig. 4D), the difference with HU did not persist past 48 months.
Fig. 4: Longitudinal trend of WBC, NLR, neutrophils and lymphocytes in patients treated with Ropeginterferon (Ropeg) or hydroxyurea (HU), including subgroups with elevated baseline values (PROUD-PV/CONTINUATION-PV database).
60-months trends of NLR values by treatment received in PROUD-PV/CONTINUATION-PV. The trend for the whole cohort and a focus on the subgroup of patients with high baseline values (above the median value) are reported in each panel. Global differences between the two treatments and differences over time were evaluated by a linear mixed-effect model with treatment, time and treatment-time interaction as fixed effects and patient as random intercept. *p-value for the main effect of treatment; **p-values for treatment-time interaction: a significant p-value indicates that the trend of NLR over time is different in the two arms, suggesting that the treatment affects how the parameter changes over time.
Figure S3 confirms these findings, showing relative changes from baseline in each biomarker. Ropeg induced a greater and more sustained WBC reduction than HU, with significant differences emerging from 24 months onward (p < 0.001). At 60 months, WBC decreased by −67.3% with Ropeg vs. −45.1% with HU (p < 0.001) in patients with baseline WBC ≥ 10.9×10⁹/L. Ropeg reduced NLR by −38.5% vs. −19.1% with HU (p = 0.045), with an even more pronounced effect in patients with baseline NLR ≥ 4.3. Ropeg also produced a deeper and sustained ANC reduction, achieving −65.8% vs. −44.4% with HU (p = 0.002), particularly in patients with baseline ANC ≥ 7.8 × 10⁹/L. Ropeg led to a greater ALC decline at 12 months (−37.8% vs. −28.4% with HU, p = 0.025), but at 60 months, ALC reductions with Ropeg (−34.7%) and HU (−30.3%) were not significantly different (p = 0.13). These results from this randomized, prospective clinical trial underscore Ropeg’s stronger impact on neutrophil suppression, its ability to modulate inflammation, and its capacity to better maintain lymphocyte balance compared to HU.
Correlation between NLR and JAK2V617F VAF levelsNLR was strongly associated with JAK2V617F VAF in the PROUD-PV/CONTINUATION-PV cohort (p < 0.001), with greater NLR reductions correlating with larger JAK2V617F VAF declines at 12 months (Fig. 5A). A similar trend was observed in the Low-PV cohort (p = 0.002), where patients with unchanged NLR had only a minor JAK2 VAF reduction (−13.0%), while those with >50% NLR reduction showed the most significant VAF decline (−59.3%) (Fig. 5B).
Fig. 5: Median relative changes in JAK2V617F VAF at 12 months according to categories of NLR reduction in patients treated with Ropeginterferon: PROUD-PV/CONTINUATION-PV database (Panel A) and Low-PV database (Panel B).
This figure illustrates the median relative changes in JAK2V617F VAF at 12 months in patients treated with Ropeginterferon in the PROUD-PV/CONTINUATION-PV and Low-PV studies, stratified by the extent of NLR reduction.
Outcomes related to NLR in PROUD-PV/CONTINUATION-PVEvent-free survival (EFS)—with events including thrombosis, progression to myelofibrosis/AML, or death—was significantly better in patients with NLR < 4.3 at the last assessment compared to those with NLR ≥ 4.3 (Log-rank p = 0.006) (Fig. 6). In this exploratory analysis, PV related events occurred in 9/44 vs. 8/125 patients in the high and low NLR groups, respectively (HR: 3.50, 95% CI 1.35–9.09, p = 0.010).
Fig. 6: Event-free survival by NLR category at last available assessment in PROUD-PV/CONTINUATION-PV.
Association between NLR at last available assessment and the occurrence of risk events (thromboembolic events, disease progression to myelofibrosis or acute myeloid leukemia, or death) shown by time-to-first-risk-event analysis in subgroups based on NLR over or under the threshold of 4.3 (the median level recorded at baseline).
Figure 7 illustrates the frequency of events based on NLR dynamics. Patients with persistently low NLR had the lowest frequency (4.3%), while those with persistently high NLR had the highest (25.0%). Importantly, those with persistently high or rising NLR were significantly more likely to experience a PV event than those with persistently low or decreasing NLR (9/44, 20% vs. 8/125, 6.4%, Fisher’s p = 0.016, odds ratio 3.7-fold higher).
Fig. 7: Percentage of patients with events (thromboembolic events, disease progression to myelofibrosis or acute myeloid leukemia, or death) by NLR at baseline and last available assessment in PROUD-PV/CONTINUATION-PV.
The figure shows the proportion of patients experiencing events based on NLR categories. Patients were categorized based on their baseline and final NLR values into four groups: (i) persistently low NLR (low NLR at baseline and at the final assessment), (ii) increasing NLR (low NLR at baseline but high NLR at the final assessment), (iii) decreasing NLR (high NLR at baseline but low NLR at the final assessment), and (iv) persistently high NLR (high NLR at both baseline and final assessment). The cutoff used to define high and low values corresponds to the median baseline NLR of 4.3.
Comments (0)