
Remember me


The semi-automated robotic puncture assistance system used in this study is shown in Fig. 1. As described in the previous research, the system comprises a 7 degree-of-freedom (DOF) robotic arm equipped with a US probe. Under the supervision of a physician, the robotic arm performs automated probe scanning and assists with puncture procedures. A six-axis force sensor is connected to the base of the US probe to ensure patient safety, and the system is configured to perform an emergency stop if the contact force exceeds 30 N. The system consists of two primary components: preoperative planning and intraoperative navigation. The workflow for operating the system is divided into the following six steps, as shown in Fig. 2.
Fig. 1
The overview of the puncture robot system
Fig. 2
The workflow of the puncture navigation using 3D US–CT fusion
1.Preoperative Planning: Using preoperative planning software, a 3D anatomical model of the abdomen and a 3D CT point cloud of the intrahepatic blood vessels are constructed based on contrast-enhanced CT images. Physicians can intuitively define a safe puncture path on the 3D model. The planned puncture path and the 3D CT point cloud of the intrahepatic vessels are utilized during intraoperative navigation.
2.Coarse Alignment of the Robotic System: In the initial step of intraoperative navigation, the robotic arm is positioned by the physician at an anatomical landmark located along the midline of the body. The xiphoid process is recommended as the reference point. Once positioned, the robotic system automatically aligns the CT coordinate system with the robotic arm’s coordinate system to correspond with the landmark and probe position.
3.Preparation for Fine Alignment of the Robotic System: The probe is positioned by the physician at an intercostal position where intrahepatic blood vessels are clearly visible. One of the major strengths of our system is that it does not rely on specific anatomical landmarks such as tumors, and scanning any intrahepatic vessel is sufficient. This is because the fusion between US and CT is achieved by using geometry of blood vessels, which is an anatomical feature of the human body. This approach allows the physician to select intrahepatic vessels with high visibility and perform the scan, which can be particularly beneficial for inexperienced physicians who may find it difficult to capture specific anatomical structures. After instructing the patient to hold their breath, the physician activates the foot switch to initiate automated scanning by the robotic arm. The robotic arm scans the probe in a sweeping motion, tilting the US imaging plane by ± 15 deg relative to the probe's tip over approximately 5 s.
4.3D US–CT Fusion (Fine Alignment): The US images acquired during the scanning process are transmitted to the system, which constructs a 3D US point cloud of blood vessels. Subsequently, a feature-based registration method using an improved Iterative Closest Point (ICP) algorithm is employed to align the 3D CT point cloud with the US point cloud. Since the coordinate systems of each modality have already been brought closer by the coarse registration, the risk of converging to a global–local minimum is reduced.
5.Movement to the Puncture Position: Based on the results of the 3D US–CT fusion, the system automatically calculates the transition path from the current fan scan position to the puncture path location defined in the preoperative plan. The physician activates the foot switch, and the robotic arm automatically moves to the puncture path location.
6.Puncture Procedure: The puncture guide mechanism is attached to the robotic arm, and the physician manually inserts the needle while monitoring the real-time US images.
Development of AI for blood vessel recognition in ultrasound imagesIn our previous research, we trained blood vessel segmentation models using ultrasound data of the liver from phantoms and pigs, but these models did not perform well in human liver recognition. Therefore, an AI model trained with patient US images was constructed in this study. To ensure that the acquisition conditions matched those during intraoperative navigation, only US images acquired using the robotic system from patients were used as training data. Specifically, all US images obtained through fan-shaped scans using the US probe attached to the robotic system’s end-effector were utilized. After being processed to ensure that no personal information could be identified, the US images were annotated by physicians to mark the locations of the blood vessels. An example of the annotation is shown in Fig. 3.
Fig. 3
Example of annotation by the physician
A total of 6828 US images were used to train an improved U-net model based on fivefold cross-validation. In this approach, the entire dataset was divided into five equal subsets, where one subset was used as the validation dataset, and the remaining four subsets were used as the training dataset. This process was repeated five times, changing the combination of training and validation datasets, ensuring that each image was used as validation data once. This method enhances the generalization performance of the model.
An example of the segmentation results for the validation data is shown in Fig. 4. The contours of the physician-annotated blood vessels are indicated by green lines, while the segmented regions produced by the AI model are highlighted in red. A high degree of agreement between the two regions was observed. For quantitative evaluation, the mean Dice coefficient of the entire validation dataset was calculated. The result was 0.87, indicating a high similarity between the annotated labels and the segmentation results. The details are presented in Table 1.
Fig. 4
Segmentation results of the validation data
Table 1 Details of training data and DICE coefficientExperiment and resultsA clinical experiment using the robotic system equipped with the developed AI model was conducted on five adult male and female participants. This study was approved by the Waseda University Ethics Committee (Approval Number: 2024–328). The primary objective of the clinical experiment was to assess the accuracy of the fusion system, which synchronizes contrast-enhanced CT and US images through human testing, and to evaluate its potential utility in puncture navigation for further system improvement.
Experimental approachFigure 5 shows the clinical experiment setting. A 3D CT point cloud of the intrahepatic blood vessels was pre-constructed using preoperative planning software based on CT images with a slice thickness ranging from 1.0 to 2.5 mm. Figure 6 presents the constructed 3D CT point cloud. The CP classifications of each participant are shown in Table 2; participants 1 and 2 had no history of liver disease, while participants 3–5 were evaluated based on their CP classifications. The trial was conducted following a two-step procedure.
Fig. 5 Fig. 6
Three-dimensional CT point cloud of the participant constructed by preoperative planning
Table 2 The Child–Pugh classification of each subject 1.Coarse Alignment of the Robotic System: The robotic arm was positioned by the physician on the chest skin above the xiphoid process, where it could be confirmed in the US image. To ensure accurate coarse alignment with CT slices, the US probe cross-section was carefully placed parallel to the horizontal plane of the body.
2.Fine Alignment of the Robotic System: As shown in Fig. 5, the robotic arm was positioned by the physician on the intercostal skin where intrahepatic blood vessels were visible in the US image. To reduce interference from bony structures during fan-shaped scanning, the probe was aligned parallel to the ribs. After the participant was instructed to hold their breath, the robotic arm performed automated fan-shaped scanning, and US images were acquired. Using the acquired US images, 3D US–CT fusion was performed based on a feature-point registration method.
To evaluate variability in the results, multiple trials were conducted for each participant. For participants 1 and 2, who had no history of liver disease, the intrahepatic blood vessels were clearly visible in the US images, and five trials were performed for each. On the other hand, for participants 3–5, decreased visibility of blood vessels due to liver cirrhosis was observed. Since the proposed system relies on blood vessels visible in US images, it cannot be applied when blood vessels are undetectable. Therefore, for participants 3–5, results from three trials in which the blood vessels were deemed visible were obtained. Cases where the blood vessels were not visible are discussed as limitations of the system in the following section.
Analytical approachTo quantitatively evaluate the degree of correspondence between the point clouds in 3D US–CT fusion, the Root-Mean-Square Error (RMSE) was first examined. RMSE is defined by Eq. (1):
$$\text=\sqrt\sum_^_\right)}^}$$
(1)
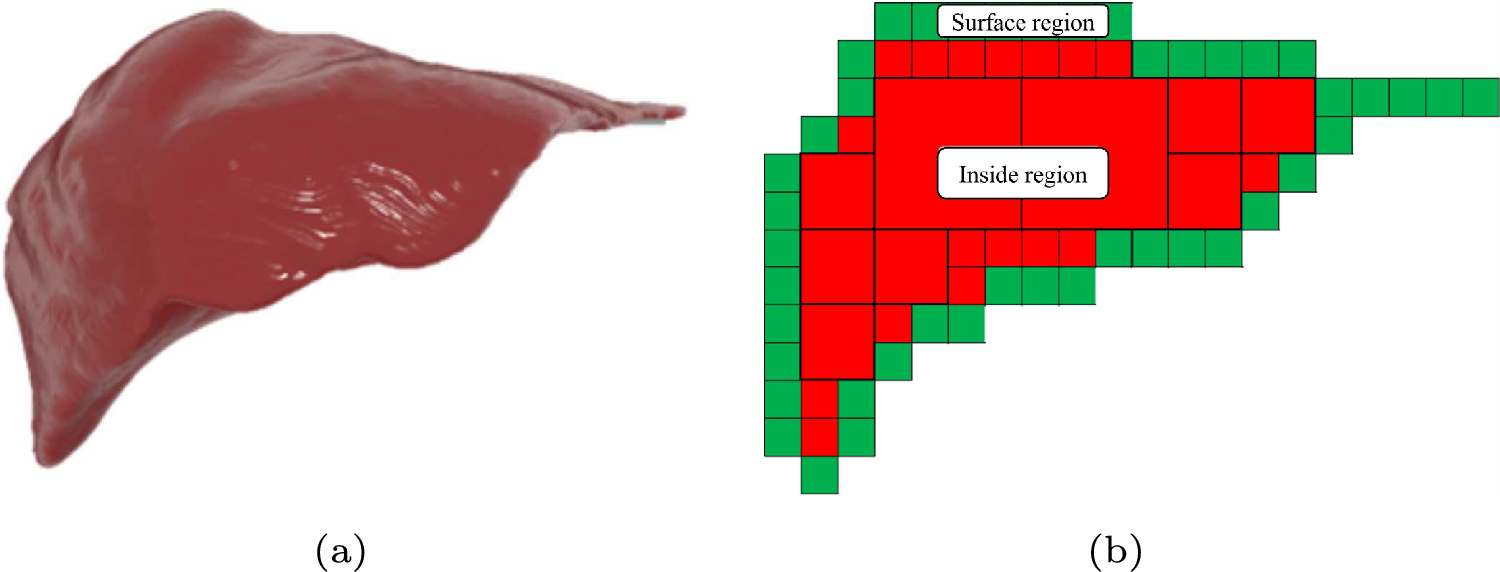
where N represents the number of corresponding points, and di is the Euclidean distance between each corresponding point pair. RMSE is used as an index to measure the correspondence of point cloud assuming that the error distribution follows a Gaussian distribution [11]. Certain challenges may affect the evaluation of the blood vessel point cloud in this study. The blood vessel point cloud exhibits a hollow structure, as shown in Fig. 7, and a size difference between the point clouds due to modality differences was also observed. Consequently, calculating the RMSE for blood vessel point clouds from different modalities tends to amplify the impact of errors. Similar metrics, such as the Chamfer distance and Hausdorff distance, also show susceptibility to the influence of outliers in the US point cloud.
Fig. 7
Issues in RMSE and the use of centroids
In fusion evaluation, the overall alignment of anatomical structures is considered more important than the positions of individual points. For blood vessel structures, the centerline of the blood vessels represents the overall structural position. Therefore, as shown in Fig. 7, the centroids of the two point clouds PUS_centor and PCT_centor, which approximate the centerlines of the vessels, were calculated, and the distance D between them was used as the evaluation metric. The centroid distance D is defined by Eqs. (2)–(4):
$$_\_\text}=\frac\sum_^_^$$
(2)
$$_\_\text}=\frac\sum_^_^$$
(3)
$$D=\sqrt^_\_\text}^-_\_\text}^\right)}^}$$
(4)
The acquired point cloud underwent preprocessing to calculate the evaluation index. In this robotic system, blood vessel points clouds that appear in only one modality may exist due to differences in US image shadowing, contrast levels, or the timing of contrast-enhanced CT imaging. When calculating the centroid distance for the entire point cloud, the errors become large, making accurate evaluation difficult. Therefore, blood vessel point cloud for centroid distance calculation was extracted according to the following three steps, as summarized in Fig. 8:
Fig. 8
Analysis procedure of the 3D US–CT fusion results
1.Extraction of the Primary Blood Vessel Point Cloud from the US Point Cloud: To extract the largest blood vessel point cloud from multiple point cloud, the Density-Based Spatial Clustering of Applications with Noise (DBSCAN) algorithm was applied. The parameters were set to eps = 1.0 and "minimum points" = 10.
2.Extraction of Corresponding CT Blood Vessel Point Cloud: To extract the corresponding blood vessel region from the CT point cloud, a bounding box that minimally covered the primary US blood vessel point cloud was used to segment the CT point cloud. Subsequently, the same DBSCAN parameters were applied.
3.Extraction of the Evaluation Point Cloud: To remove the influence of point cloud present only in one modality, the point clouds were trimmed to retain only the common blood vessel branches observed in both modalities. A fixed cutting length was set to standardize the process.
EvaluationAll point clouds obtained from each participant are shown in Fig. 9. The upper section of the figure shows the point clouds from each modality, trimmed using bounding boxes, while the lower section shows the extracted evaluation point clouds and centroids. The results of the 3D US–CT fusion demonstrated that the point clouds from the two modalities were in proximity, which was qualitatively confirmed. The distances between the centroids calculated from the evaluation point clouds are presented in Table 3. In this trial, the minimum centroid distance in the 3D US–CT fusion was 0.38 mm, the maximum was 4.81 mm, and the average across all 16 trials was 1.97 mm.
Fig. 9
Extraction Results of Blood Vessel Point Clouds for All Participants
Table 3 Calculation results of centroid distanceThe standard deviation of the centroid distances was 1.03 mm, with the average + 3σ range reaching 5.07 mm. Although all results in this study met the target accuracy, further improvement in the recognition accuracy of US point cloud is essential to ensure that the system consistently meets the target value over the long term.
The blood vessels used in this study had a complex structure, and appropriate preprocessing was performed due to differences in the point cloud shapes between the modalities. On the other hand, for deep veins such as the femoral and popliteal veins, which have relatively linear paths, methods have been proposed to approximate cross-sections of vessels in US images as ellipses to estimate the vessel course [12]. Based on these studies, further development of new methods is required to estimate the centerline of complex hepatic vessels and to evaluate the overall correspondence of point cloud.
Limitations related to US image qualityFigure 10 presents US images with abundant blood vessels and sparse blood vessels acquired during the clinical experiment. Due to subcutaneous fat, liver cirrhosis, or a history of prior surgery, fan-shaped scans are unable to obtain sufficient US blood vessels information or even fail to obtain any US blood vessels at sometimes, which will lead to the failure of US blood vessel point cloud reconstruction. Although research efforts have been made to improve the imaging performance of blood vessels in US images, unclear images are often excluded [13]. In addition, in robotic control studies using vascular segmentation, limitations still persist in situations where blood vessels are scarcely visible or within complex anatomical environments such as the abdomen [14]. In our study, even for patients with liver cirrhosis and low blood vessel visibility, shape reconstruction of partial vascular geometry was sufficient to achieve the target fusion accuracy, except in cases where no vessels were visible at all. However, in patients with thicker fat layers or more severe disease, it becomes difficult to manually locate vessels. Therefore, it is necessary to develop a system that can assess the abundance of blood vessels when the probe is initially placed and guide the probe to a position where vessels are plentiful.
Fig. 10
Examples of abundant and sparse blood vessels obtained during the clinical experiment
Safety of the robotic systemDuring the clinical experiment, no force exceeding 30 N was detected by the six-axis force sensor connected to the base of the probe, even during probe movement by the physician or the robotic arm, as well as due to abdominal motion caused by breathing. Since the emergency stop was never triggered, these results suggest that the system maintains safe contact with the human body.
Comments (0)