Drug preparation
ESD consisted of two drugs (Table 1). The raw materials of the Chinese medicines used in this study were purchased from the Affiliated Hospital of Shandong University of Traditional Chinese Medicine (Jinan, China). Appropriate amounts of ginseng and danshen were soaked 10 times in 70% ethanol for 30 min, sonicated for 60 min, and filtered; subsequently, 70% ethanol was added five times, and the solution was sonicated for 30 min. After filtration, the filtrates were combined, concentrated by rotary evaporation, and freeze-dried.
Table 1 Prescription of ESDPreparation and composition analysis of the ESD standard solution
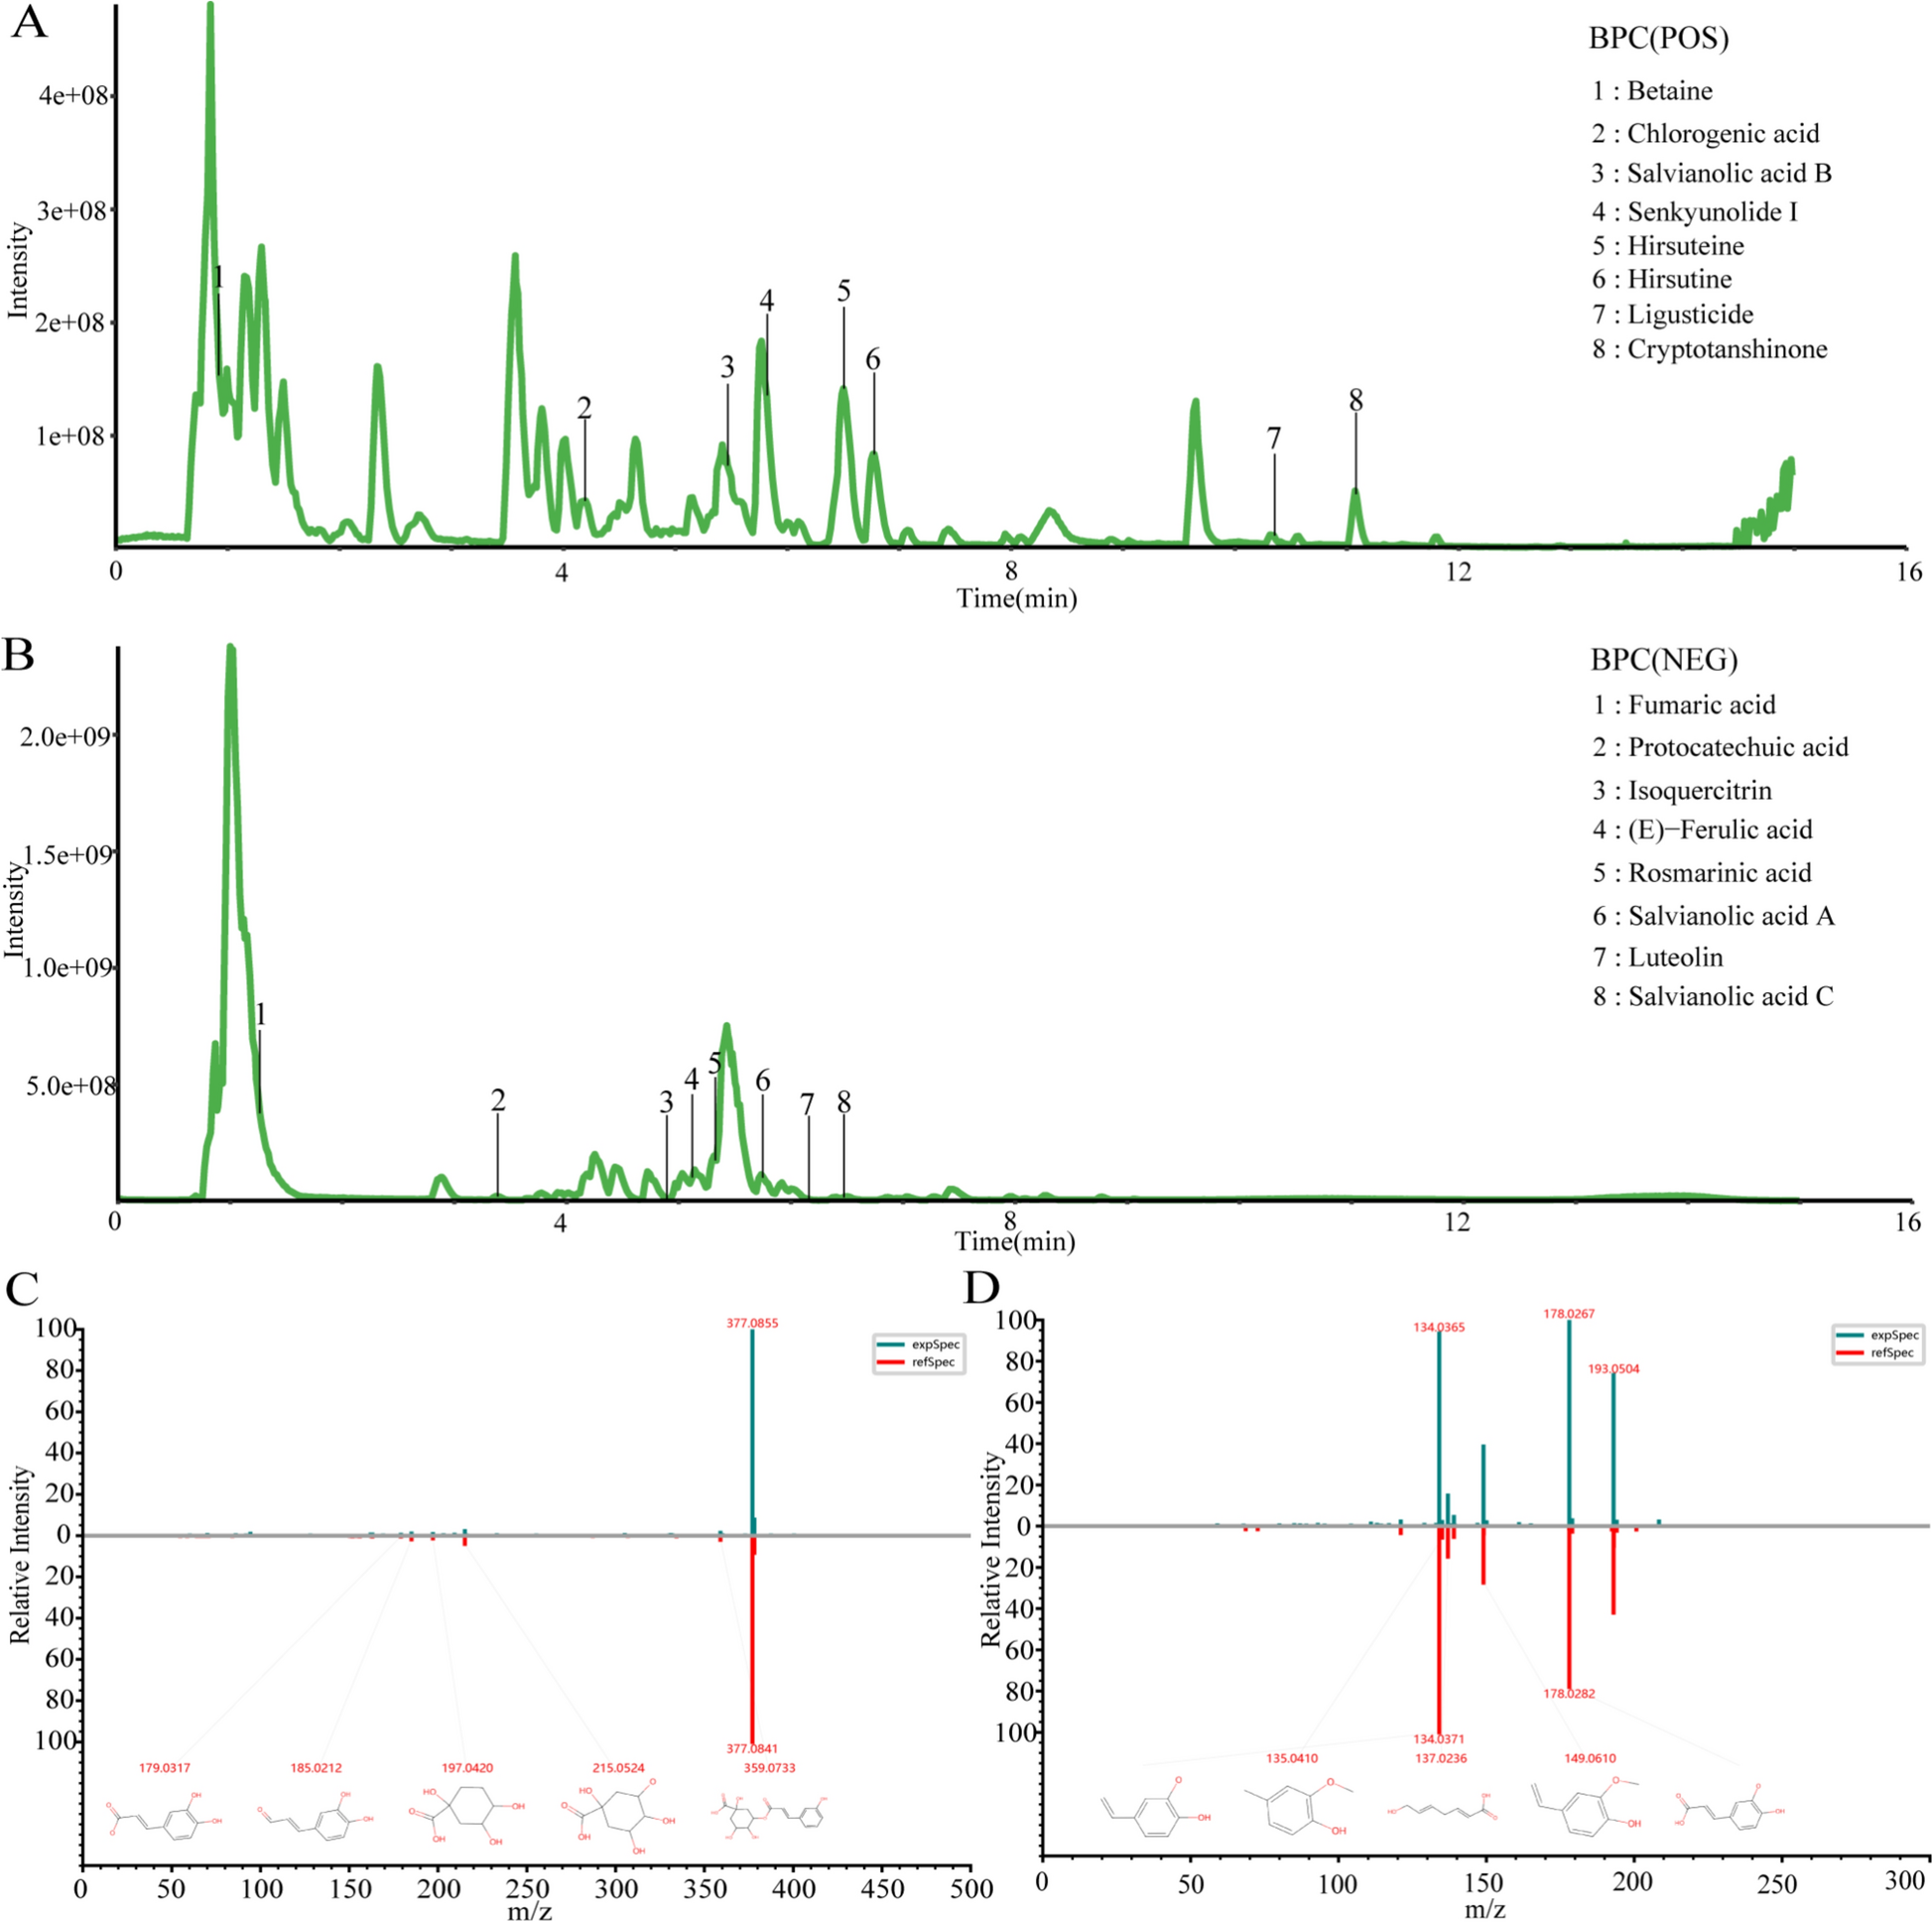
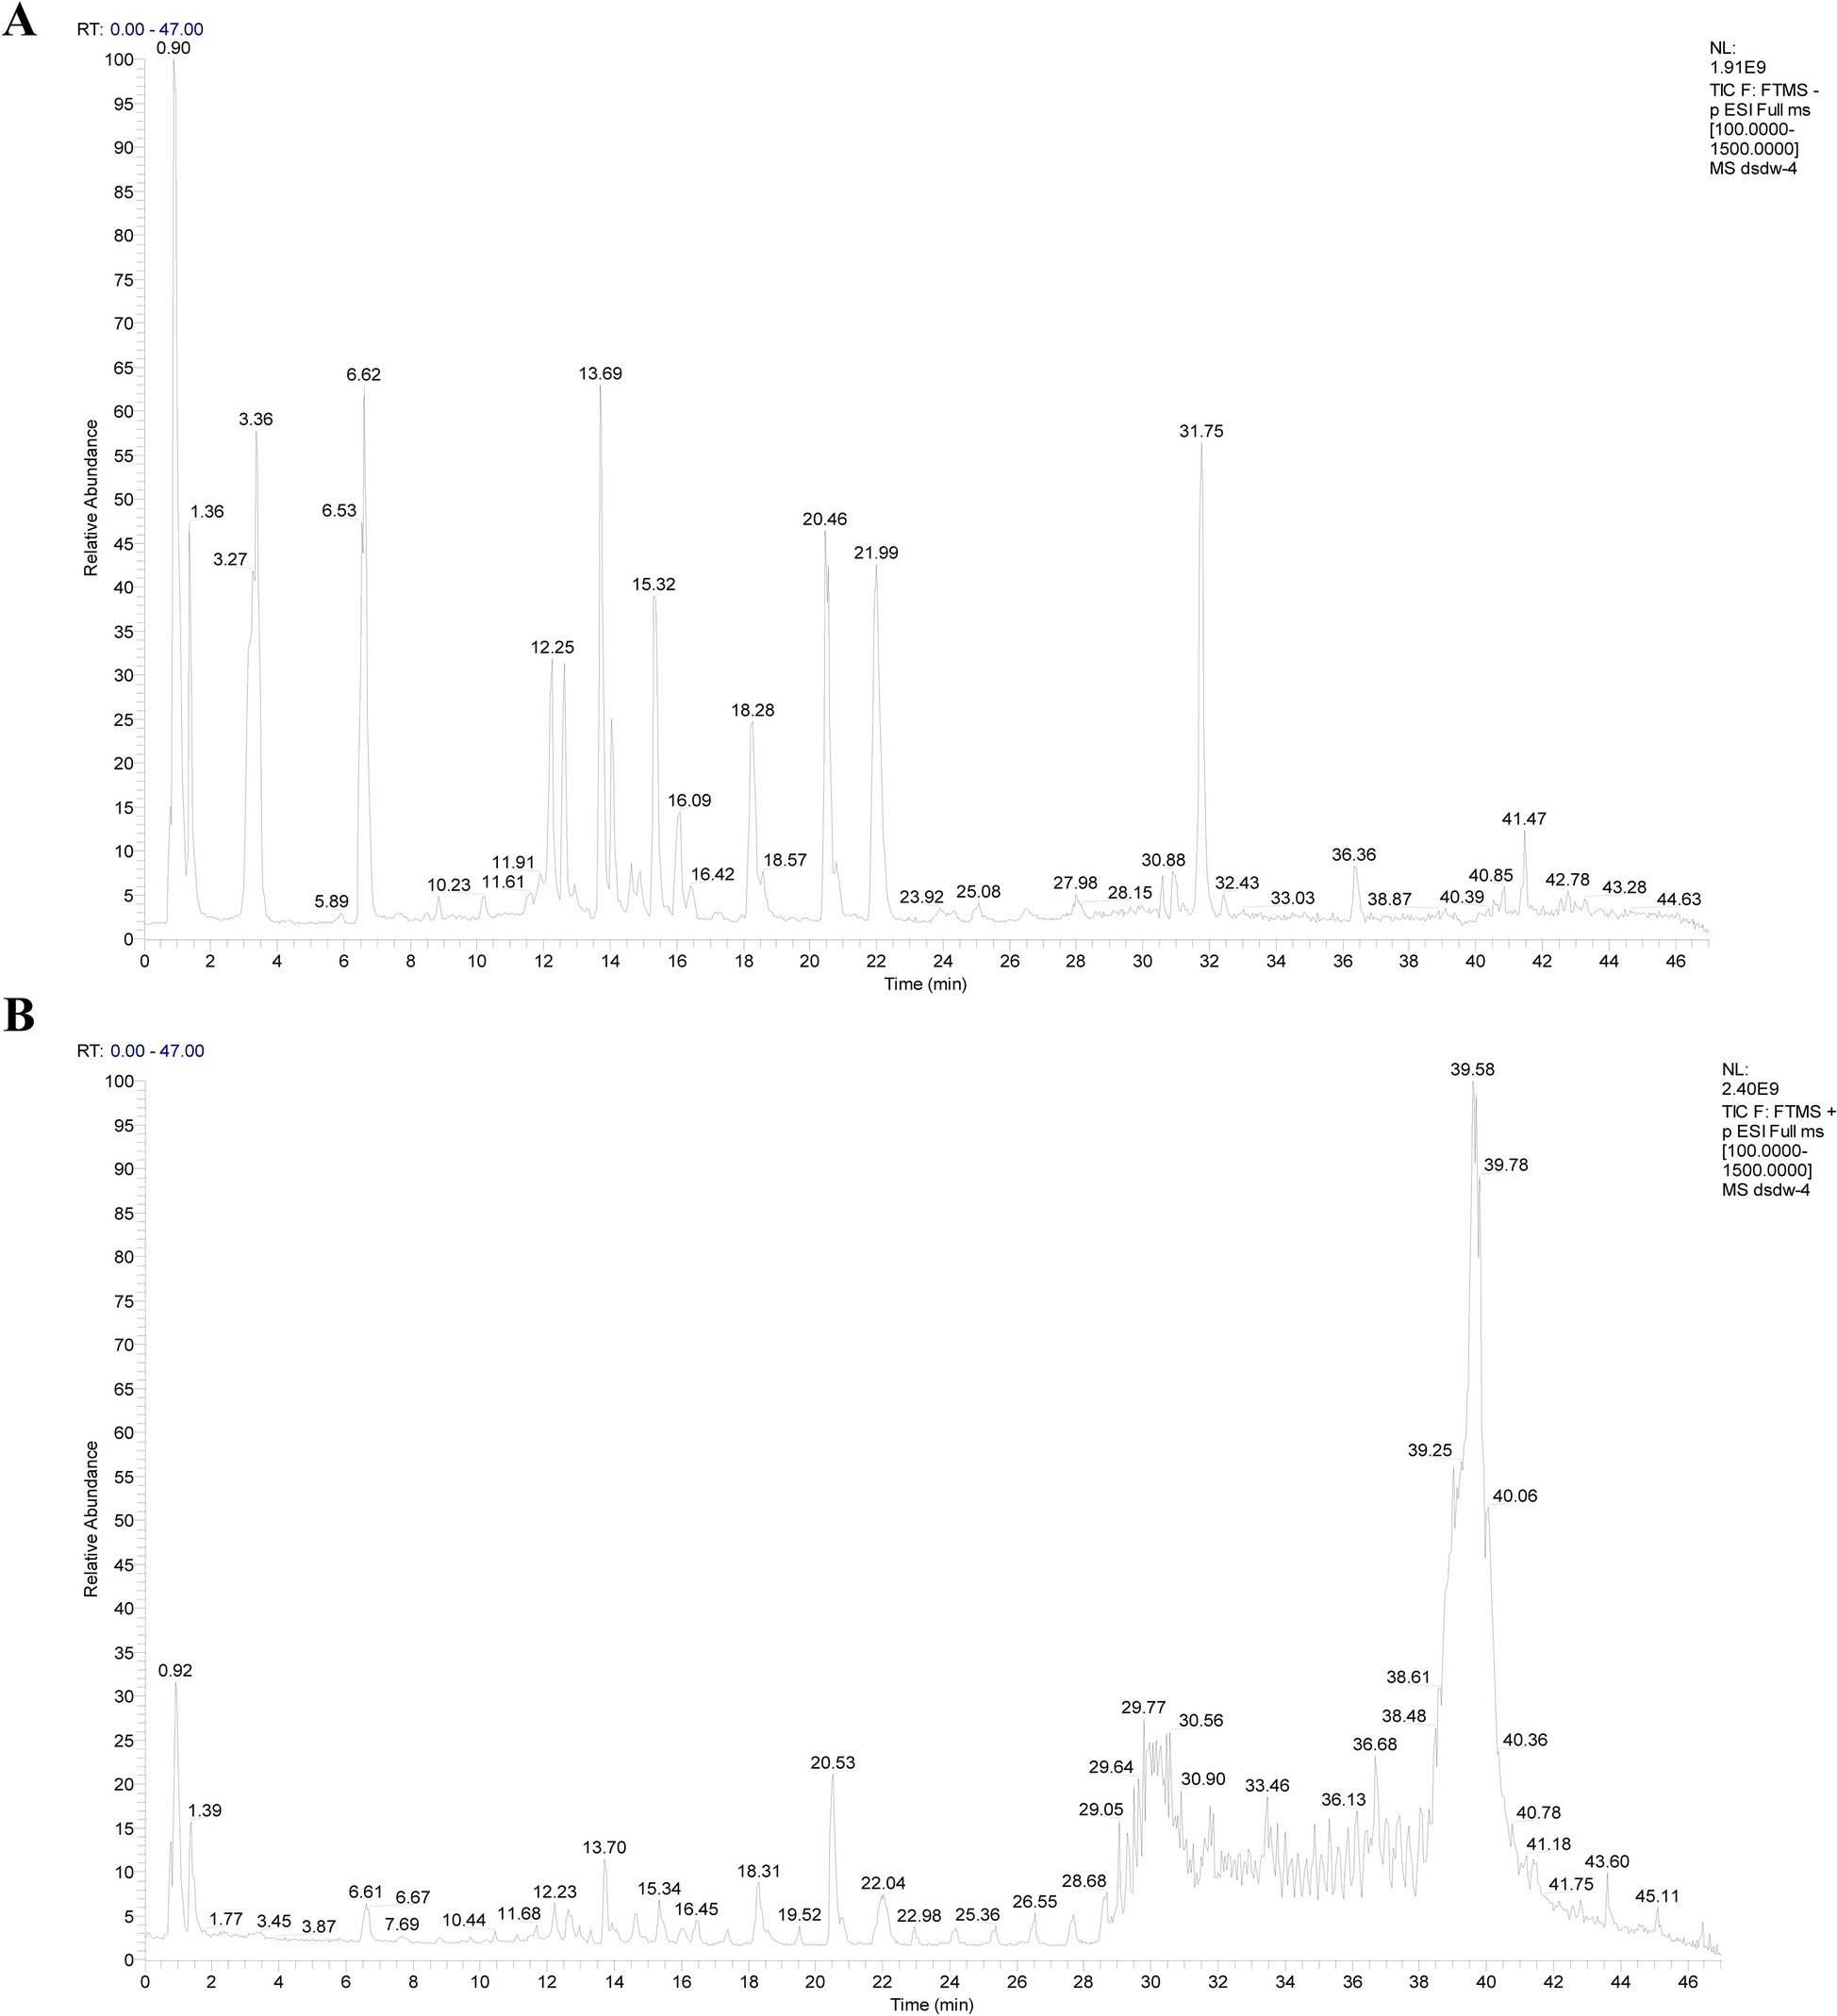
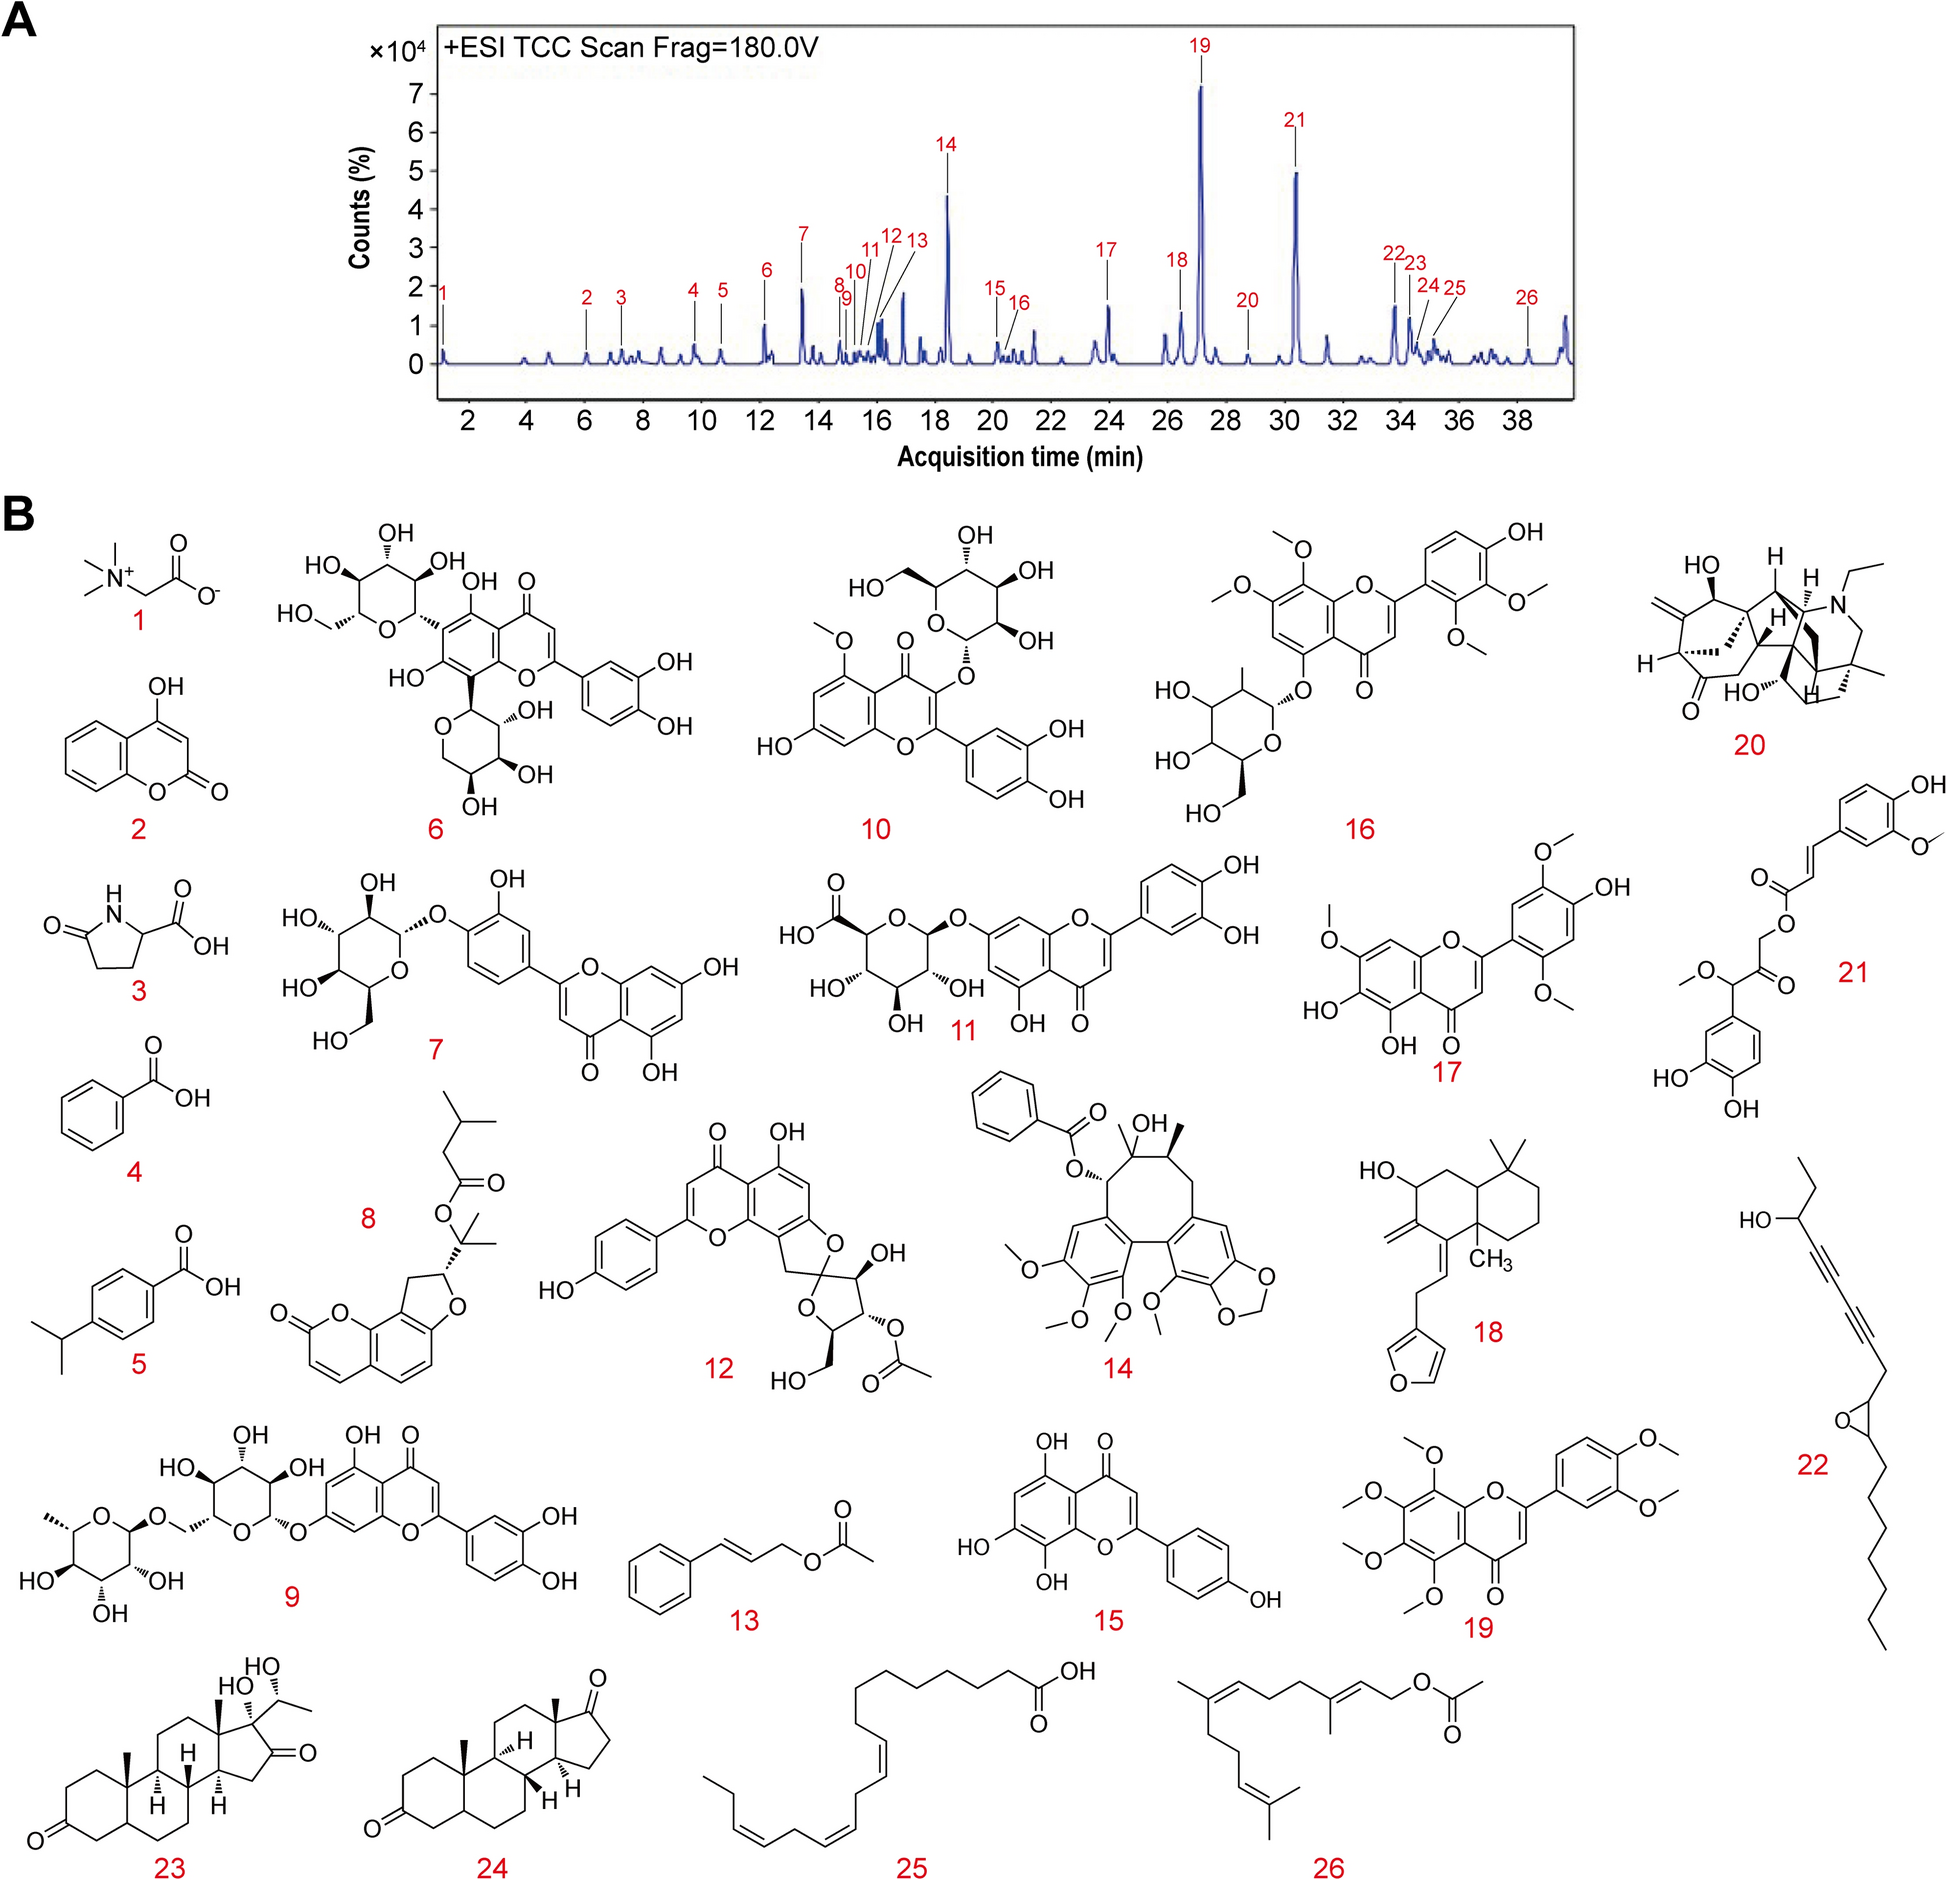
The ultra performance liquid chromatography (UPLC)-tandem mass spectrometry (MS/MS) analysis was conducted using the Ultimate 3000-Q-Exactive system (Thermo, USA). The chromatographic conditions were as follows: chromatographic column, ACQUITY UPLC HSS T13 (2.1 mm × 100 mm, 1.8 μm); mobile phase, acetonitrile solution (A) and 0.05% phosphoric acid solution (B); gradient elution conditions, 10–19% B over 0–8 min, 19–50% B over 8–35 min, 50–100% B over 35–40 min, 100–19% B over 40–42 min, and 19–19% B over 42–45 min; flow rate, 3 μL/min; injection volume, 250 μL; and column temperature, 30 °C. For mass spectrometry analyses, collection was conducted in the positive- and negative-ion modes, with the first and second-stage mass scans in the range of 80–1200 m/z and 200–2000 m/z, respectively, and collision energies of 20, 40, and 60 eV.
Animal model
In this study, an atherosclerosis model was established in ApoE−/− mice, and C57BL/6 J mice were used as blank controls. All mice were 6–7 weeks old, male, and weighed 18–20 g (Beijing Weitonglihua Co., Ltd.). After obtaining approval from the Experimental Animal Ethics Committee of Shandong University of Traditional Chinese Medicine, the animals were raised in the Animal Experiment Center (Ethics Number: SDUTCM20240103001). All mice were maintained on a 12-h light/dark cycle every day and provided free access to food and water. ApoE−/− mice were fed atherosclerotic model feed for 12 weeks to establish the atherosclerosis model. These mice were randomly divided into six groups according to body weight, with eight mice in each group. Rosuvastatin (RSV) (505286; Ariscan Pharmaceuticals Ltd., China) was used as the positive control and was administered at a dose of 10 mg/kg/day [13]. C57BL/6 J mice administered the same dose of phosphate-buffered saline (PBS) were considered as the control group. The drug treatment groups included the Er Shen Dan high-dose (ESD-H) group, in which mice were administered a dose of 6.24 g/kg/d; the Er Shen Dan medium-dose group (ESD-M), in which mice received a dose of 3.12 g/kg/d; and the Er Shen Dan Low low-dose group (ESD-L), in which mice were administered a dose of 1.56 g/kg/d. The drugs in the treatment groups were administered by gavage for 8 weeks. After the experiment, the mice were anesthetized with isoflurane (R510-22-10; RWD, China), and their serum was collected. After cardiac perfusion, the aorta was removed for the subsequent experiments.
Blood biochemical tests
The prepared serum samples were placed in the sample chamber (URIT-8026) of the analyzer, and the reagents required for testing were loaded. Low-density lipoprotein (LDL) (U83085045, URIT, China), triglyceride (TG) (U82781050, URIT)) and total cholesterol (TC) (U82885040, URIT) levels were measured, and the results were analyzed.
Enzyme-linked immunosorbent assay
Mouse blood was centrifuged at 3500 rpm and 4 °C for 15 min. The serum was stored at −80 °C. The tumor necrosis factor-α (TNF-α), interleukin (IL)−1β, and IL-6 levels in the serum of the mice were detected according to the instructions of the enzyme-linked immunosorbent assay (ELISA) kits. The MF-Mouse TNF-α ELISA Kit (RE1060MF), Mouse High Sensitivity IL-1β ELISA Kit (RE1074MG), and the MF-Mouse IL-6 ELISA Kit (RE3186MF) were purchased from Milbio Company (Shanghai, China).
Oil Red O staining
Complete blood vessels from the aortic arch to the bifurcation of the common iliac artery in mice were collected for gross Oil Red O staining. The entire aorta was removed from 4% paraformaldehyde and rinsed in 0.9% normal saline, and the excess fat was completely removed under an anatomical microscope. The mother liquor was prepared as a 1% Oil Red O staining solution. A total of 0.2 g of Oil Red powder (A600395-0050; Sangon Biotech Shanghai Co., Ltd., China) was dissolved in 20 mL of isopropyl alcohol and filtered through a filter paper. The 1% Oil Red O mother liquor was diluted with ultrapure water at a ratio of 3:2 to obtain a 0.6% Oil Red O working solution. The stripped aorta was immersed in 0.6% Oil Red O working solution and incubated at 37 °C for 10 min. The incubated aortas were then rinsed with 75% ethanol (20241014; Sinopharm Chemical Reagent Co., Ltd., China). Once the aortic wall returned to its normal milky white color, it was immediately rinsed with normal saline and then spread out for imaging under a stereoscopic fluorescence microscope (M205FA; Leica, Germany).
Hematoxylin and eosin, Masson, and Sirius red staining
The roots of the mouse aortas were embedded in paraffin, dehydrated, and sectioned. A hematoxylin and eosin (H&E) staining kit (AH0001; Wuhan Aoxing Biotechnology Co. Ltd., Wuhan, China), Masson staining kit (AH0002; Wuhan Aoxing Biotechnology Co., Ltd., China), and Sirius Red staining kit were used for the staining examinations. Staining was performed according to the manufacturer’s instructions to observe the plaque condition at the aortic root.
Network pharmacological analysis
Data for Panax ginseng C.A. Mey and Salvia miltiorrhiza Bge were retrieved through the Traditional Chinese Medicine Systems Pharmacology Database and Analysis Platform (TCMSP), and two oral parameters, bioavailability (OB) and drug likeness (DL), were used to preliminarily screen out activity components and albumen targets with OB ≥ 30% and DL ≥ 0.18. The relevant active ingredients screened from TCMSP and the active ingredients for which no relevant protein targets meeting the requirements were retrieved from this database were first included in the PubChem database to obtain the relevant Simplified Molecular Input Line Entry System (SMILE) nodes. The SwissTarget database was then used to retrieve the action targets of the relevant active ingredients. For the active components of the relevant protein targets that could not be obtained from TCMSP, PubChem was used to obtain the relevant active component action targets, and the active components of the relevant targets that could not be collected were deleted, integrated, and deduplicated. Standard gene names were obtained from the UniProt database. According to the Chinese Pharmacopoeia Commission, the main components of Panax ginseng C.A. Mey include ginsenoside Rg1, ginsenoside Rg3, ginsenoside Re, ginsenoside Rb1, and the main component of Salvia miltiorrhiza Bge is tanshinone I [12].
With “atherosclerosis” as the key word, atherosclerosis-related targets were obtained from the GeneCards, TTD, and OMIM databases. For the GeneCards database, targets with degree of correlation greater than 1 were selected. The target library for the disease was established by merging the three database targets and removing duplicates. Venn diagrams of the targets of Panax ginseng C.A. Mey, Salvia miltiorrhiza Bge, and atherosclerosis were drawn using a microbioinformatics platform to identify the common targets of drugs and diseases. Cytoscape software was used to construct a “disease—pathway—drug—active ingredient—target” network diagram, and the CytoNCA plugin was used to calculate the degree values of the nodes. Using the degree value as the screening criterion, the key active components of Panax ginseng C.A. Mey and Salvia miltiorrhiza Bge that act on atherosclerosis were screened. Common targets were submitted to the STRING database to construct a protein–protein interaction (PPI) network. The minimum interaction threshold was set as “medium confidence (0.400).” The.tsv files were loaded and imported into Cytoscape 3.9.1 for visual analysis. The median of these parameters was used as the screening criterion to identify the key targets of atherosclerosis that Panax ginseng C.A. Mey and Salvia miltiorrhiza Bge act on. Common targets were subjected to gene ontology (GO) and Kyoto Encyclopedia of Genes and Genomes (KEGG) enrichment analyses using the DAVID platform. The first 20 KEGG signaling pathways were visualized and analyzed using the microbioinformatics platform and SangerBox.
Molecular docking analysis
Key bioactive components were identified and retrieved in SDF format from the PubChem bioactivity database (https://pubchem.ncbi.nlm.nih.gov/). The SDF files were processed and converted into Protein Data Bank (PDB) format using Open Babel software. Concurrently, the three-dimensional (3D) structures of the critical target proteins were obtained from PDB (http://www.rcsb.org). The receptor and ligand structures were prepared and optimized using PyMOL and AutoDock Tools 1.5.7 software, generating PDBQT files for docking. Molecular docking was performed between the receptors and ligands using AutoDock Vina software. The resulting docking data were imported into PyMOL for visualization and analysis.
Molecular dynamics simulations
Molecular dynamics simulations were performed using Gromacs 2022. The system was constructed as follows: the Assisted Model Building with Energy Refinement (AMBER) 14SB force field was applied for proteins; the general AMBER force field (GAFF) was applied for small-molecule ligands; and the transferable intermolecular potential with 3 points (TIP3P) model was used for water molecules. The protein and small-molecule ligand files were merged to build a complex simulation system run under periodic boundary conditions. Simulation parameters were set as follows: an integration time step of 2 fs was used; all bonds involving hydrogen atoms were constrained using the linear constraint solver (LINCS) algorithm; electrostatic interactions were calculated using the Particle-Mesh Ewald (PME) method with a cutoff radius of 1.2 nm; and the cutoff value for van der Waals and other non-bonded interactions was set to 10 Å. Temperature and pressure were maintained using the V-rescale thermostat and Berendsen barostat methods, respectively, with target values of 298 K and 1 bar. The system first underwent NVT equilibration for 100 ps at 298 K, followed by 100 ps of NPT equilibration. After equilibration, a 100-ns production simulation was conducted at the same temperature and pressure, and trajectory snapshots were saved every 10 ps. After completion of the simulation, trajectory visualization and analysis were performed using VMD and PyMOL, and the binding free energy between the protein and the small-molecule ligand was calculated using the g_mmpbsa program using the MMPBSA method.
Western blotting
Radioimmunoprecipitation assay (RIPA) lysis buffer containing a phosphorylase inhibitor (P0013B; Beyotime, China) was added to mouse aortic tissue of a specific weight, and the samples were lysed on ice for 40 min. Next, the proteins were thoroughly homogenized using a tissue grinder, and the supernatant was centrifuged. For cell proteins, the culture medium was removed, and lysis buffer was added at a ratio of 150 μL per well in a 6-well plate. The samples were lysed on ice for 30 min, and the supernatant was centrifuged. The protein concentration in each sample was detected (P0010S; Beyotime, China); protein loading buffer (LT101L; Epizyme Biomedical Technology, China) was added; and the sample was denatured at 95 °C for 5 min.
The total protein sample was used to prepare the gel using the Omni-Easy™ one-step polyacrylamide gel electrophoresis (PAGE) gel rapid preparation kit according to the manufacturer’s instructions (PG212; Epizyme Biomedical Technology, China). The proteins were subsequently transferred onto a polyvinylidene difluoride (PVDF) membrane (IPVH00010; Millipore, USA) and blocked for 10 min with a protein-free rapid blocking solution (PS108P; Epizyme Biomedical Technology, China). Neurogenic locus notch homolog protein 1 (NOTCH1; 10062-2-AP; Proteintech, China), hairy and enhancer of split-1 (HES1; A0925; ABclonal, China), NOD-, LRR- and pyrin domain-containing protein 3 (NLRP3; 30109-1-AP; Proteintech, China), nuclear factor (NF)-κB p65 (10745-1-AP; Proteintech, China), phospho-NF-κB p65 (82335-1-RR; Proteintech, China), and NADPH oxidase 2 (NOX2; 19013-AP; Proteintech, China) were used. The secondary antibodies were a combination of goat anti-rabbit IgG (AS061; ABclonal, China) and goat anti-mouse IgG (SA00001-1; Proteintech, China) linked to the corresponding horseradish peroxidase (HRP) at room temperature. The PVDF membrane was overlaid with Sparkjade ECL super (ED0015-B, SparkJade, China), and the image was presented using a Tanon-5200 system (Shanghai, China). GAPDH (10494-1-AP, Proteintech, China) and β-actin (66009-1 g, Proteintech, China) were used as internal references, and gray scale values were calculated by ImageJ software.
Immunohistochemistry analysis
The roots of the mouse aorta were paraffin-embedded, dehydrated, dewaxed, rehydrated, and subjected to antigen repair. Antigen repair was performed using 5% bovine serum albumin (BSA), and CD86 (13395-1-AP; Proteintech, China) was diluted at a ratio of 1:800. The secondary antibody was labeled with HRP/AP and incubated at room temperature for 40 min. 3,3′-Diaminobenzidine (DAB) color development was performed under a microscope; hematoxylin counterstaining was performed; and finally, dehydration, transparency, and sealing treatments were performed.
Cell culture
RAW264.7 cells (CL-0190; Procell, China) were cultured in Dulbecco’s modified Eagle medium (DMEM) supplemented with 10% fetal bovine serum (BL205A; Biosharp, China) and 100 μL/mL penicillin/streptomycin (Beyotime Biotechnology, China) (C11995500BT, GIBCO, China) at 37 °C. Cells were cultured in an incubator with 5% carbon dioxide (Thermo Fisher Scientific).
Establishment of the cell model
RAW264.7 cells in the logarithmic growth phase were inoculated into 6-well plates (5 × 10⁵ cells/mL). After the cells adhered to the wall, 250 ng/mL lipopolysaccharide (LPS; L861706-5 mg; Macklin, China) and interferon-gamma (IFN-γ; HY-P7071; MCE) were added. After stimulation with 100 ng/mL for 24 h, the expression of the M1-type macrophage markers cyclooxygenase-2 (COX-2; AB188183; Abcam, UK) and inducible nitric oxide synthase (iNOS; AB178945; Abcam) was detected by western blot analysis [14].
Cell viability assay
Cell viability was determined using a Cell Counting Kit-8 (CCK-8) assay (CT0001-D; Spark Jade, China). The cells in the logarithmic growth phase were inoculated into 96-well plates, with 100 μL of a 1 × 10⁴ cell suspension in each well. Wells with medium containing dimethyl sulfoxide (DMSO; D8371; Solarbio, China) and wells containing only the culture medium without cells were used as controls. After the cells adhered to the wall, different concentrations of ginsenoside Rg1 (S33043-1 g; Shanghai Yuanye Bio-Technology Co., Ltd., China) and tanshinone IIA (S31459-1 g) were added to the wells. An M1-type macrophage model was established. After 24 h, the medium was discarded. The drug concentrations of ginsenoside Rg1 and tanshinone IIA were 0, 10, 20, and 30 μg/mL, the optimal dose was selected. After the drug treatment ended, 10 μL of CCK-8 solution was added to each well. The entire procedure was performed in the dark. After 2 h of incubation, the optical density (OD) value of each well was measured at 490 nm. The experiment was repeated three times. The final concentration of ginsenoside Rg1 was 20 μg/mL, and that of tanshinone IIA was 10 μg/mL.
Cell grouping
The cells were divided into the control group, model group, GSK2795039 inhibitor group (GSK group) (G882609-1 mg; Macklin, China), and ginsenoside Rg1 group and tanshinone IIA (RA) group. Cells in the control group did not receive any treatment. The cells in the model group were jointly stimulated with LPS at 250 ng/mL and IFN-γ at 100 ng/mL for 24 h. In the GSK group, after pretreatment with 6 μmol/L for 2 h, 250 ng/mL LPS and 100 ng/mL IFN-γ were added to establish the model. The cells in the RA group were pretreated with ginsenoside Rg1 at 20 μg/mL and tanshinone IIA at 10 μg/mL for 2 h, after which LPS at 250 ng/mL and IFN-γ at 100 ng/mL were added to establish the model.
Immunofluorescence assay
RAW264.7 cells (1 × 10⁴ cells/well) were seeded in 24-well plates. After group-specific treatments, the cells were washed twice with PBS and fixed with 4% paraformaldehyde (P1110; Solarbio, China) for 20 min. Permeabilization was performed using 0.1% Triton X-100 (1:1000 dilution in PBS; P1080; Solarbio, China) at room temperature for 30 min. The cells were blocked with donkey serum (EE0009; Spark Jade, China) at 37 °C for 30 min. After serum removal, primary antibodies against COX-2 (66351-1-Ig; Proteintech, China) and iNOS (80517-1-RR; Proteintech, China) diluted 1:800 in PBS were applied, and the cells were incubated overnight at 4 °C. After three PBS washes, the secondary antibodies, Goat Anti-Mouse IgG (H + L) Alexa Fluor 594 (EF0010; SparkJade, China) and Cy3-conjugated Goat Anti-Rabbit IgG (H + L) (AS007; ABclonal, China) were added, and the cells were incubated at room temperature for 30 min. After three additional PBS washes, the samples were mounted with an anti-fade mounting medium containing 4′,6-diamidino-2-phenylindole (DAPI; EE0015; SparkJade, China) for 20 min at room temperature prior to imaging.
Detection of reactive oxygen species
The reactions were performed in accordance with the reactive oxygen species (ROS) kit instructions (S0033S; Beyotime, China). Cells were inoculated into 24-well plates. After the cells adhered to the surface, the drug was administered and modeling was performed. After 24 h, the cells were washed twice for 30 s each. The pre-configured fluorescent probe was added to a 24-well plate at a volume of 1 mL per well, and the mixture was incubated in the dark. The six-well plate was incubated at 37 °C in the dark for 30 min. After incubation, the plate was washed twice with PBS, and a photograph was obtained.
Quantitative real-time polymerase chain reaction
Total RNA was extracted from RAW264.7 cells using the SPARKeasy Tissue/Cell RNA Rapid Extraction Kit (with a genomic DNA clearance column) (AC0202-B, SparkJade, China) according to the manufacturer's instructions. The primer sequences were synthesized by Sangon Biotech (Shanghai, China) and are listed in Table 2. Complementary DNA (cDNA) was subsequently synthesized by reverse transcription using 2 × SYBR Green qPCR Mix (with ROX) (AH0104-C, Sparkjade, China). The amount of RNA in the cells was determined using a SPARKscript II RT Plus Kit (with gDNA Eraser) (AG0304-C, Sparkjade, China). The experimental process was as follows: denaturation at 94 °C for 3 min, amplification at 95 °C for 10 s, amplification at 60 °C for 30 s, and return to step 2. This cycle was repeated three times. The relative expression level of the target gene was calculated using the 2–ΔΔCt method (ΔCt = target gene—β-actin, ΔΔ = ΔCTexperiment—ΔCT Control).
Table 2 Primer sequence of qRT-PCR assayStatistical analysis
All statistical analyses were performed using GraphPad Prism 8.0 software. One-way analysis of variance (ANOVA) was used to compare the measurement data that showed a normal distribution, whereas nonparametric tests were used for data that did not conform to a normal distribution. P < 0.05 indicated that the difference was statistically significant.


Comments (0)