Animals
Sprague Dawley (SD) rats (Specific Pathogen Free (SPF), male, 200–220 g) (animal experiments), 4-week-old male SD rats (cell isolation) were acquired from Vital River Laboratory Animal Technology Co.,Ltd, (SCXK,2021-0011, Beijing, China). The experimental animals were maintained in pathogen-controlled facilities under standardized environmental parameters (ambient temperature maintained at 23 ± 2 °C with relative humidity of 55 ± 5%), receiving unrestricted access to regular rodent diet and drinking water. The Institute of Chinese Materia Medica’s Experimental Animal Ethics Committee reviewed and granted approval for all protocols involving animal utilized in this research (Approval No: 2023B312).
Drugs
The DAP (China Approved Drug Number B20020890), comprising seeds of Artemisia halodendron Turcz. ex Bess (AHT, Cat. No. 230107, 0.4 g/per patch), menthol (Cat. No.230504, purity: 98.60%, 0.0016 g/mL), and Veronica linariifolia Pall. ex Link subsp. Dilatate (Nakai et Kitagawa) Hong (VLP, Cat. No. 220401, 0.4 g/mL), was sourced from Shaanxi Momentum Qixuehe Pharmaceutical Co..Ltd (Shaanxi, China). Qizheng Xiaotong Plaster (QZXTP), procured from Tibet Cheezheng Tibetan Medicine Co., Ltd. (China Approved Drug Number Z54020113, Xizang, China), was used as a positive control. The preparation process involved combining 20 g of AHT, 0.8 g of VLP, and 0.04 g of menthol at a ratio of 50:1, transferring the greeze dried powder mixture into a 200 mL beaker. Subsequently, 100 mL of a 25% ethanol solution was added to the beaker to prepare a 100 mL raw material drug mixture (Additional file 1: Materials S1).
Grouping, KOA modeling, and treatment
Rats were randomly allocated to six groups: (1) the control group (n = 12), (2) the KOA model group (n = 12), (3) the DAP low-dose (DAP-L, 0.0367 g/kg, 1.0-fold clinical dose, n = 12) group, (4) the DAP medium-dose (DAP-M, 0.0735 g/kg, 2.0-fold clinical dose, n = 12) group, (5) the DAP high-dose (DAP-H, 0.1470 g/kg, 4.0-fold clinical dose, n = 12) group, and (6) the QZXTP, (Positive, 0.1058 g/kg, 1.0-fold clinical dose, n = 8) group. The clinical equivalent dose for rats was 0.0367 g/kg, based on a body surface area conversion factor of 6.17 [25] (Additional file 2: Table S1).
KOA was induced using papain enzyme [26]. After anesthetizing rats with 2% pentobarbital sodium (Sigma Aldrich, USA), the rats were fixed, and hair was shaved around a 2 cm area of the right knee joint. Subsequent to antiseptic preparation with iodine solution, intra-articular administration of 0.1 mL solution containing freshly constituted 4% papain combined with L-cysteine (Solarbio, Beijing, China) was performed at the right knee articulation, followed by secondary antiseptic application. The experimental protocol involved administering modeling agent injections to all treatment cohorts on days 1, 4, and 7 of the experimental periods, while control group received vehicle solution only; subsequently, standard husbandry practices were maintained throughout the ensuing 5-week duration.
Therapeutic intervention with DAP commenced on the 8th day post-model establishment, with topical application encircling the affected right knee articulation continuing for a five -week treatment course. To maintain experimental integrity by preventing oral interaction with the medicinal application site and minimizing inter-subject contact that might compromise result validity, each animal was provided separate housing accommodations following administration of the therapeutic intervention (Additional file 1: Methods S2).
Joint swelling degree
Observations were conducted on knee joint inflammation in the experimental animal model. Following model establishment, measurements of the right knee joint diameter at consistent anatomical locations were performed at 4-day intervals utilizing a vernier caliper manufactured by Green Forest (Yantai, China).
Mechanical withdrawal threshold
Pain sensitivity measurements utilized a calibrated von Frey device (manufactured by IITC Life Science, California, USA) to determine tactile response thresholds. Assessment procedures adhered to our research group's established methodology, and final MWT values represented an average calculated from three independent measurements [27].
Load difference test
Three days prior to sampling, rats were trained and tested for weight differences. Each rat was placed in a slightly tilted glass chamber, and Dual-channel capacitive sensors were placed on their hind paw toes. Once the rats were calm, weight-bearing differences were recorded. To ensure data accuracy, three readings were taken per rat with a 5-min interval, and a total of three rounds were conducted weekly.
Gait analysis
Automated locomotor pattern analysis was performed utilizing the Cat Walk apparatus (Noldus Information Technology, Wageningen, Netherlands) as described previously [28]. This technology consists of a confined corridor with Light-dispersing glass flooring that illuminates upon paw contact, creating visible footprint patterns. A camera captures 50 to 60 frames per second, and the data is stored for offline analysis using Cat Walk XT 10.6 software. This system enables the evaluation of gait changes and weight-bearing by selecting relevant parameters [29].
Histological analysis
The H&E staining procedure (Additional File 1: Method S3) can reveal changes occurring at the articular cartilage interface, layering patterns, and chondrocyte characteristics, including quantity and structural features. The safranin-O positive area was measured using the ImageJ analysis platform to quantitatively evaluate the cartilage matrix [30]. At the same time, pathological changes in the synovium were evaluated and scored using hematoxylin and eosin H&E staining.
TUNEL staining
The TUNEL apoptosis detection kit (Servicebio, Wuhan, China) (Additional file 1: Methods S4) was used to detect the apoptosis cells of chondrocytes in cartilage tissue. Visualization and documentation of apoptotic chondrocytes were facilitated through examination with an upright fluorescence microscopic apparatus (Nikon ECLIPSE, Japan).
Biochemical parameters in serum
Serum levels of key inflammatory factors—tumor necrosis factor-alpha (TNF-α), IL-1β, and prostaglandin E2 (PGE2)—underwent measurement using commercial immunoassay kits (Enzyme linked Biotechnology Co., Ltd, Shanghai, China) following the recommended procedural guidelines. Oxidative stress biomarker assessment included superoxide dismutase (SOD) and glutathione (GSH) quantification using diagnostic reagents supplied by Elabscience (Wuhan, China), whereas malondialdehyde (MDA) detection employed specialized kits from Nanjing Jiancheng Bioengineering Institute (Nanjing, China). All biochemical procedures were performed according to the suppliers'technical instructions[31].
Western blot analysis
Protein concentration in the supernatant after lysis was measured using the BCA protein quantification kit (Beyotime, Shanghai, China). Membranes were immunoblotted overnight at 4 °C with primary antibodies against MMP13, COL2A1, MYL3, NDUFA5, NDUFA6, NDUFS6, AMPK, and p-AMPK, followed by HRP-conjugated secondary antibody incubation. Blots were examined with ECL detection reagents and quantified using ImageJ Software. Antibody information is provided in (Additional file 2: Table S2).
Preparation of DAP and transdermal samples and analysis of chemical profiles
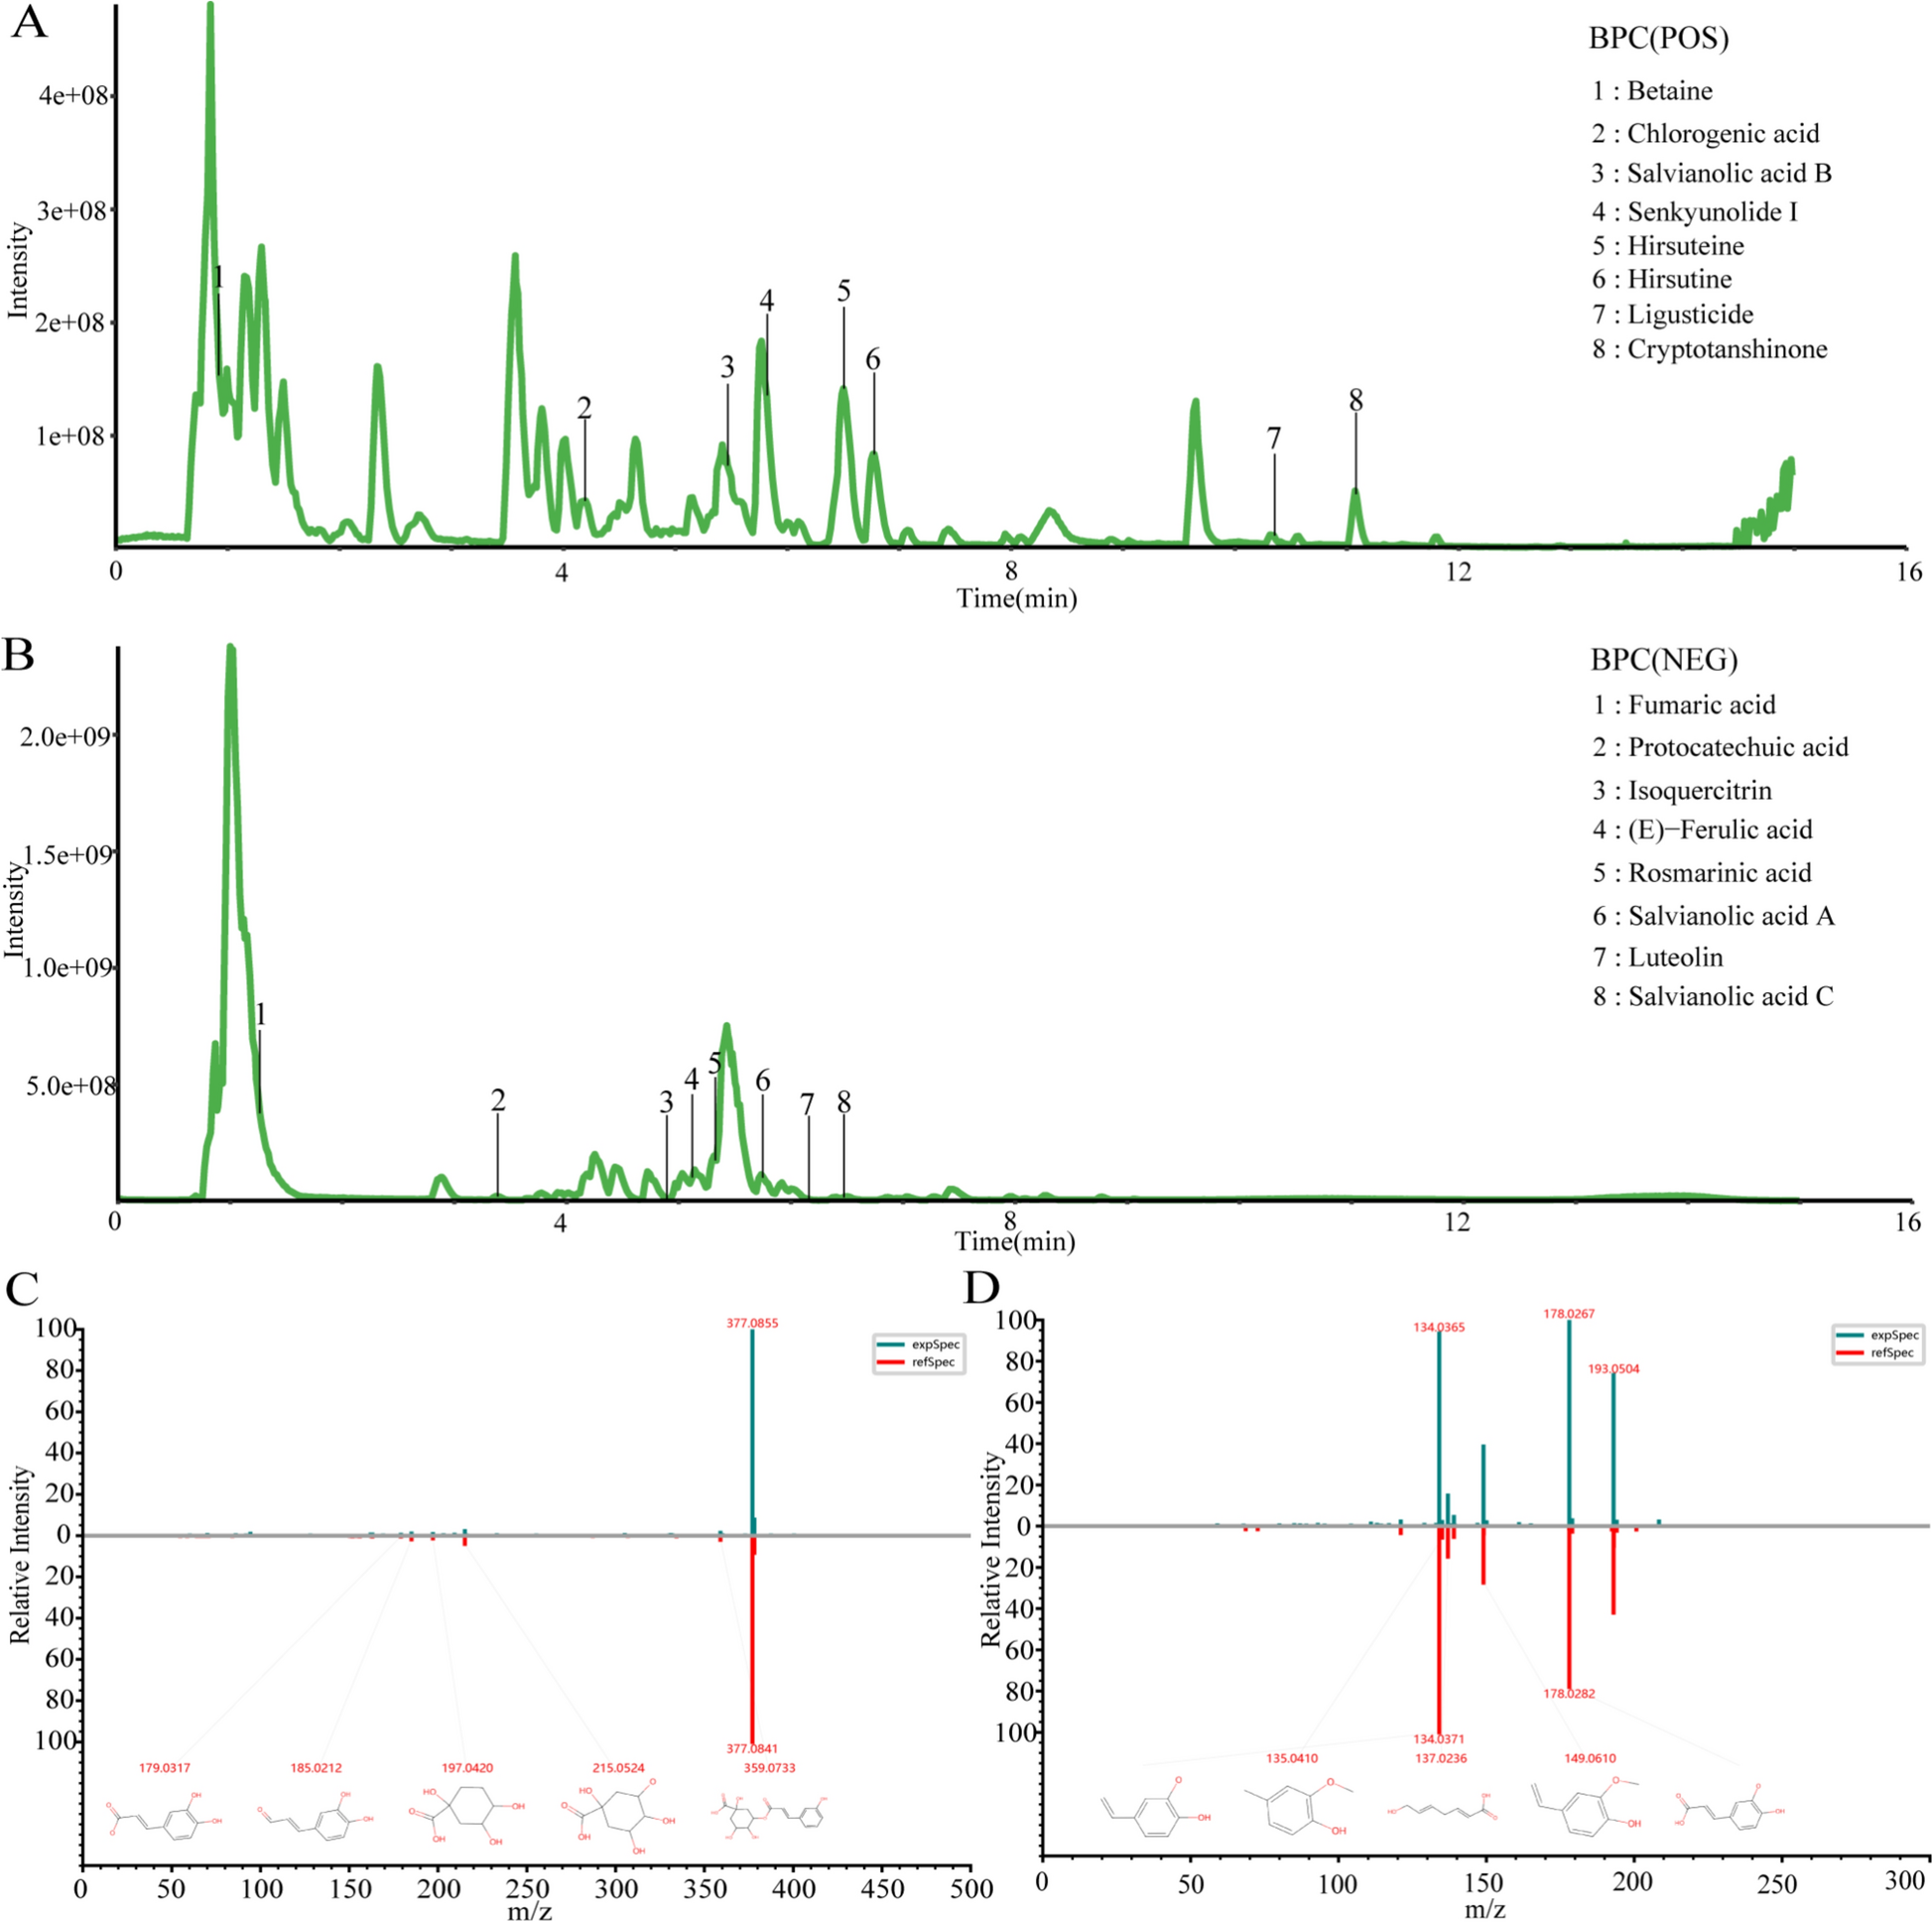
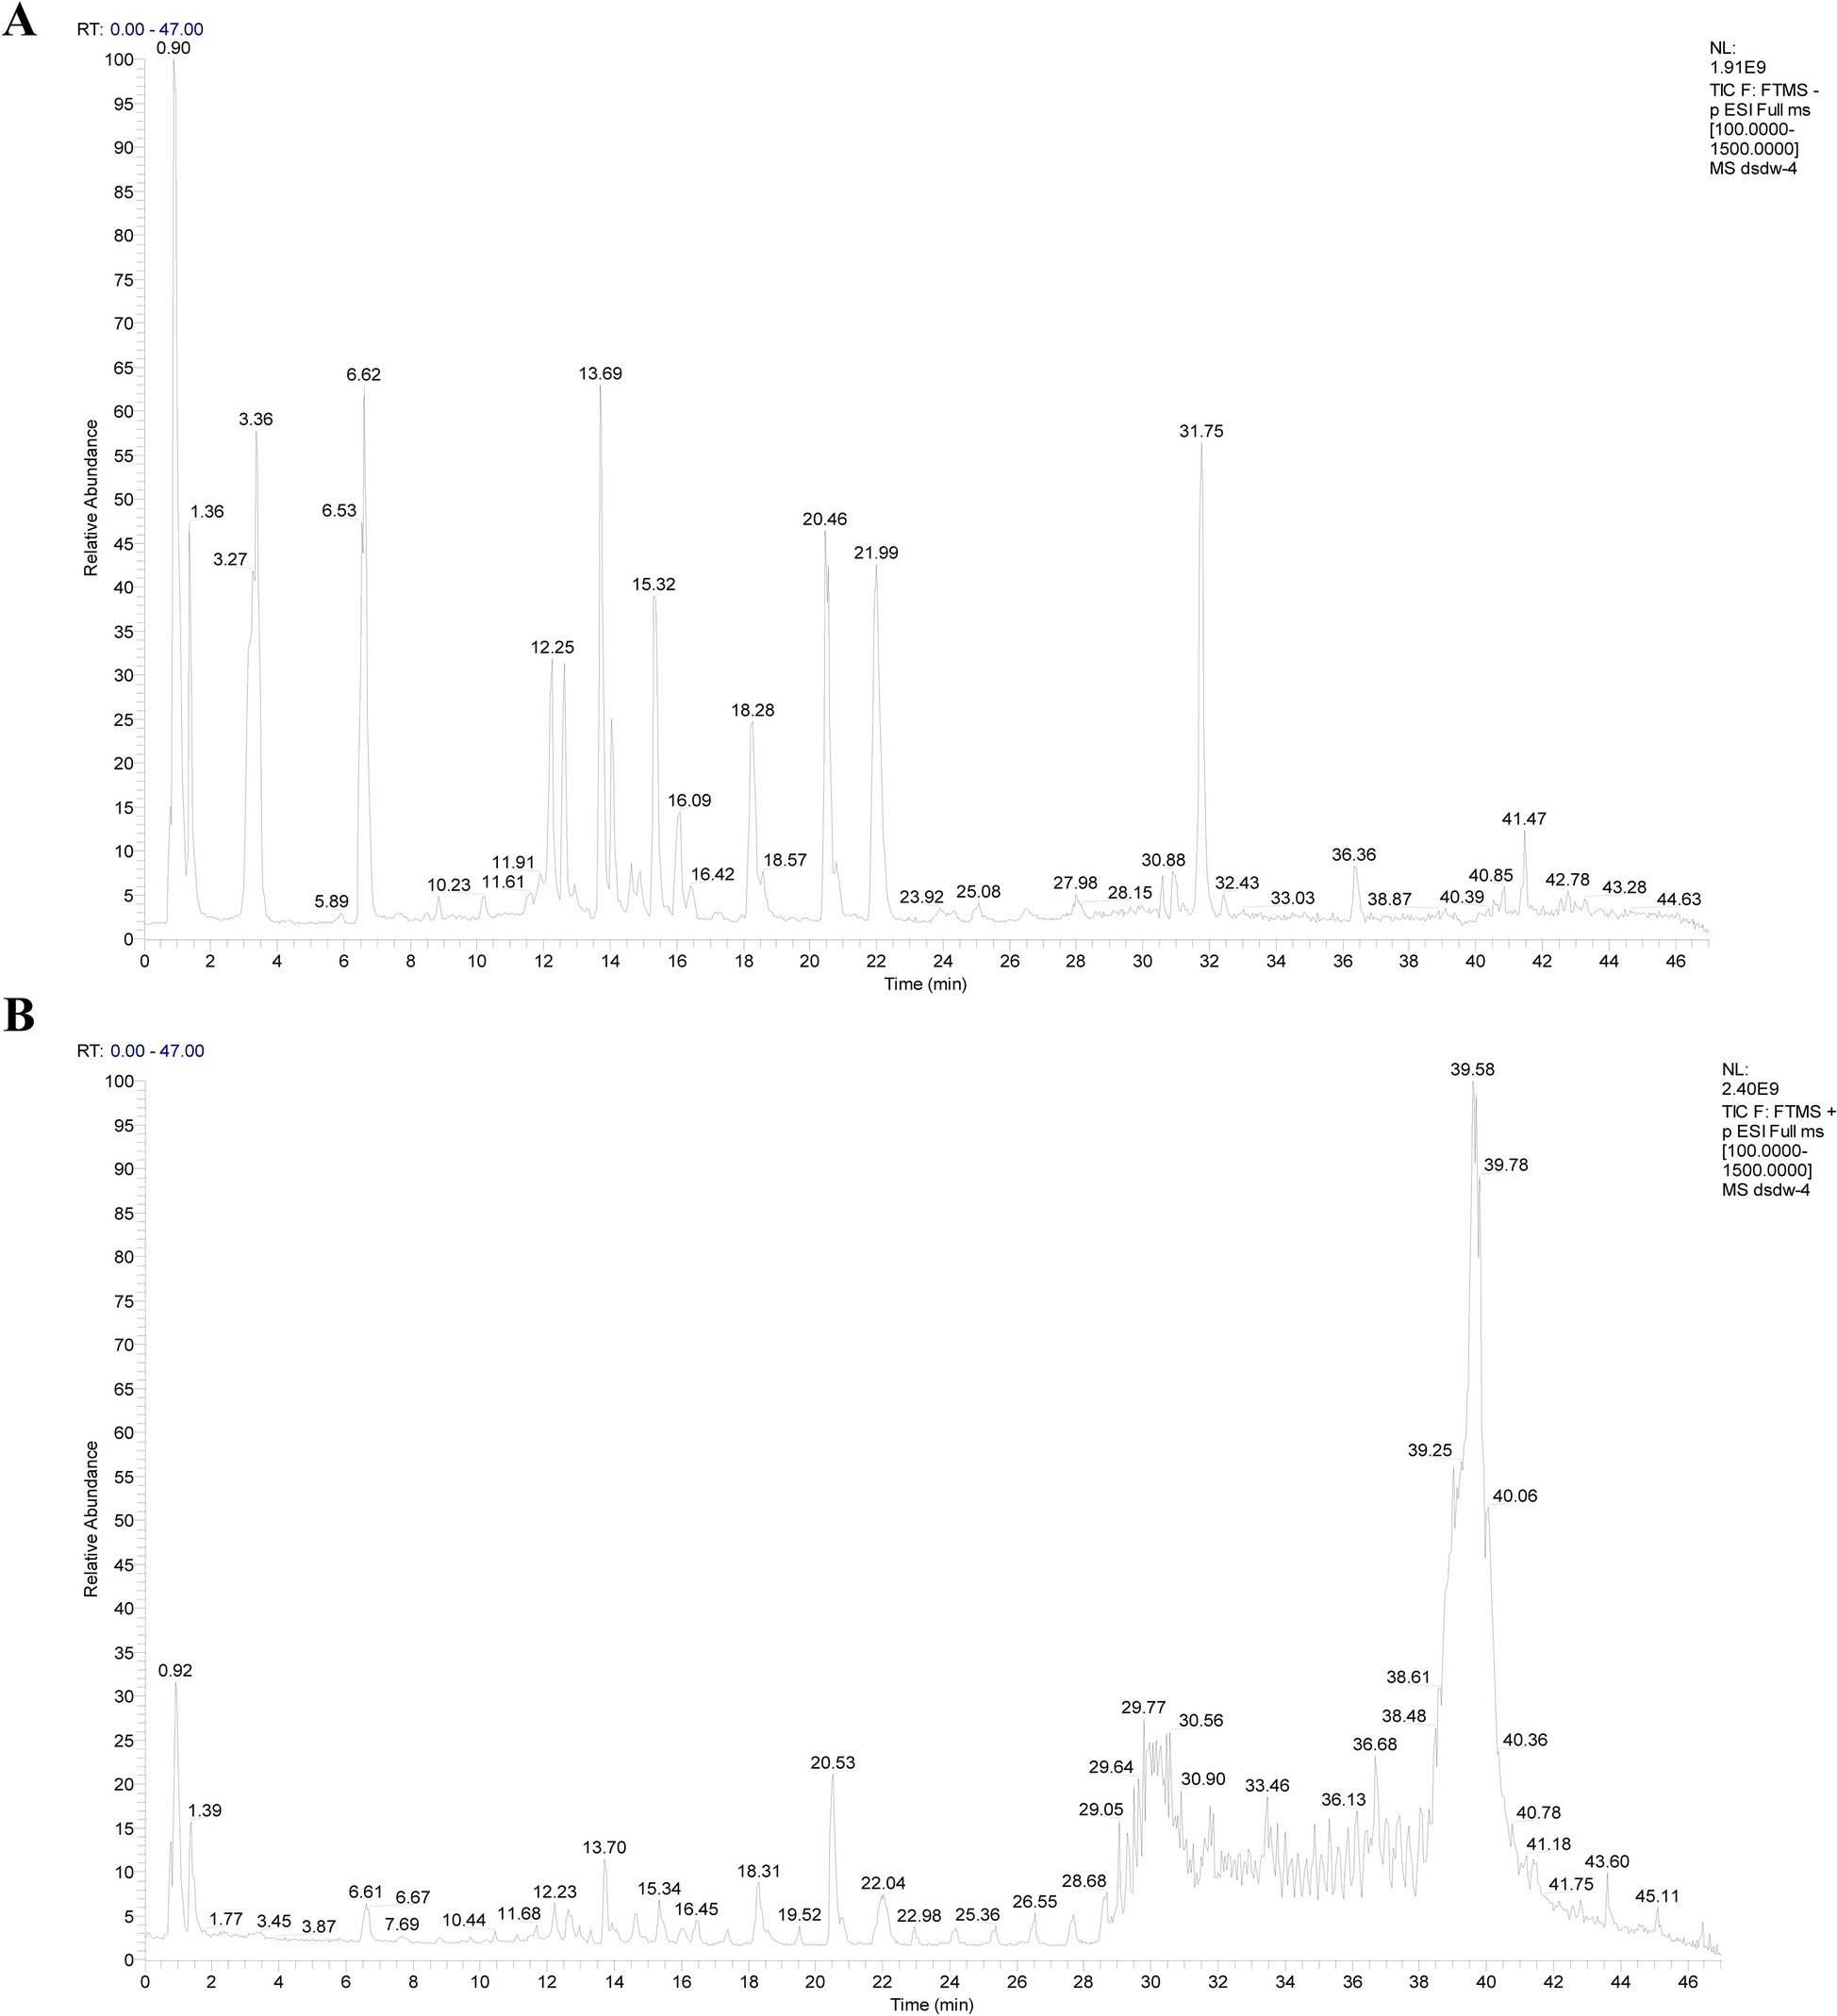
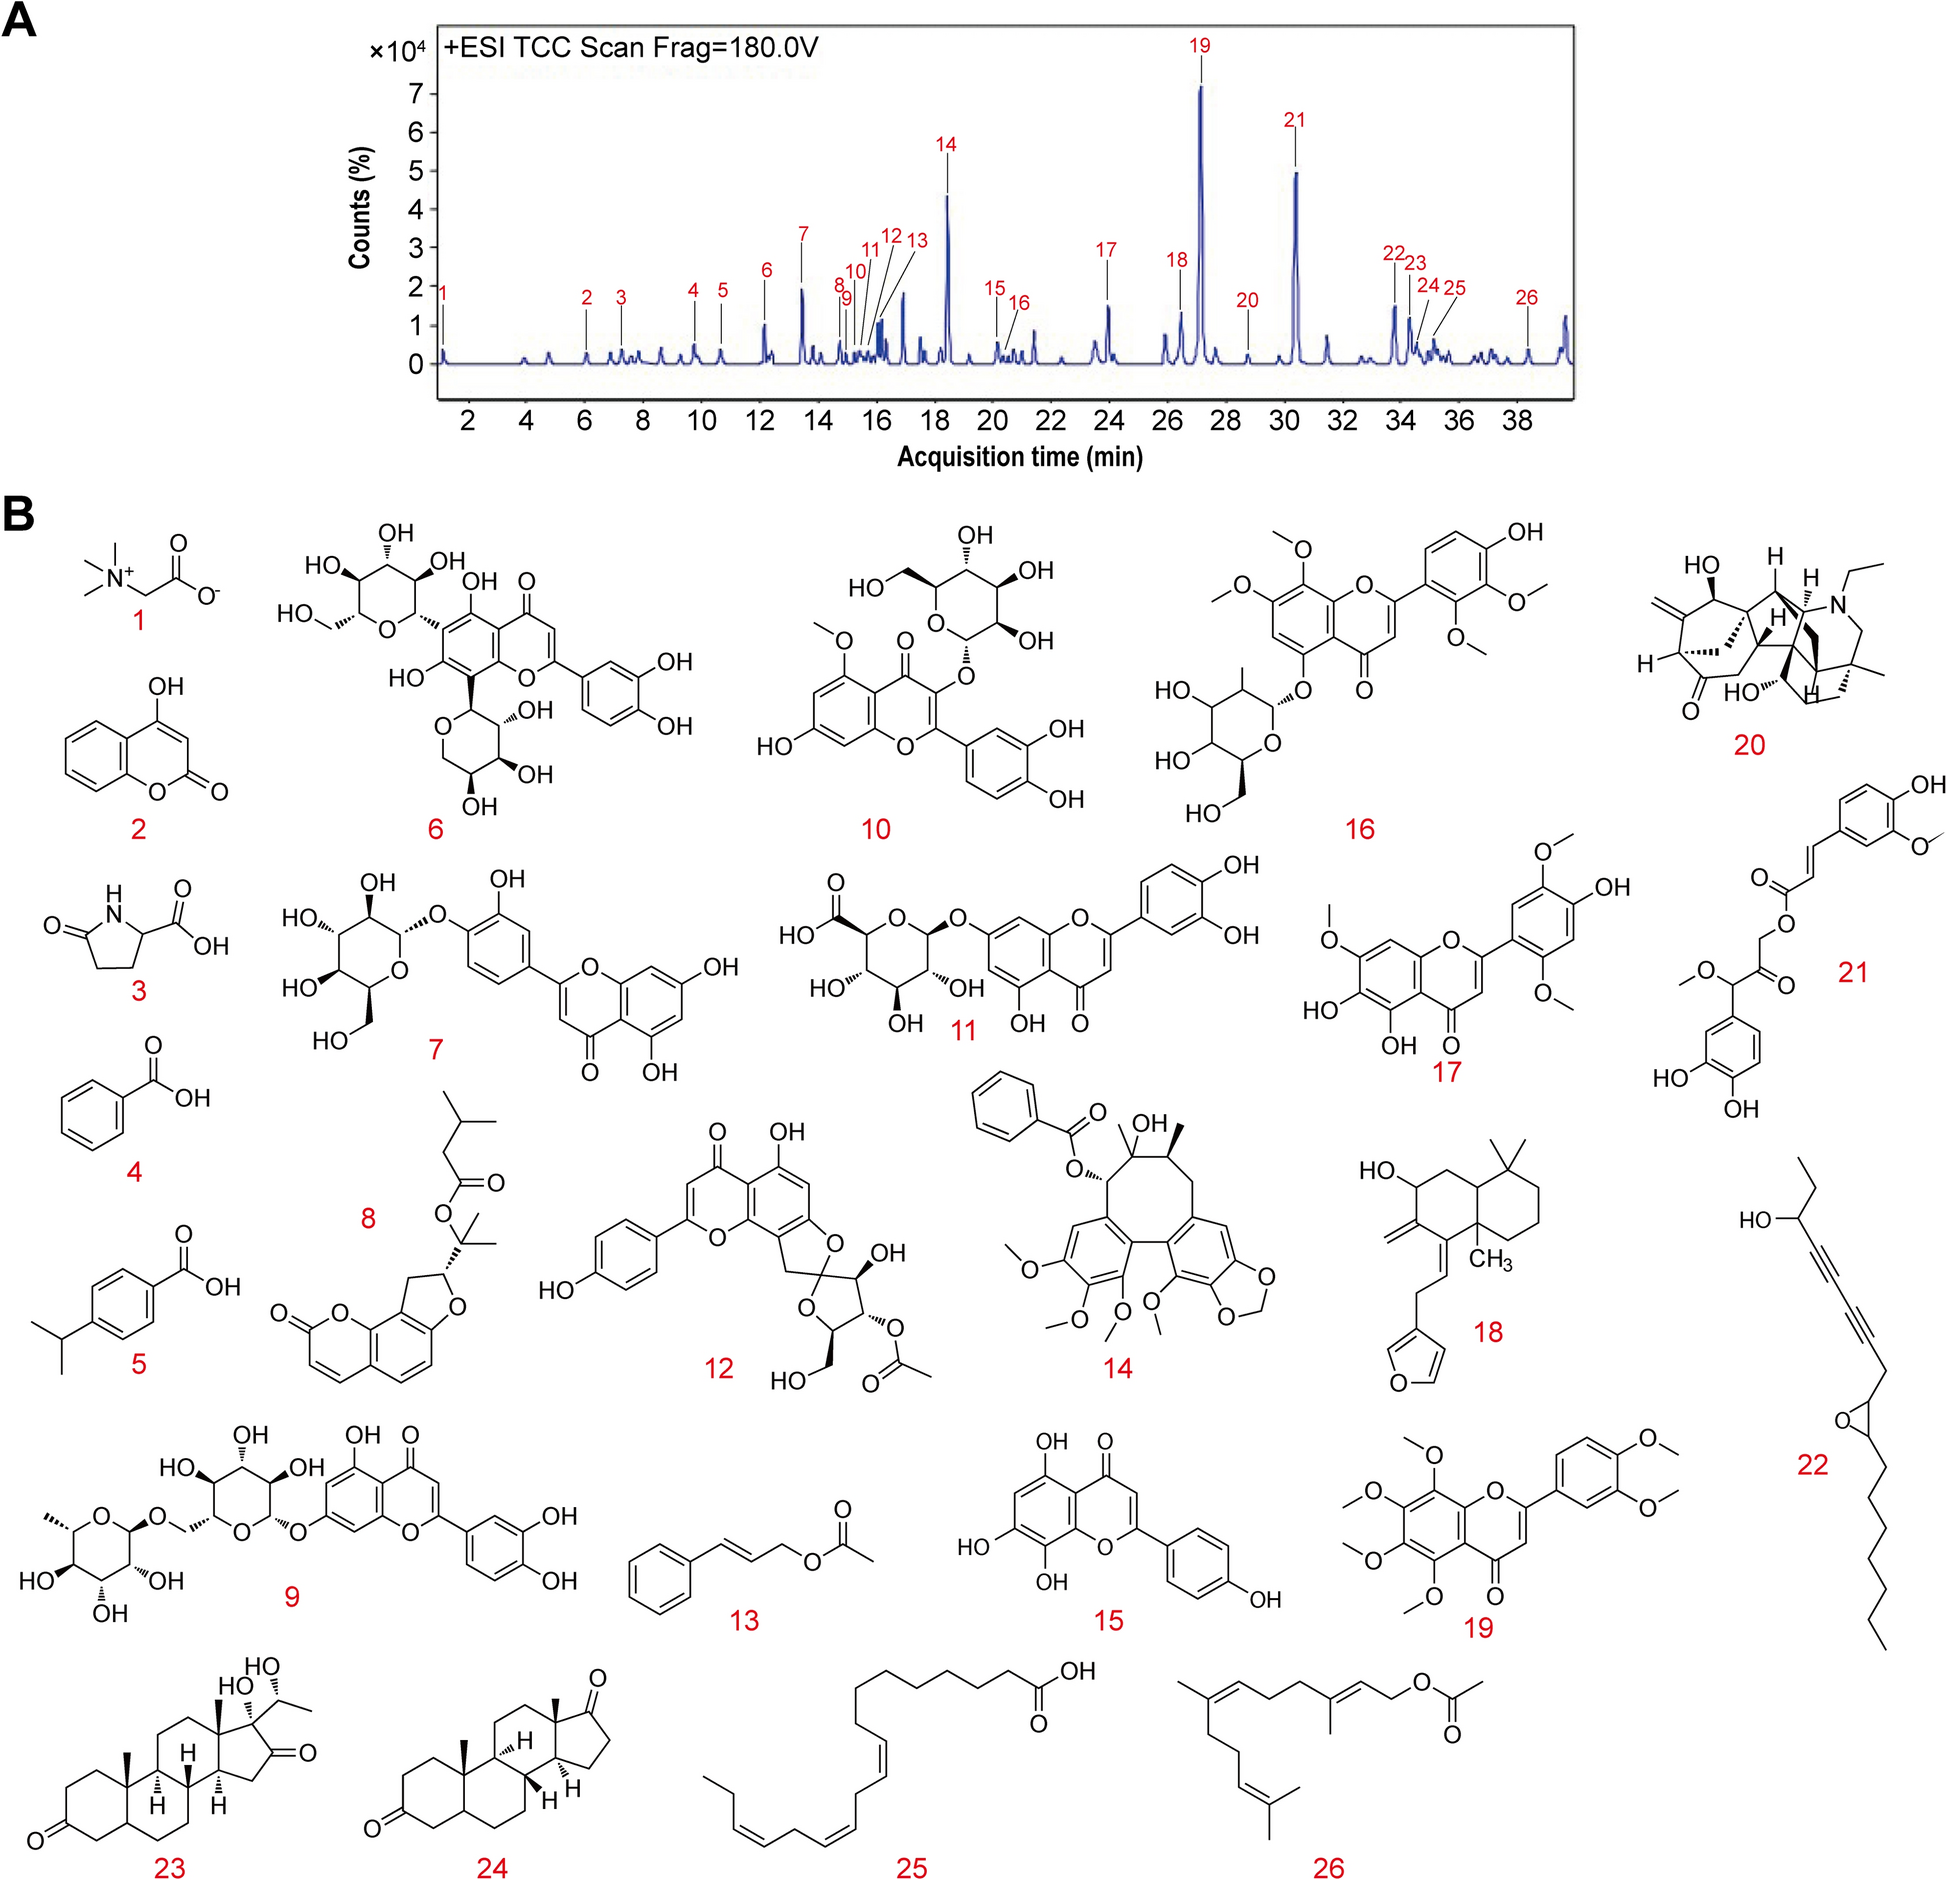
Comprehensive details regarding the preparation of DAP samples and the in vitro transdermal sample preparation are provided in (Additional file 1: Methods S5-6, Additional file 2: Table S3). Ultra Performance Liquid Chromatography-Quadrupole-Time-of-Flight Mass Spectrometry (UPLC-Q-TOF/MS) was utilized to analyze the compounds of the original DAP formula and, in conjunction with Franz diffusion cell method, to identify the transdermal active ingredients. The raw data obtained were processed utilizing Waters MassLynx v4.1 software for analysis, as described in (Additional file 1: Methods S7).
RNA-sequencing (RNA-seq)
Cartilage from the right knee joint of rats was collected from the most effective DAP-H group, KOA model group, and control group (n = 3) for RNA-seq analysis. RNA-seq was performed by Sinotech Genomics Co., Ltd. (Shanghai, China) using the VAHTS Universal V10 RNA-seq Library Prep Kit for Illumina by Vazyme Biotech Co., Ltd, (Nanjing, China). Sequencing was carried out on the Illumina Nova Seq high-throughput platform. Significant differentially expressed genes (DEGs) were screened with the thresholds of |Fold change|> 1.5 and P < 0.05. All raw data have been uploaded to GEO database (Accession No: GSE299712).
Network construction and analyses
Gene Ontology (GO) functional analysis and Kyoto Encyclopedia of Genes and Genomes (KEGG) pathway enrichment analysis for DEGs were conducted using the DAVID database (https://david.ncifcrf.gov/) [27]. To identify the key genes involved in the regulatory mechanisms of DAP against KOA, a protein–protein interaction (PPI) network was built using the STRING database (https://string-db.org/) with a combined score > 0.7. Node topological features were calculated using CytoHubba, and core targets were screened with the median MCC (6.5) as the cutoff value. Gene co-ex-pression network analysis was established using the “corrplot” and “Hmisc” packages in R. Topological eigenvalues of nodes were calculated using CytoHubba, with Pearson’s correlation coefficient and P < 0.05 as the cutoff values.
Quantitative real-time PCR (qPCR)
Total RNA was extracted using TRNzol reagent (TIANGEN, Beijing, China) and reverse-transcribed using a cDNA synthesis kit (TIANGEN, Beijing, China). The expression of targets was determined in triplicates using SYBR (Takara, Japan) on a Roche LightCycler 480 system. Relative gene expression was calculated using the 2− ΔΔCT method and normalized to β-actin. Primer sequences are detailed in (Additional file 2: Table S4).
Immunohistochemical staining (IHC)
For assessment of DAP effects on candidate target localization and expression [32]. (Additional file 1: Methods S8), we applied specific rabbit antibodies against NDUFA5, NDUFA6, NDUFS6, p-AMPK, AMPK, MYL3, Aquaporin 1 (AQP1), Aquaporin 3 (AQP3), and Aquaporin 4 (AQP4). Quantification of staining intensity involved measuring average optical density (AOD) using ImageJ software across three separate fields of view per sample (n = 3). Details regarding the antibodies are provided in( Additional file 2: Table S2).
Isolation and cultivation of primary chondrocytes
Primary chondrocytes were isolated from 4-week-old male SD rats (120 ± 10 g) [33]. After euthanasia, cartilage tissues were aseptically collected, minced, and washed with cold PBS. Sequential enzymatic digestion was performed using 0.25% trypsin (40 min) followed by 0.2% type II collagenase (37 °C, 6 h). Cells were filtered through 70 μm strainers, centrifuged at 1000 r/min, and cultured in DMEM containing 10% FBS and 1% penicillin–streptomycin.
Cell viability assays
A suspension of chondrocytes was prepared, then seeded in 96-well plates (1.0 × 10⁴ cells/well) and allowed to attach during overnight incubation. The Cell Counting Kit-8 enabled assessment of cellular viability as detailed (Beyotime, Shanghai, China) (Additional file 1: Methods S9). The details of the 19 primary transdermal compound standards in DAP are presented in (Additional file 2: Table S5).
Cell treatment
Chondrocytes were treated with 19 transdermal ingredients at a concentration of 50 μM. The treatment protocol was as follows [34]: chondrocytes were divided into 21 groups, with 19 transdermal ingredients co-cultured with 10 ng/mL IL-1β. As reported, IL-1β functions as an established inducer of osteoarthritic phenotype in chondrocytes, frequently employed for simulating pathological conditions in laboratory settings [35]. For a Duration of 24 h, all experimental groups excluding controls underwent cultivation in serum-free medium supplemented with 10 ng/mL IL-1β.
Co-immunoprecipitation (Co-IP)
Co-IP was performed to explore the interactions between MYL3 and AMPK. Cells were lysed using IP lysis buffer (Beyotime, Shanghai, China), and the supernatant was collected after centrifugation at 12,000 r/min. The cell lysates were incubated overnight at 4 °C with antibodies targeting MYL3 (Proteintech, Wuhan, China) and normal rabbit IgG (Beyotime, Shanghai, China). The lysates were then combined with protein A/G agarose beads (Cell Signaling Technology, USA) and incubated for 2 h. The resulting precipitates were washed with ice-cold IP buffer and analyzed by Western blot.
Measurement of ROS levels
Intracellular ROS quantification employed fluorescence probe methodology utilizing a DCFH-DA-based detection kit (Beyotime, Shanghai, China). An Olympus microscope (Tokyo, Japan) facilitated visual data acquisition, while Image software enabled comprehensive analysis of three randomly captured fields [36].
MMP assay
Chondrocytes were stained with JC-1 (Beyotime, Shanghai, China) to assess MMP. Following drug treatment, the JC-1 staining working solution was added and mixed thoroughly. The cells were incubated at 37 °C for 20 min. Observations were conducted using an Olympus microscope (Tokyo, Japan), and detailed analysis was performed on 3 randomly selected images using Image software.
Measurement of mitochondrial ATP content
ATP levels in chondrocytes were measured using a commercial ATP detection kit (Beyotime, China). Briefly, 100 μL working solution was added to each well, followed by 5-min incubation at room temperature. Then, 20 μL sample or standard was added, mixed thoroughly, and RLU was measured after 2 s using a chemiluminescence analyzer.
Transmission electron microscopy (TEM)
Chondrocytes were fixed in 2.5% glutaraldehyde at 4 °C for 12 h, followed by a 1-h treatment with 2% osmium tetroxide. The cells were then stained with 2% uranyl acetate and dehydrated by sequential immersion in ethanol, from 30 to 100%. Specimens underwent acetone (100%) washing with 20-min agitation before epoxy resin infiltration, polymerization, ultrathin sectioning, and ultrastructural examination using Hitachi™ TEM (Tokyo, Japan).
Molecular docking
AutoDockTools 1.5.7 software enabled computational molecular docking analyses to elucidate interaction patterns between DAP active ingredients and key protein targets. Component three-dimensional structural data originated from PubChem repository, whereas target protein crystallographic coordinates were acquired from RCSB Protein Data Bank (http://www.rcsb.org/). The target structure was edited using PyMOL 2.3.0, and the ingredients were treated as ligands for semi-flexible docking. Interactions and binding modes were evaluated, and were visualized using PyMOL.
Cellular thermal shift assay (CETSA)
After 24 h of treatment with DMSO and 1.5% dicaffeoylquinic acid in chondrocytes, heat the samples in a PCR machine at the specified temperatures (40, 43, 46, 49, 52, 56, 60, 64, 68, and 72 °C) for 5 min, with subsequent rapid cooling at 4 °C lasting 3 min. Next, use ultrasound treatment to lyse the cells. Centrifuge the cell suspension at 4 °C at 14,000 r/min for 30 min. After centrifugation, add 5 × loading buffer to the supernatant, mix thoroughly, and Heat at 100 °C for 8 min for protein blotting detection.
Surface plasmon resonance (SPR) assay
Biomolecular interaction analysis employed a Biacore 8 K system (Cytiva, Sweden) following methodology previously established by our group with full protocol details available [37] (Additional file 1: Methods S10). Kinetic parameters including association and dissociation rate constants were determined through global data fitting to a 1:1 Langmuir interaction model utilizing Biacore Insight evaluation software suite (Cytiva, Marlborough, MA, USA).
Flow cytometry
Digest the cells to be detected with trypsin, collect the cells in a centrifuge tube, wash the collected cells with PBS and centrifuge to remove the supernatant. Resuspend cells with 195 μ l of Annexin V-FITC binding solution, add 5 μL of Annexin V-FITC and 10 μL of propidium iodide (PI) staining solution, mix well, incubate at room temperature in the dark for 10-min, and detect using a flow cytometer.
Detection of mitochondrial complex 1 content
Cellular material underwent harvesting, washed with PBS, centrifuged, a with subsequent collection of supernatant fraction for analytical processing. Reference standards and experimental samples were dispensed into designated microplate wells followed by a 30-min incubation at physiological temperature (37 °C). Measure the absorbance at 450 nm according to manufacturer-specified protocol parameters.
Statistical analyses
Data are presented as mean ± standard deviation (SD). Data analysis was conducted using GraphPad Prism (v8.4.3). Parametric or non-parametric statistical analyses were employed based on the normal distribution testing results. All experimental data underwent analysis using a one-way (ANOVA) with a post-hoc Tukey test. p < 0.05 was considered statistically significant.


Comments (0)