
Remember me


HLJDD consisted of the following ingredients, which acquired from Sichuan NEAUTUS Traditional Chinese Medicine Co., Ltd (Chengdu, China): Coptidis rhizome (Huanglian), Scutellariae radix (Huangqin), Phellodendri chinensis cortex (Huangbai), Gardenia fructus (Zhizi) (Table 1). All the herbs were immersed in water at a ratio of 1:10 (herbs to water) and allowed to soak for 30 min, then refluxed and extracted three times, with each extraction boiling for 30 min. The extract was subsequently concentrated to a therapeutic equivalent of 0.3 g/ml, portioned, and stored at -20℃ until use.
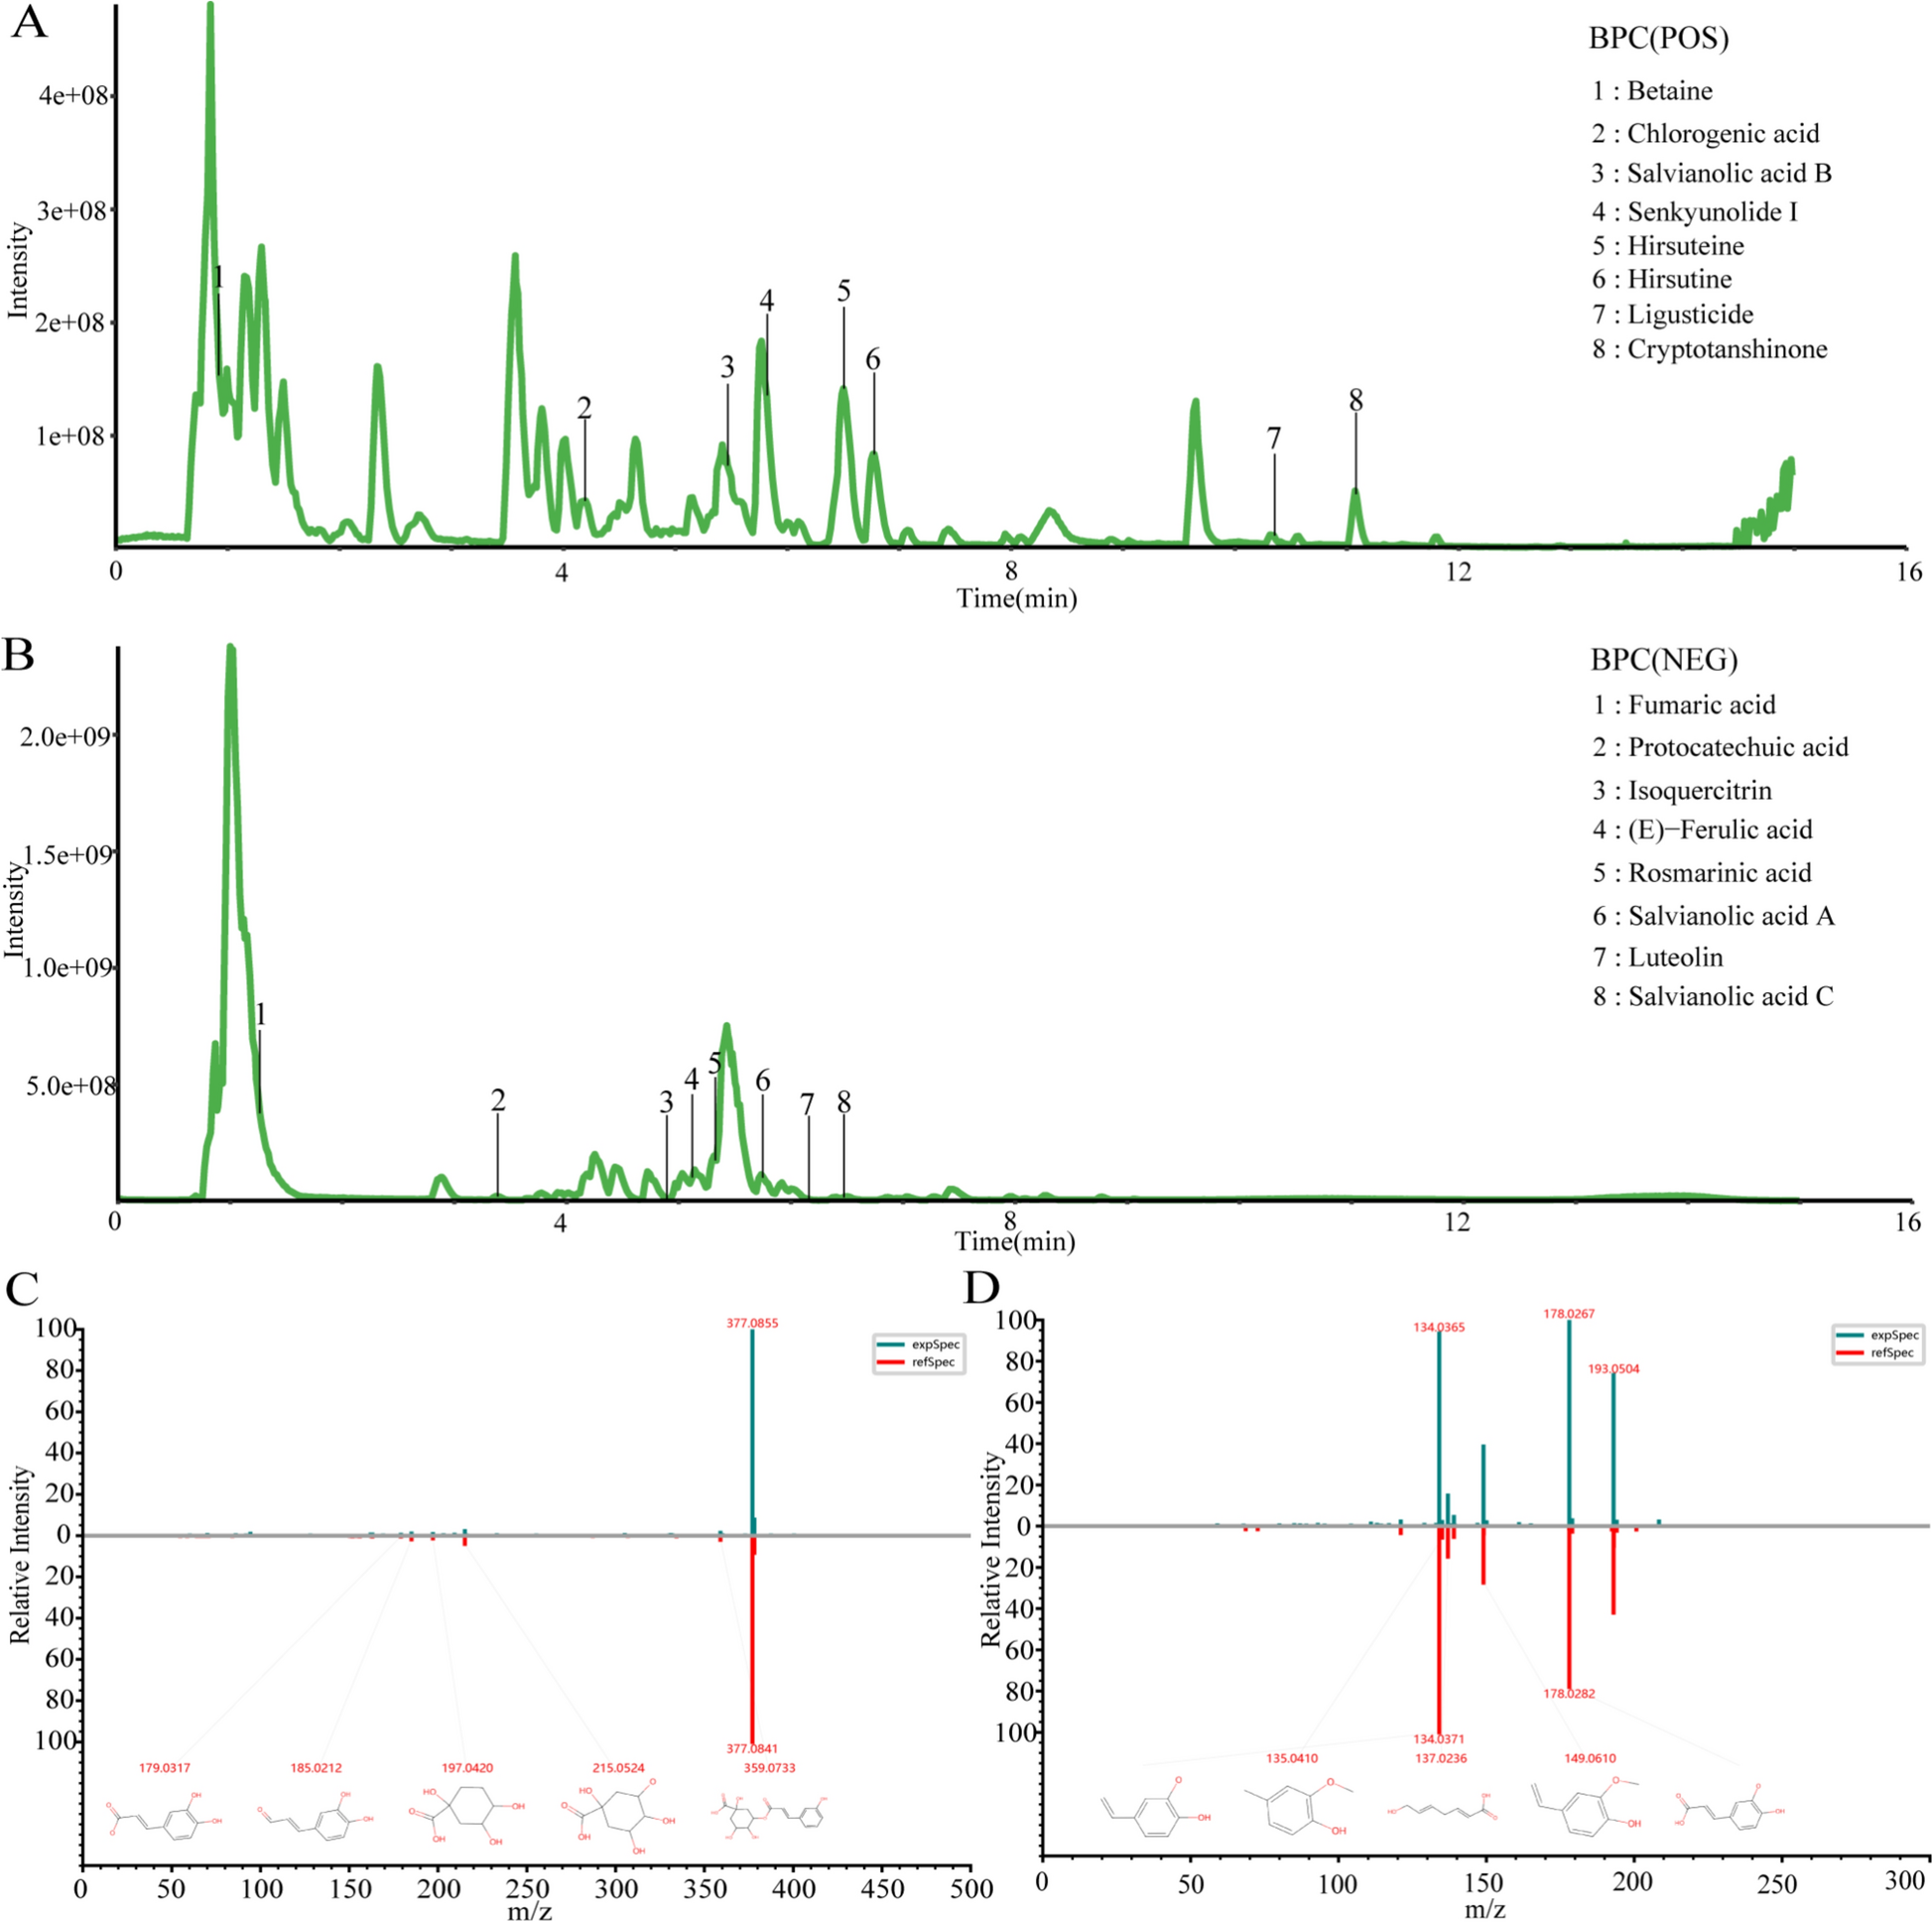
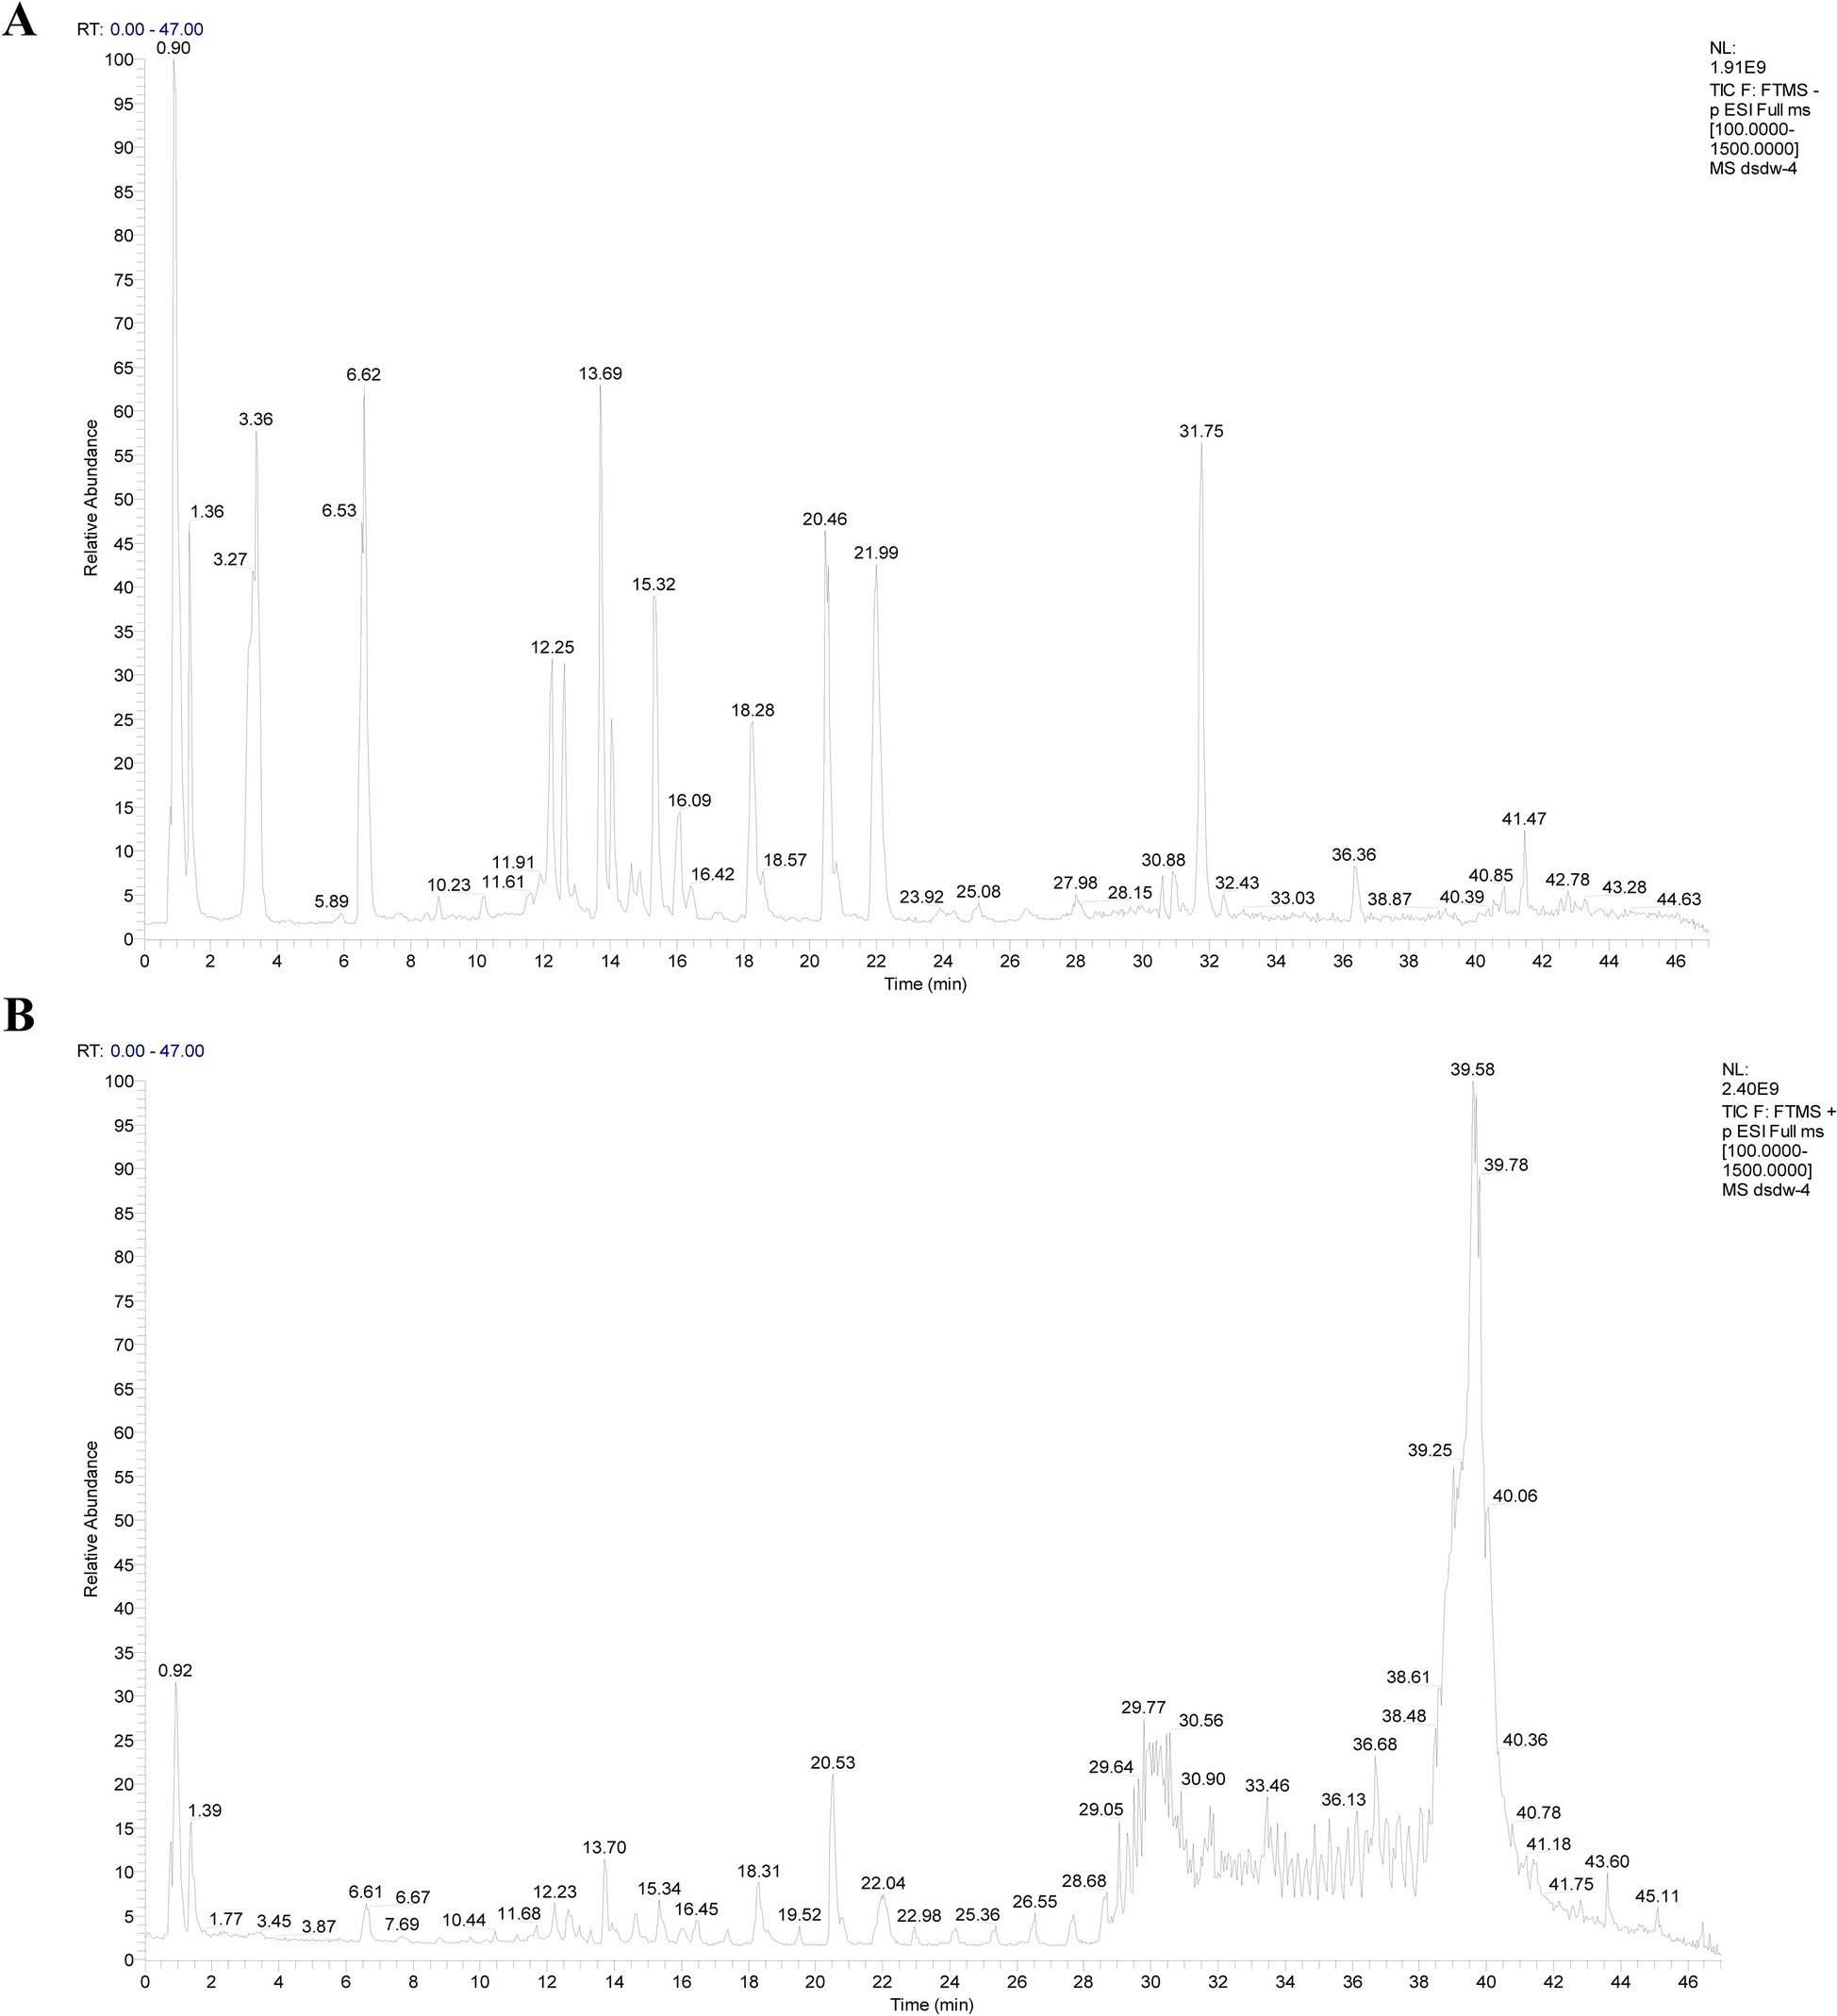
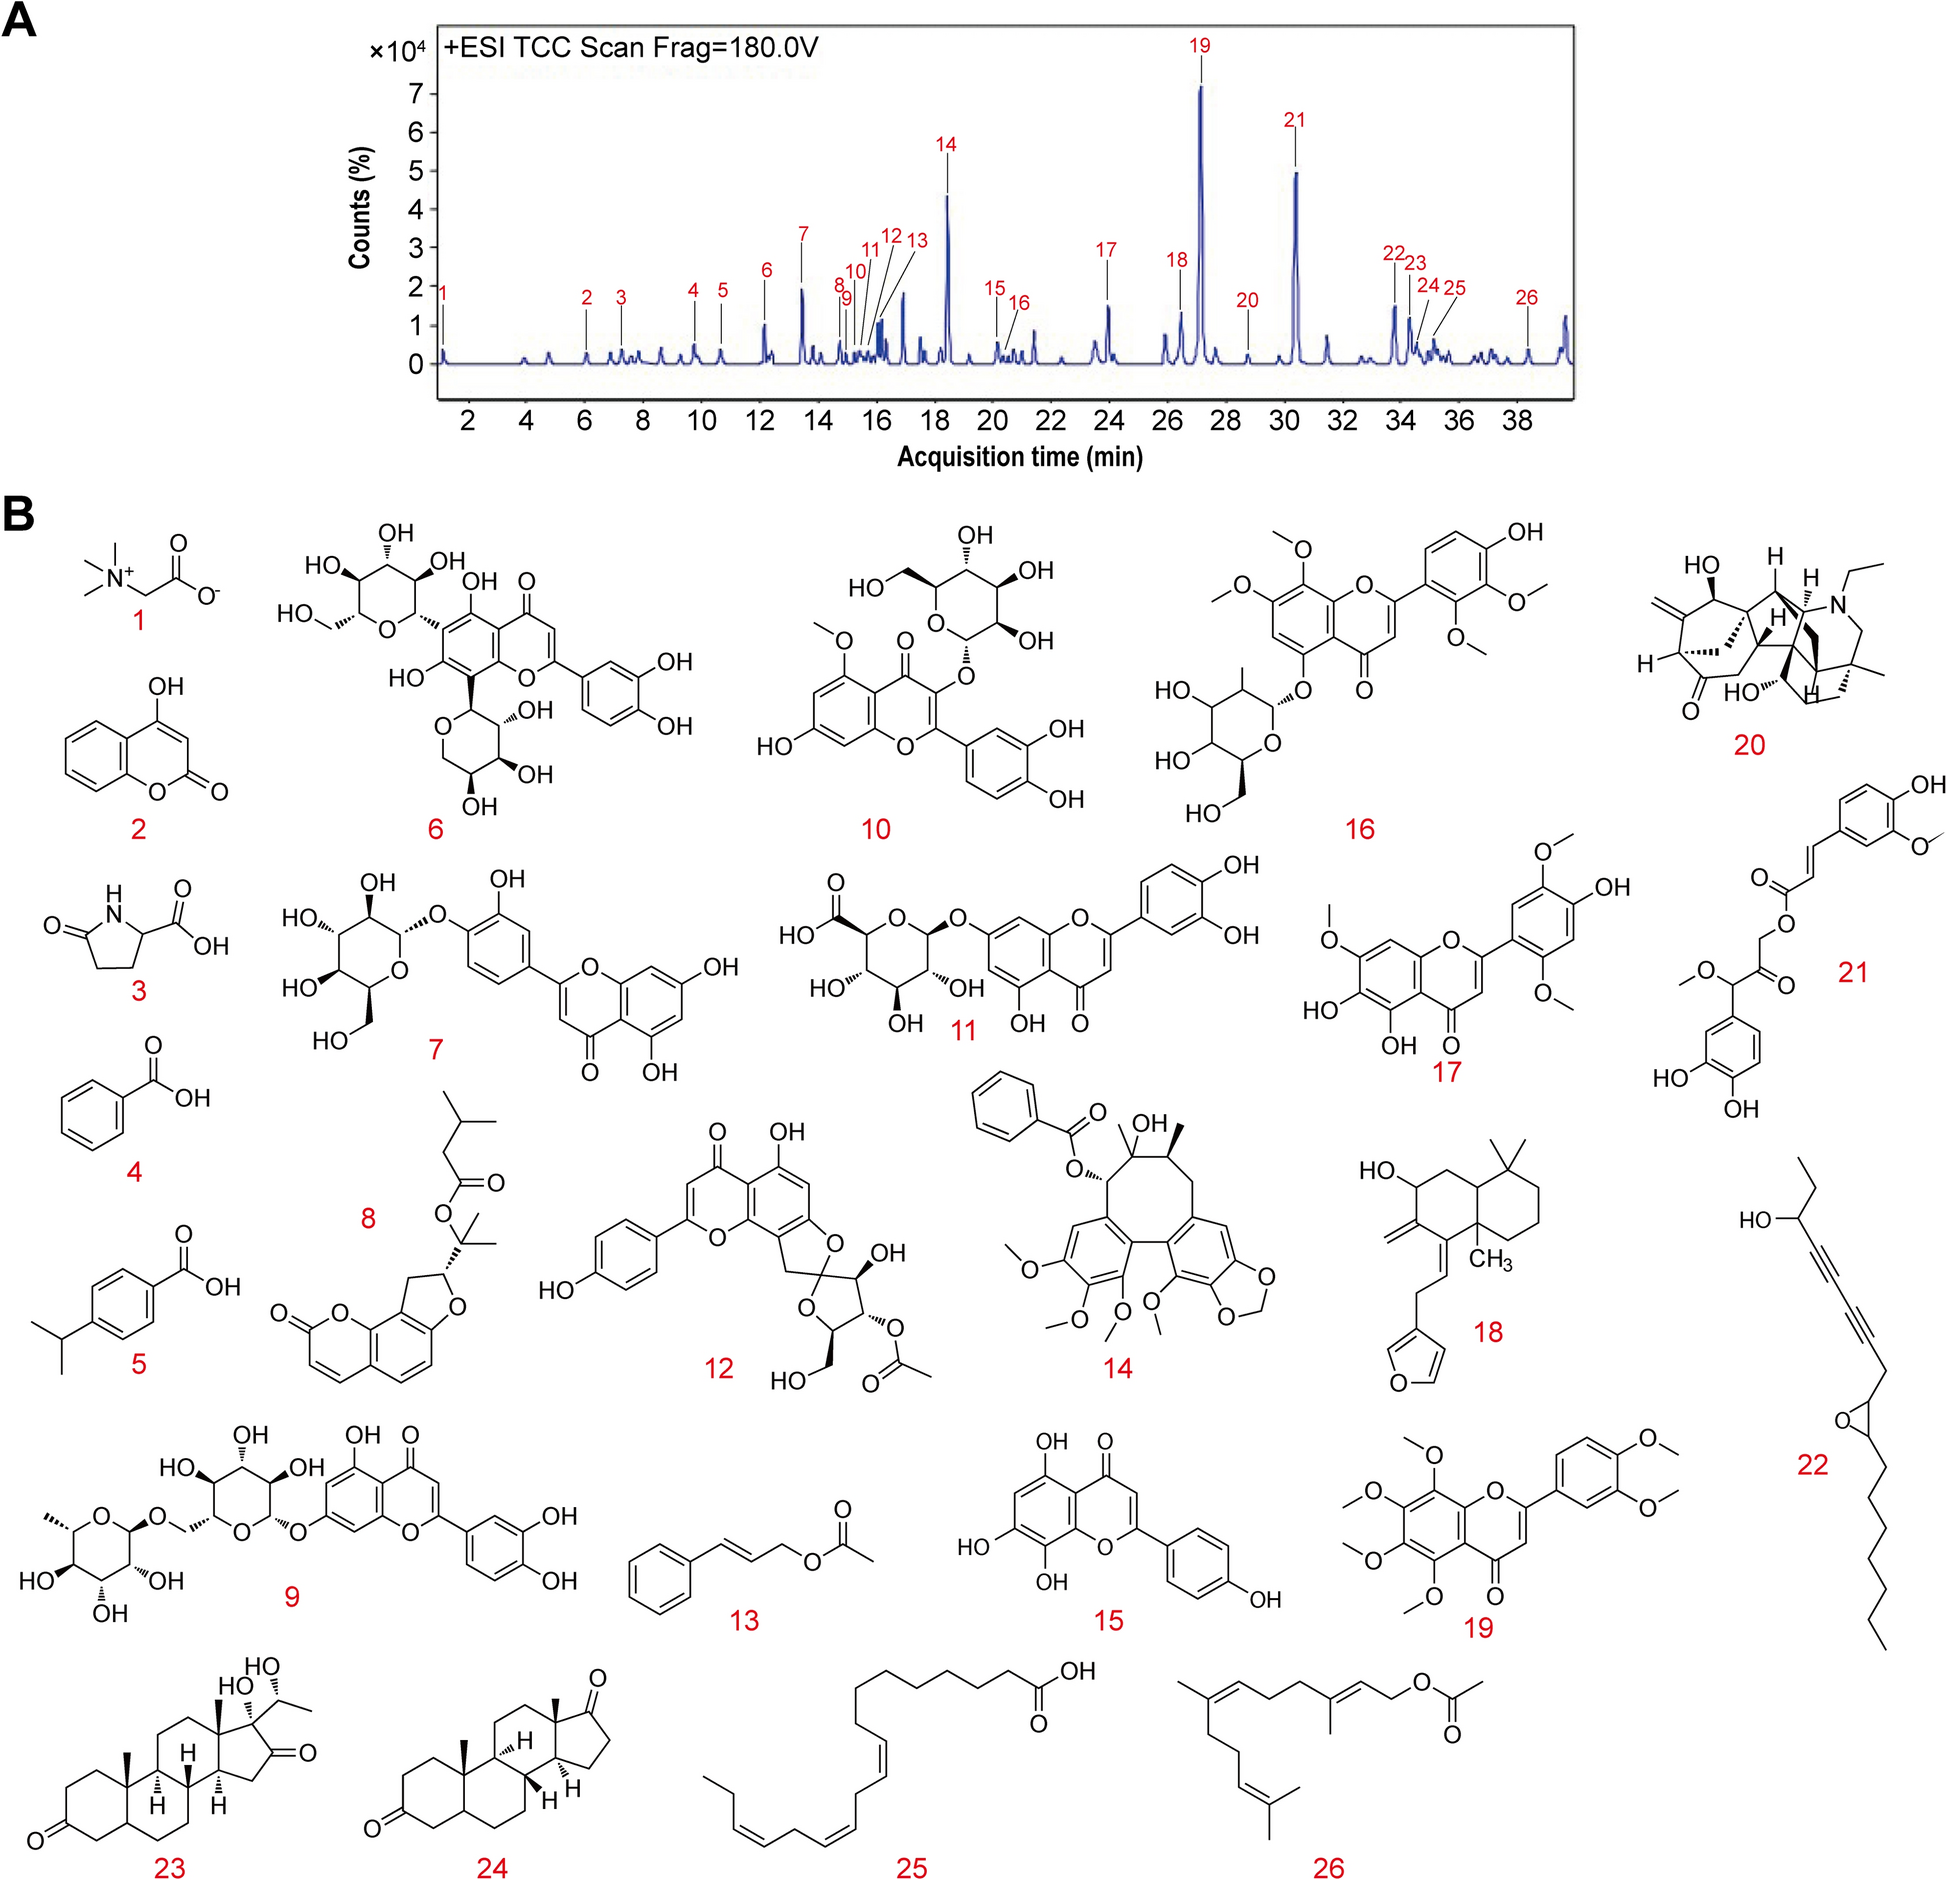
Table 1 Composition of HLJDDThe chemical profiling of HLJDD extract was conducted using ultra-high performance liquid chromatography coupled with quadrupole-Orbitrap high-resolution mass spectrometry (UHPLC-Q-Exactive Orbitrap HRMS). The analysis was performed on an ACQUITY UPLC I-Class Plus system (Waters Corporation, USA) equipped with a Q Exactive mass spectrometer featuring a heated electrospray ionization (HESI) source (Thermo Fisher Scientific, USA). Chromatographic separation was achieved using an ACQUITY UPLC HSS T3 column (2.1 × 100 mm, 1.8 μm) with a binary mobile phase system consisting of 0.1% aqueous formic acid (A) and acetonitrile (B). The gradient elution program was optimized as follows: 0–3 min (0% B), 3–18.5 min (0–20% B), 18.5–20 min (20–35% B), 20–26 min (35–40% B), 26–35 min (40–95% B), 35–38 min (95% B), and 38.1–40 min (0% B), with a constant flow rate of 0.35 mL/min at 45 °C column temperature and 2 μL injection volume. Mass spectrometric detection was performed in both positive and negative ionization modes with the following HESI parameters: spray voltages of + 3.8 kV (positive) and − 3.2 kV (negative), sheath gas flow of 35 arb, auxiliary gas flow of 8 arb, heater temperature at 350 °C, and ion transfer tube temperature at 320 °C. Full-scan MS data were acquired over m/z 100–1500 range at 60,000 resolution, complemented by data-dependent MS2 scans at 15,000 resolution. All acquired data were processed and analyzed using XCMS software (version 4.5.1) for comprehensive compound identification.
AnimalsMale Sprague–Dawley (SD) rats that were eight weeks old and obtained from Chengdu Dossy Experimental Animals Co., Ltd. (Chengdu, China) were used in this investigation. The rats weighed between 200 and 250 g on average and were specific pathogen-free (SPF). They had free access to food and water while housing in SPF conditions at the College of Pharmacy, Chengdu University of Traditional Chinese Medicine (Chengdu, China). The Medical Ethics Committee of the Hospital of Chengdu University of Traditional Chinese Medicine authorized all experimental procedures, which followed the “3R” principles (Approval No. 2024DL-014; Chengdu, China).
Periodontitis model and interventionFollowing one week of acclimatization, all SD rats were randomly assigned to six groups (n = 8 per group): (1) the control (CTL) group; (2) the periodontitis model (PD) group, which received vehicle treatment; (3) the Doxy group, treated with 10 mg/kg doxycycline hyclate (412S031, Solarbio, Beijing, China); (4) the HLJDD-L group, administered 0.75 g/kg HLJDD; (5) the HLJDD-M group, given 1.5 g/kg HLJDD; and (6) the HLJDD-H group, receiving 3 g/kg HLJDD. The optimal high dose of 3 g/kg was determined through preliminary experiments. A medium dose of 0.3 g/kg is equivalent to 6.25 times the standard human clinical dose (adjusted for a 60 kg adult). Low and high doses were set at 1.5 g/kg (½ ×) and 6 g/kg (2 ×), respectively. Subsequent experimental results indicated that the 3 g/kg dose yielded the most significant improvement in MWM performance, accompanied by reduced serum inflammatory factors and decreased P. gingivalis copies in the hippocampus. The experimental timeline and design are presented in Fig. 1.
Fig. 1
Flowchart of experimental design
All the experimental rats, except for the CTL group, were given general anesthesia through an injection of 2% pentobarbital sodium (45 mg/kg; Merck, cat. no. 230816, NJ, USA). Using a mouth opener, we exposed each rat's oral cavity to visualize the bilateral maxillary molars after achieving adequate anesthesia. A 4–0 silk suture was threaded through the gaps next to the second maxillary molar and tied with a surgical knot on the outer side, and P. gingivalis (ATCC 33277) was applied just below the gum line. We assessed the integrity of the ligature three times a week, re-ligating it immediately when necessary. In addition, P. gingivalis was applied subgingivally once every other day. Following a two-week model establishment period, all animal groups received daily oral gavage administrations (10 ml/kg) for 8 consecutive weeks. The modeling stimulation were maintained throughout the entire intervention period, resulting in a total experimental duration of 10 weeks. Upon study completion, rats were euthanized via pentobarbital, and then their mandibular, hippocampal, and colon tissues, along with intestinal contents and blood, were collected for further analysis.
Micro-Computed Tomography (micro-CT) ImagingMandibular specimens were surgically excised from euthanized rats and examined via micro-computed tomography (micro-CT) using a Quantum GX2 scanner (PerkinElmer, USA). The scanning parameters includedt 90 kV voltage, 80 μA current, 4-min acquisition time, an 18 mm field of view, and 36.0 μm isotropic voxel size. Three-dimensional (3D) reconstructions were generated using Auto Viewer Analyze 12.0 software. To quantify alveolar bone loss, we measured the linear distance between the cemento-enamel junction (CEJ) and alveolar bone crest (ABC) at the maxillary second molars.
Behavioral Analysis -Morris Water Maze (MWM) TestAll SD rats were given the MWM test to assess their spatial learning and memory after finishing the gavage treatment. A circular pool (120 cm in diameter and 55 cm in depth) containing a submerged platform (1 cm below water surface; Taimeng Technology, Chengdu, China). The examination comprised two phases: (1) a 4-day acquisition phase where rats learned platform location through four daily trials (one from each quadrant), with manual guidance to the platform after 60 s if needed, followed by a 10-s platform stay; and (2) a probe experiment in which the platform was withdrawn and rats had 60 s to demonstrate spatial memory. Using the MWT-100 video tracking system (Taimeng Technology), the performance was captured and analyzed.
Hematoxylin & eosin (H&E) stainingUsing a microtome, tissue samples from the colon and hippocampal regions were sliced into 5 μm slices after being preserved in 4% paraformaldehyde for 24 h, subsequently dehydrated, and embedded in paraffin wax. Haematoxylin and eosin were applied to stain the finished slices after they had been dewaxed with xylene and run through an aqueous ethanol series. Ultimately, the slices were analyzed and recorded with the Slide Scanning System SQS-12P (Shenzhen Shengqiang Technology Co., Ltd., Shenzhen, China).
Nissl stainingHippocampal sections were prepared following the H&E staining protocol. The sections underwent staining with 0.1% toluidine blue solution at a temperature of 50 °C, followed by an incubation period at 56 °C for 20 min. After air-drying, the sections were coverslipped using a neutral balsam mounting medium. Nissl bodies located in the hippocampus (CA1, CA3, and DG regions) were visualized and imaged using an SQS-12P slide scanning system.
Immunohistochemistry (IHC)Hippocampal slices were collected as described in the H&E staining steps above. After dewaxing and antigen retrieval, sections were washed in phosphate-buffered saline (PBS) and incubated overnight at 4 °C with a primary antibody taigeting APP/β-amyloid (25,524–1-AP, 1:200 dilution; Proteintech). Following PBS washes, sections were incubated with secondary antibody for 20 min at room temperature. After DAB development and hematoxylin counterstaining, sections were dehydrated through a serie of ethanol solutions, cleared in xylene, and mounted with resin. Immunostained sections were imaged using an SQS-12P slide scanning system, and quantitative analysis was performed using ImageJ software (v1.54f; NIH, USA).
Immunofluorescence (IF) assayHippocampal and colon tissue silces were dewaxed and rehydrated with citrate–phosphate buffered saline (CPBS; PH6.0, ZSGB-BIO). Following a 30-min incubation with 3% bovine serum albumin (BSA; Servicebio), slices were treated overnight at 4 °C with primary antibodies (Table 2). On the next day, slices were treated for 1 h at ambient temperature with the secondary antibodies: Cy3-conjugated goat anti-mouse IgG (1:200, Servicebio) and FITC-conjugated goat anti-rabbit IgG (1:300, Servicebio). Sections were mounted with anti-fade medium (Servicebio) and imaged using an OLYMPUS OlyVIA 4.1 system. Quantitative analysis was applied by ImageJ software (v1.54f; NIH, USA).
Table 2 Primary antibodiesEnzyme-linked immunosorbent assay (ELISA)The quantities of TNF–α, IL–1β, IL–4, IL–6, and IL–10 was measured in the hippocampal and colon tissues, as well as in serum samples, utilizing a rat ELISA kit provided by Jiangsu Jingmei Biological Technology Co., Ltd. (Jiangsu, China) in compliance with the guideline.
Western blot (WB)Using specific primary antibodies (Table 2), Western blot analysis was carried to measure the amount of the target protein present in hippocampal tissues. Following the instructions, a BCA protein test kit (Cat# 23,227; Thermo Fisher Scientific, USA) was applied to measure the total protein quantity. The bands detected utilizing a JY-Clear ECL chemiluminescence imaging system (Beijing JUNYI Electrophoresis Co., Ltd).
Real-time quantitative polymerase chain reaction (RT-qPCR)Using an RNAiso Plus Fast Tissue Kit (Takara Biomedical Technology Co. Ltd., Beijing, China), RNA was extracted from rat colonic tissue in accordance with the instructions. The RT Easy™ II Kit (containing gDNase) (FOREGENE, Chengdu, China) was then used to accomplish cDNA synthesis. Table 3 provides specifics on the primer pairings that were utilized.
Table 3 Primers sequences16S rRNA sequencing and data analysisColon content samples were processed to extract genomic DNA utilizing the TGuide S96 Magnetic Stool DNA Kit (Tiangen Biotech, Beijing, China) in accordance with the instructions. Primers 338F (5'-ACTCCTACGGGAGGCAGCA-3') and 806R (5'-GGACTACHVGGGTWTCTAAT-3') were utilized in order to amplify the V3–V4 region of the 16S rRNA genes found in bacteria. This was then followed by sequencing on an Illumina NovaSeq 6000 platform (Biomarker Technologies, Beijing). Raw sequencing data were processed as follows: (1) quality filtering using Trimmomatic (v0.33), (2) primer removal with Cutadapt (v1.9.1), and (3) analysis in QIIME2 (v2020.6) to generate high-quality reads. Operational taxonomic units (OTUs) were classified against the SILVA database (v138). Alpha diversity analysis, utilizing Chao1 index and Shannon indices, was performed with the OTU table in RStudio (v4.4.1) and shown as box plots. Principal coordinate analysis (PCoA) was applied to illustrate the results of a beta diversity analysis with Bray–Curtis dissimilarity. Additionally, to determine which taxa were differently prevalent across groups, the Linear Discriminant Analysis effect size (LEfSe) method was employed.
Network pharmacological analysisThe chemical components of HLJDD were assessed via UHPLC-Q-Exactive Orbitrap HRMS, with compound structures sourced from PubChem. Potential targets were forecasted using SwissTargetPrediction, retaining entries with probability > 0. Common targets among HLJDD, periodontitis, and cognitive impairment were identified from GeneCards, OMIM, and TTD, followed by Venn diagram visualization. A compound–target–disease network was built in Cytoscape (v3.7.1/3.10.3) to depict therapeutic associations. Overlapping targets were used to establish a PPI network via STRING (v12.0). In Cytoscape, core targets were identified using the CentiScape 2.2 plugin by selecting nodes with values above the median in betweenness centrality, closeness centrality, and degree, followed by sorting based on degree. GO and KEGG enrichment analyses were performed in DAVID (v6.8), with top results displayed graphically.
Statistical analysisThe data processing in this study was conducted utilizing two analytical software packages: GraphPad Prism 8.0 and RStudio 4.4.1. Quantitative results are expressed as arithmetic mean values with their corresponding standard errors (mean ± SEM). A one-way analysis of variance (ANOVA) was used for comparisons between different experimental groups, with statistical significance defined at the threshold of p-values less than 0.05.
Comments (0)